Estimated zip code population in 2022: 1,358 Zip code population in 2010: 1,226 Zip code population in 2000: 1,216
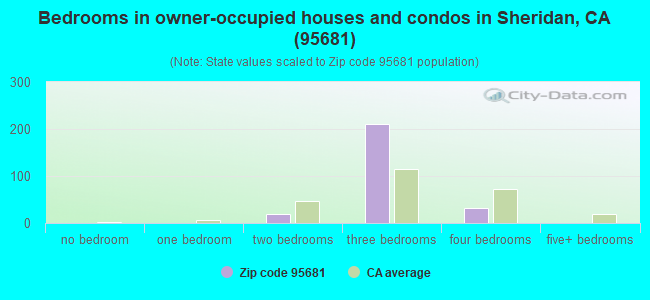
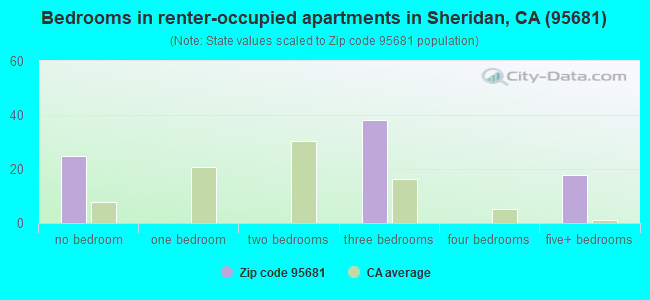
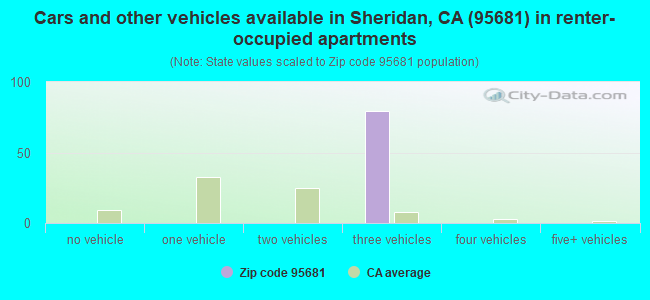
Houses and condos: 422 Renter-occupied apartments: 79
% of renters here:
23%
State:
44%
March 2022 cost of living index in zip code 95681: 95.1 (less than average, U.S. average is 100)
Land area: 17.2 sq. mi. Water area: 0.0 sq. mi.
Population density: 79 people per square mile
(very low).
OSM Map
General Map
Google Map
MSN Map
OSM Map
General Map
Google Map
MSN Map
OSM Map
General Map
Google Map
MSN Map
OSM Map
General Map
Google Map
MSN Map
Please wait while loading the map...
Real estate property taxes paid for housing units in 2022:
This zip code:
1.1% ($4,240)
California:
0.7% ($4,831)
Median real estate property taxes paid for housing units with mortgages in 2022: $5,355 (1.0%) Median real estate property taxes paid for housing units with no mortgage in 2022: $2,635 (0.7%)
Business Search- 14 Million verified businesses
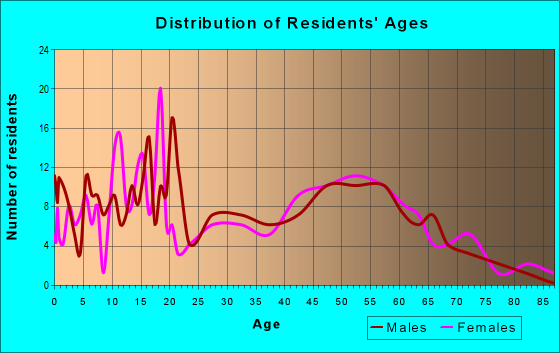
Males: 702
(51.7%)
Females: 655
(48.3%)
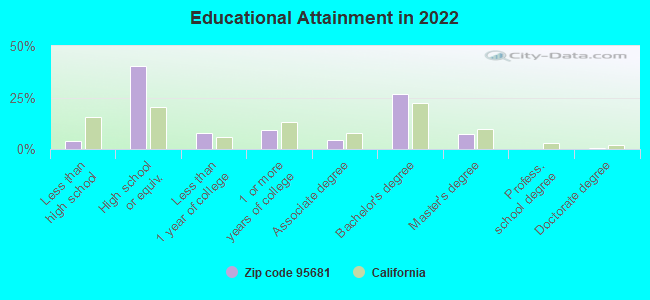
For population 25 years and over in 95681:
High school or higher: 96.2%
Bachelor's degree or higher: 34.6%
Graduate or professional degree: 7.9%
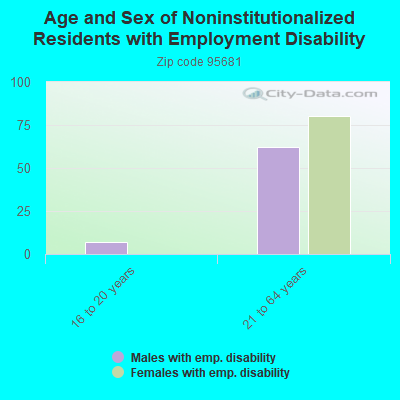
Unemployed: 5.0%
Mean travel time to work (commute): 23.8 minutes
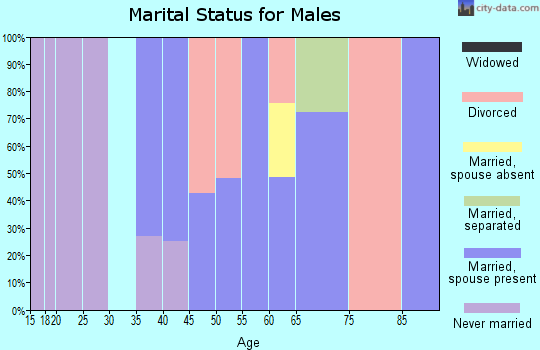
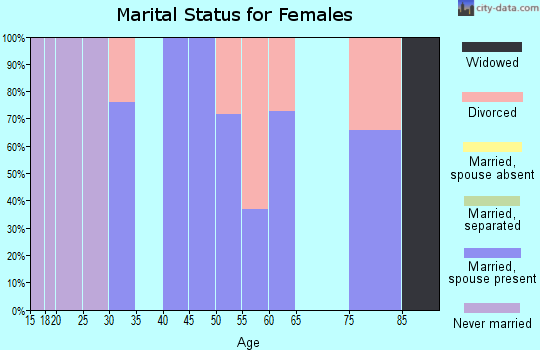
For population 15 years and over in 95681:
Never married: 28.7%
Now married: 61.7%
Separated: 0.0%
Widowed: 4.1%
Divorced: 5.4%
Zip code 95681 compared to state average:
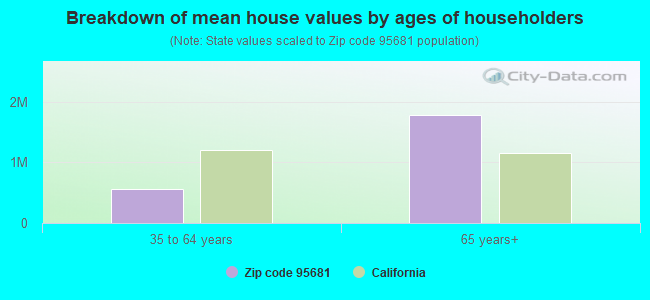
Median house value below state average.
Black race population percentage significantly below state average.
Estimated median house/condo value in 2022: $397,421
95681:
$397,421
California:
$715,900
According to our research of California and other state lists, there was 1 registered sex offender living in 95681 zip code as of April 25, 2024. The ratio of all residents to sex offenders in zip code 95681 is 1,492 to 1. The ratio of registered sex offenders to all residents in this zip code is lower than the state average.
Median resident age:
This zip code:
28.9 years
California median age:
37.9 years
Average household size:
This zip code:
4.0 people
California:
2.8 people
Averages for the 2020 tax year for zip code 95681, filed in 2021:
Average Adjusted Gross Income (AGI) in 2020: $56,329 (Individual Income Tax Returns)
Here:
$56,329
State:
$95,910
Salary/wage: $53,370 (reported on 76.9% of returns)
Here:
$53,370
State:
$77,331
(% of AGI for various income ranges: 1186.4% for AGIs below $25k, 3960.9% for AGIs $25k-50k, 6682.5% for AGIs $50k-75k, 9755.0% for AGIs $75k-100k, 19031.7% for AGIs $100k-200k)
Taxable interest for individuals: $271 (reported on 32.3% of returns)
This zip code:
$271
California:
$2,294
(% of AGI for various income ranges: 2.9% for AGIs below $25k, 9.1% for AGIs $25k-50k, 32.5% for AGIs $50k-75k, 22.5% for AGIs $75k-100k, 13.3% for AGIs $100k-200k)
Ordinary dividends: $1,386 (reported on 10.8% of returns)
Here:
$1,386
State:
$10,949
(% of AGI for various income ranges: 53.8% for AGIs $50k-75k, 90.0% for AGIs $100k-200k)
Profit/loss from business: +$13,011 (reported on 13.8% of returns)
Here:
+$13,011
State:
+$15,671
(% of AGI for various income ranges: 82.1% for AGIs below $25k, 606.4% for AGIs $25k-50k, 972.5% for AGIs $75k-100k)
Taxable individual retirement arrangement distribution: $10,933 (reported on 4.6% of returns)
95681:
$10,933
California:
$23,505
(% of AGI for various income ranges: 298.2% for AGIs $25k-50k)
Total itemized deductions: $29,875 (reported on 12.3% of returns)
Here:
$29,875
State:
$39,517
(% of AGI for various income ranges: 1280.0% for AGIs $50k-75k, 2276.7% for AGIs $100k-200k)
Charity contributions: $4,867 (reported on 9.2% of returns)
Here:
$4,867
State:
$12,598
(% of AGI for various income ranges: 177.5% for AGIs $50k-75k, 250.0% for AGIs $100k-200k)
Taxes paid: $7,838 (reported on 12.3% of returns)
95681:
$7,838
State:
$8,807
(% of AGI for various income ranges: 331.2% for AGIs $50k-75k, 603.3% for AGIs $100k-200k)
Earned income credit: $1,862 (reported on 12.3% of returns)
Here:
$1,862
State:
$2,074
(% of AGI for various income ranges: 60.7% for AGIs below $25k, 58.2% for AGIs $25k-50k)
Percentage of individuals using paid preparers for their 2020 taxes: 89.2%
Here:
89%
State:
92%
(% for various income ranges: 90.0% for AGIs below $25k, 87.5% for AGIs $25k-50k, 91.7% for AGIs $50k-75k, 85.7% for AGIs $75k-100k, 90.0% for AGIs $100k-200k)
Averages for the 2012 tax year for zip code 95681, filed in 2013:
Average Adjusted Gross Income (AGI) in 2012: $44,515 (Individual Income Tax Returns)
Here:
$44,515
State:
$72,726
Salary/wage: $41,512 (reported on 76.9% of returns)
Here:
$41,512
State:
$59,079
(% of AGI for various income ranges: 57.9% for AGIs below $25k, 72.6% for AGIs $25k-50k, 73.5% for AGIs $50k-75k, 71.9% for AGIs $75k-100k, 75.3% for AGIs $100k-200k)
Taxable interest for individuals: $368 (reported on 36.5% of returns)
This zip code:
$368
California:
$2,146
(% of AGI for various income ranges: 0.6% for AGIs below $25k, 0.6% for AGIs $25k-50k, 0.4% for AGIs $50k-75k)
Ordinary dividends: $700 (reported on 9.6% of returns)
Here:
$700
State:
$9,308
Profit/loss from business: +$8,264 (reported on 21.2% of returns)
Here:
+$8,264
State:
+$17,064
(% of AGI for various income ranges: 15.9% for AGIs below $25k, 3.8% for AGIs $25k-50k, 7.0% for AGIs $75k-100k)
Taxable individual retirement arrangement distribution: $7,225 (reported on 7.7% of returns)
95681:
$7,225
California:
$19,557
Total itemized deductions: $22,637 (31% of AGI, reported on 36.5% of returns)
Here:
$22,637
State:
$34,004
Here:
31.5% of AGI
State:
22.7% of AGI
(% of AGI for various income ranges: 17.0% for AGIs below $25k, 15.5% for AGIs $25k-50k, 13.7% for AGIs $50k-75k, 23.6% for AGIs $75k-100k, 21.9% for AGIs $100k-200k)
Charity contributions: $2,227 (reported on 28.8% of returns)
Here:
$2,227
State:
$4,659
(% of AGI for various income ranges: 2.0% for AGIs $25k-50k, 1.2% for AGIs $50k-75k, 1.0% for AGIs $75k-100k, 2.1% for AGIs $100k-200k)
Taxes paid: $5,942 (reported on 36.5% of returns)
95681:
$5,942
State:
$14,448
(% of AGI for various income ranges: 3.0% for AGIs below $25k, 3.4% for AGIs $25k-50k, 4.0% for AGIs $50k-75k, 5.7% for AGIs $75k-100k, 6.9% for AGIs $100k-200k)
Earned income credit: $2,373 (reported on 21.2% of returns)
Here:
$2,373
State:
$2,286
(% of AGI for various income ranges: 7.8% for AGIs below $25k, 1.1% for AGIs $25k-50k)
Percentage of individuals using paid preparers for their 2012 taxes: 61.5%
Here:
62%
State:
64%
(% for various income ranges: 57.1% for AGIs below $25k, 61.5% for AGIs $25k-50k, 62.5% for AGIs $50k-75k, 80.0% for AGIs $75k-100k, 60.0% for AGIs $100k-200k)
Averages for the 2004 tax year for zip code 95681, filed in 2005:
Average Adjusted Gross Income (AGI) in 2004: $38,501 (Individual Income Tax Returns)
Here:
$38,501
State:
$58,600
Salary/wage: $37,450 (reported on 85.4% of returns)
Here:
$37,450
State:
$49,455
(% of AGI for various income ranges: 75.6% for AGIs $10k-25k, 85.2% for AGIs $25k-50k, 90.2% for AGIs $50k-75k, 84.3% for AGIs $75k-100k, 65.0% for AGIs over 100k)
Taxable interest for individuals: $418 (reported on 43.3% of returns)
This zip code:
$418
California:
$2,365
(% of AGI for various income ranges: 1.0% for AGIs $10k-25k, 0.8% for AGIs $25k-50k, 0.2% for AGIs $50k-75k, 0.1% for AGIs $75k-100k, 0.2% for AGIs over 100k)
Taxable dividends: $356 (reported on 13.3% of returns)
Here:
$356
State:
$4,746
(% of AGI for various income ranges: 0.2% for AGIs $10k-25k, 0.1% for AGIs $25k-50k, 0.1% for AGIs $50k-75k, 0.2% for AGIs $75k-100k)
Profit/loss from business: +$14,446 (reported on 16.8% of returns)
Here:
+$14,446
State:
+$16,826
(% of AGI for various income ranges: 10.4% for AGIs $10k-25k, 4.9% for AGIs $25k-50k, 1.4% for AGIs $50k-75k, 19.2% for AGIs $75k-100k)
IRA payment deduction: $1,600 (reported on 1.8% of returns)
95681:
$1,600
California:
$3,192
Total itemized deductions: $19,705 (31% of AGI, reported on 40.2% of returns)
Here:
$19,705
State:
$28,113
Here:
31.5% of AGI
State:
25.3% of AGI
(% of AGI for various income ranges: 21.3% for AGIs $10k-25k, 16.6% for AGIs $25k-50k, 20.9% for AGIs $50k-75k, 24.2% for AGIs $75k-100k, 21.9% for AGIs over 100k)
Charity contributions deductions: $2,262 (3% of AGI, reported on 33.5% of returns)
Here:
$2,262
State:
$3,923
Here:
3.5% of AGI
State:
3.3% of AGI
(% of AGI for various income ranges: 2.1% for AGIs $10k-25k, 1.6% for AGIs $25k-50k, 1.2% for AGIs $50k-75k, 3.0% for AGIs $75k-100k, 2.2% for AGIs over 100k)
Total tax: $4,713 (reported on 70.0% of returns)
95681:
$4,713
State:
$10,761
(% of AGI for various income ranges: 4.6% for AGIs $10k-25k, 6.0% for AGIs $25k-50k, 7.1% for AGIs $50k-75k, 9.3% for AGIs $75k-100k, 14.9% for AGIs over 100k)
Earned income credit: $1,638 (reported on 14.6% of returns)
Here:
$1,638
State:
$1,763
Percentage of individuals using paid preparers for their 2004 taxes: 63.3%
Here:
63%
State:
66%
(% for various income ranges: 53.4% for AGIs below $10k, 54.8% for AGIs $10k-25k, 67.3% for AGIs $25k-50k, 75.6% for AGIs $50k-75k, 65.2% for AGIs $75k-100k, 73.3% for AGIs over 100k)
Household received Food Stamps/SNAP in the past 12 months: 139 Household did not receive Food Stamps/SNAP in the past 12 months: 222
Women who did not have a birth in the past 12 months: 366 (171 now married, 193 unmarried)
Housing units in zip code 95681 with a mortgage: 136 (28 second mortgage, 15 both second mortgage and home equity loan) Median monthly owner costs for units with a mortgage: $2,450 Median monthly owner costs for units without a mortgage: $561
Residents with income below the poverty level in 2022:
This zip code:
1.5%
Whole state:
12.2%
Median number of rooms in houses and condos:
Here:
5.1
State:
6.0
Median number of rooms in apartments:
Here:
5.4
State:
3.9
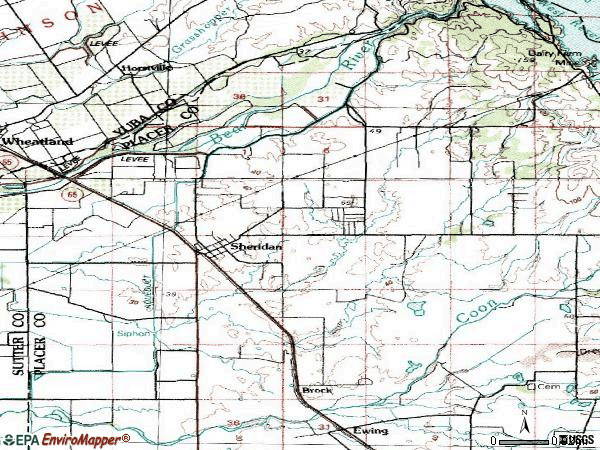
Notable locations in this zip code not listed on our city pages
Notable locations in zip code 95681: Camp Far West Ranch (A), Placer County Fire Department Station 78 Sheridan (B). Display/hide their locations on the map
Size of family households: 90 2-persons, 37 3-persons, 66 4-persons, 89 5-persons, 37 6-persons
Size of nonfamily households: 15 1-person
354 married couples with children.
80 single-parent households (80 women).
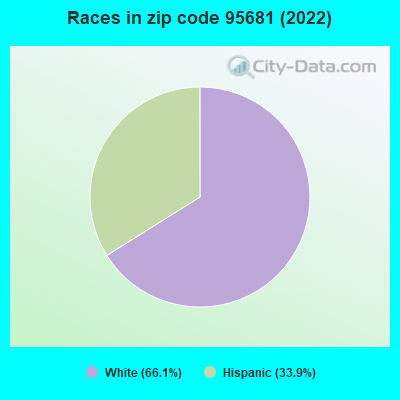
61.8% of residents of 95681 zip code speak English at home.
29.5% of residents speak Spanish at home (46% very well, 54% well).
8.6% of residents speak other Indo-European language at home (32% well, 68% not well).
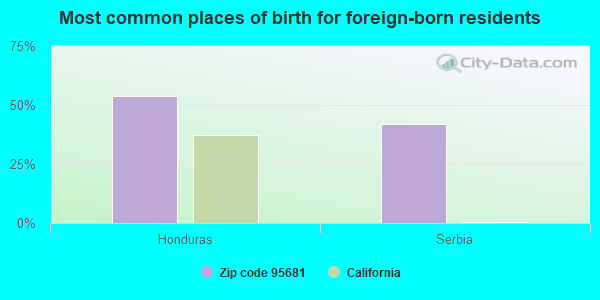
Foreign born population: 275 (20.3%) (1.8% of them are naturalized citizens)
This zip code:
20.3%
Whole state:
26.7%
54%Honduras
42%Serbia
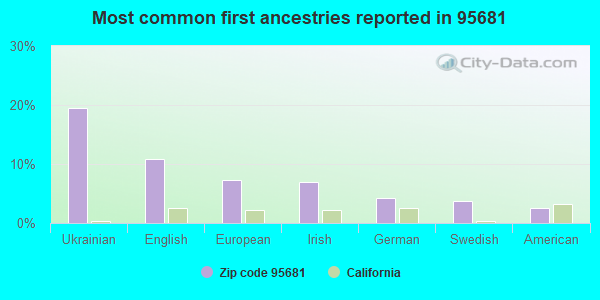
20%Ukrainian
11%English
7%European
7%Irish
4%German
4%Swedish
2%American
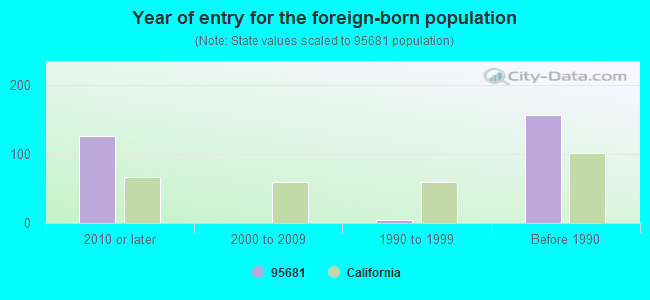
Year of entry for the foreign-born population
1262010 or later
02000 to 2009
41990 to 1999
156Before 1990
Housing units lacking complete plumbing facilities: 9.6% Housing units lacking complete kitchen facilities: 9.0%
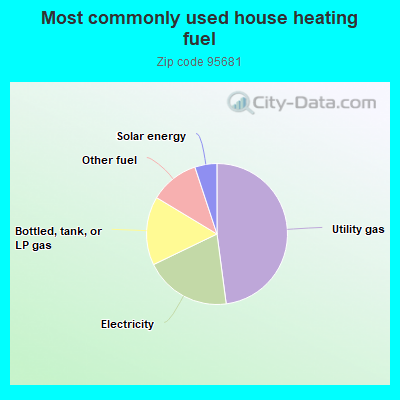
48.3%Utility gas
20.1%Electricity
15.9%Bottled, tank, or LP gas
11.4%Other fuel
5.1%Solar energy
Population in 1990: 1,169. Population change in the 1990s: +47 (+4.0%).
Place of birth for U.S.-born residents:
This state: 957
Midwest: 57
South: 14
West: 51
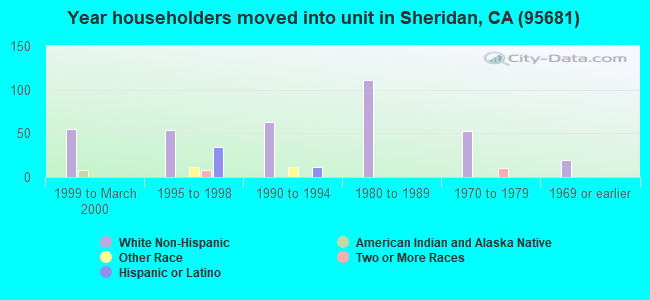
68% of the 95681 zip code residents lived in the same house 5 years ago. Out of people who lived in different houses, 58% lived in this county. Out of people who lived in different counties, 50% lived in California.
101% of the 95681 zip code residents lived in the same house 1 year ago.
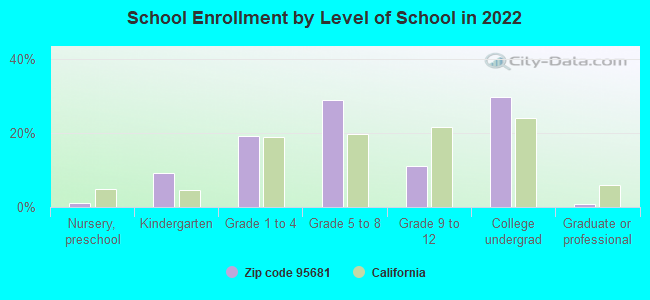
Private vs. public school enrollment:
Students in private schools in grades 1 to 8 (elementary and middle school): 25
Here:
9.6%
California:
10.5%
Students in private schools in grades 9 to 12 (high school):
Here:
0.0%
California:
8.5%
Students in private undergraduate colleges:
Here:
0.0%
California:
15.9%
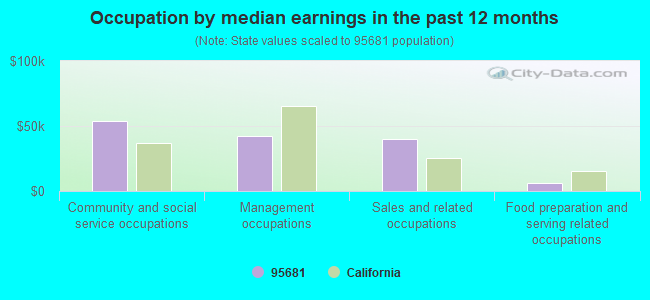
Occupation by median earnings in the past 12 months ($)
53,589Community and social service occupations
42,150Management occupations
40,239Sales and related occupations
6,474Food preparation and serving related occupations
Companies with federal contracts located in this zip code:
WESTERN TURK INC (5040 RIOSA RD in SHERIDAN, CA; small business) : $167,986 in 2 contractsfrom 2003 to 2004
$99,706 with Air Force for Trailers. Signed on 2003-09-30. Completion date: 2003-11-30.
$68,280 with Air Force for Modification of Equipment -- Vehicular Equipment Components. Signed on 2004-06-18. Completion date: 2004-09-23.
Top industries in this zip code by the number of employees in 2005:
Mining: Construction Sand and Gravel Mining (20-49 employees: 1 establishment)
Health Care and Social Assistance: Offices of Physicians (except Mental Health Specialists) (10-19: 1)
Administrative and Support and Waste Management and Remediation Services: Landscaping Services (5-9: 1, 1-4: 1)
Construction: Electrical Contractors (5-9: 1)
Health Care and Social Assistance: Child Day Care Services (5-9: 1)
Other Services (except Public Administration): Religious Organizations (1-4: 2)
Professional, Scientific, and Technical Services: Offices of Certified Public Accountants (1-4: 1)
Home Mortgage Disclosure Act Aggregated Statistics For Year 2009 (Based on 2 partial tracts)
A) FHA, FSA/RHS & VA Home Purchase Loans
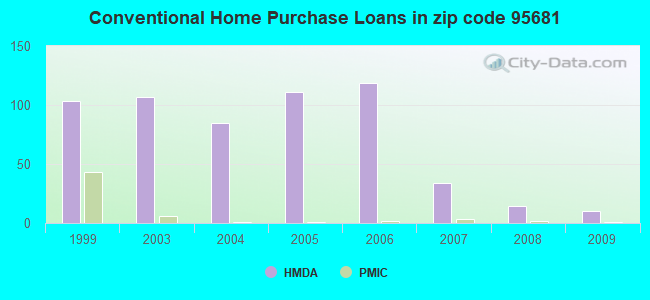
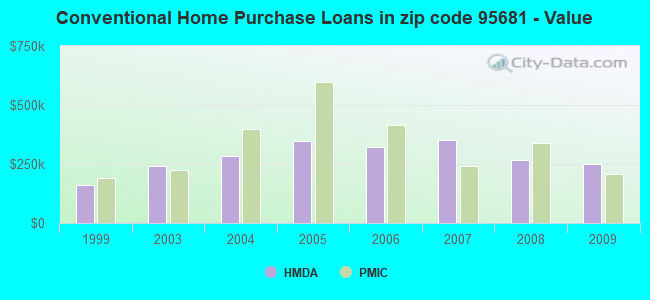
B) Conventional Home Purchase Loans
C) Refinancings
D) Home Improvement Loans
F) Non-occupant Loans on < 5 Family Dwellings (A B C & D)
G) Loans On Manufactured Home Dwelling (A B C & D)
Number
Average Value
Number
Average Value
Number
Average Value
Number
Average Value
Number
Average Value
Number
Average Value
LOANS ORIGINATED
13
$251,194
10
$250,795
59
$287,745
4
$125,598
5
$197,652
3
$279,103
APPLICATIONS APPROVED, NOT ACCEPTED
1
$198,220
1
$390,180
5
$358,734
0
$0
0
$0
0
$0
APPLICATIONS DENIED
3
$285,180
2
$226,130
34
$331,792
3
$84,490
5
$216,562
5
$299,496
APPLICATIONS WITHDRAWN
1
$354,860
2
$234,105
20
$299,354
0
$0
3
$233,347
2
$279,390
FILES CLOSED FOR INCOMPLETENESS
1
$424,920
0
$0
3
$383,340
1
$232,400
0
$0
0
$0
Aggregated Statistics For Year 2008 (Based on 2 partial tracts)
A) FHA, FSA/RHS & VA Home Purchase Loans
B) Conventional Home Purchase Loans
C) Refinancings
D) Home Improvement Loans
F) Non-occupant Loans on < 5 Family Dwellings (A B C & D)
G) Loans On Manufactured Home Dwelling (A B C & D)
Number
Average Value
Number
Average Value
Number
Average Value
Number
Average Value
Number
Average Value
Number
Average Value
LOANS ORIGINATED
3
$294,483
14
$267,916
41
$298,484
4
$50,980
5
$276,370
2
$130,440
APPLICATIONS APPROVED, NOT ACCEPTED
1
$140,690
2
$246,920
15
$344,001
2
$99,965
0
$0
2
$324,100
APPLICATIONS DENIED
1
$308,720
3
$489,287
52
$341,859
7
$50,857
5
$220,550
6
$208,473
APPLICATIONS WITHDRAWN
3
$287,457
3
$601,877
23
$364,519
3
$73,480
1
$237,520
1
$191,960
FILES CLOSED FOR INCOMPLETENESS
0
$0
2
$360,840
5
$347,798
0
$0
0
$0
1
$152,080
Aggregated Statistics For Year 2007 (Based on 2 partial tracts)
A) FHA, FSA/RHS & VA Home Purchase Loans
B) Conventional Home Purchase Loans
C) Refinancings
D) Home Improvement Loans
E) Loans on Dwellings For 5+ Families
F) Non-occupant Loans on < 5 Family Dwellings (A B C & D)
G) Loans On Manufactured Home Dwelling (A B C & D)
Number
Average Value
Number
Average Value
Number
Average Value
Number
Average Value
Number
Average Value
Number
Average Value
Number
Average Value
LOANS ORIGINATED
1
$187,970
34
$349,667
97
$319,557
19
$133,766
0
$0
11
$274,133
11
$254,663
APPLICATIONS APPROVED, NOT ACCEPTED
0
$0
6
$245,877
23
$344,534
7
$154,606
0
$0
2
$590,390
5
$180,336
APPLICATIONS DENIED
0
$0
19
$419,316
69
$374,780
15
$184,702
1
$222,140
5
$343,468
7
$283,661
APPLICATIONS WITHDRAWN
0
$0
10
$481,882
22
$400,325
5
$287,762
0
$0
5
$266,344
1
$93,410
FILES CLOSED FOR INCOMPLETENESS
0
$0
3
$341,380
14
$379,109
2
$39,300
0
$0
1
$390,180
1
$22,780
Aggregated Statistics For Year 2006 (Based on 2 partial tracts)
A) FHA, FSA/RHS & VA Home Purchase Loans
B) Conventional Home Purchase Loans
C) Refinancings
D) Home Improvement Loans
F) Non-occupant Loans on < 5 Family Dwellings (A B C & D)
G) Loans On Manufactured Home Dwelling (A B C & D)
Number
Average Value
Number
Average Value
Number
Average Value
Number
Average Value
Number
Average Value
Number
Average Value
LOANS ORIGINATED
1
$178,280
119
$322,643
123
$297,850
27
$171,429
19
$290,346
7
$204,730
APPLICATIONS APPROVED, NOT ACCEPTED
0
$0
17
$364,376
24
$272,981
4
$164,472
3
$439,920
2
$235,245
APPLICATIONS DENIED
0
$0
31
$369,303
84
$334,111
11
$216,604
7
$381,144
7
$200,824
APPLICATIONS WITHDRAWN
0
$0
43
$317,665
40
$292,048
2
$125,880
3
$259,357
1
$381,630
FILES CLOSED FOR INCOMPLETENESS
0
$0
7
$348,107
12
$345,462
0
$0
3
$343,280
0
$0
Aggregated Statistics For Year 2005 (Based on 2 partial tracts)
A) FHA, FSA/RHS & VA Home Purchase Loans
B) Conventional Home Purchase Loans
C) Refinancings
D) Home Improvement Loans
F) Non-occupant Loans on < 5 Family Dwellings (A B C & D)
G) Loans On Manufactured Home Dwelling (A B C & D)
Number
Average Value
Number
Average Value
Number
Average Value
Number
Average Value
Number
Average Value
Number
Average Value
LOANS ORIGINATED
1
$131,580
111
$349,385
158
$301,207
26
$166,279
22
$315,791
9
$265,750
APPLICATIONS APPROVED, NOT ACCEPTED
0
$0
33
$336,513
26
$333,282
3
$191,007
11
$350,977
3
$176,197
APPLICATIONS DENIED
0
$0
49
$353,640
66
$328,642
16
$147,242
7
$321,580
12
$235,482
APPLICATIONS WITHDRAWN
1
$177,720
34
$369,034
50
$320,092
4
$332,648
7
$308,967
3
$281,193
FILES CLOSED FOR INCOMPLETENESS
0
$0
5
$386,644
24
$305,733
2
$354,575
1
$159,490
2
$162,335
Aggregated Statistics For Year 2004 (Based on 2 partial tracts)
A) FHA, FSA/RHS & VA Home Purchase Loans
B) Conventional Home Purchase Loans
C) Refinancings
D) Home Improvement Loans
F) Non-occupant Loans on < 5 Family Dwellings (A B C & D)
G) Loans On Manufactured Home Dwelling (A B C & D)
Number
Average Value
Number
Average Value
Number
Average Value
Number
Average Value
Number
Average Value
Number
Average Value
LOANS ORIGINATED
0
$0
85
$284,217
157
$256,813
31
$130,494
23
$231,728
9
$227,840
APPLICATIONS APPROVED, NOT ACCEPTED
0
$0
17
$264,663
25
$269,079
3
$91,897
3
$247,587
2
$242,935
APPLICATIONS DENIED
1
$162,340
32
$291,564
60
$264,968
16
$116,982
10
$222,030
10
$197,025
APPLICATIONS WITHDRAWN
0
$0
23
$289,332
45
$237,764
4
$123,460
5
$281,724
3
$147,907
FILES CLOSED FOR INCOMPLETENESS
0
$0
10
$225,562
22
$275,427
2
$53,825
0
$0
3
$218,727
Aggregated Statistics For Year 2003 (Based on 2 partial tracts)
A) FHA, FSA/RHS & VA Home Purchase Loans
B) Conventional Home Purchase Loans
C) Refinancings
D) Home Improvement Loans
F) Non-occupant Loans on < 5 Family Dwellings (A B C & D)
Number
Average Value
Number
Average Value
Number
Average Value
Number
Average Value
Number
Average Value
LOANS ORIGINATED
3
$180,753
107
$241,042
264
$221,805
16
$64,863
20
$200,870
APPLICATIONS APPROVED, NOT ACCEPTED
0
$0
10
$282,522
32
$205,198
3
$112,780
3
$220,813
APPLICATIONS DENIED
1
$89,430
18
$253,061
67
$228,988
11
$32,571
5
$136,704
APPLICATIONS WITHDRAWN
1
$168,600
21
$202,262
59
$196,454
3
$168,980
7
$165,266
FILES CLOSED FOR INCOMPLETENESS
0
$0
5
$264,294
11
$223,801
1
$52,400
2
$163,760
Aggregated Statistics For Year 1999 (Based on 1 partial tract)
A) FHA, FSA/RHS & VA Home Purchase Loans
B) Conventional Home Purchase Loans
C) Refinancings
D) Home Improvement Loans
F) Non-occupant Loans on < 5 Family Dwellings (A B C & D)
Detailed PMIC statistics for the following Tracts:0213.04
2005 - 2018 National Fire Incident Reporting System (NFIRS) incidents
According to the data from the years 2005 - 2018 the average number of fires per year is 12. The highest number of fires - 27 took place in 2017, and the least - 4 in 2005. The data has an increasing trend.
When looking into fire subcategories, the most incidents belonged to: Outside Fires (67.9%), and Structure Fires (17.9%).
Fire incident types reported to NFIRS in Zip Code 95681
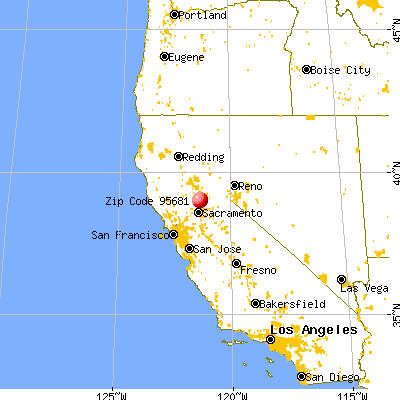


 Nearest zip codes: 95692, 95648, 95903, 95674, 95977, 95765.
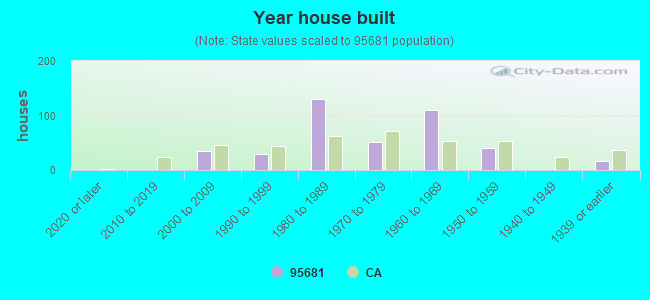


 : $167,986 in 2 contracts from 2003 to 2004
 According to the data from the years 2005 - 2018 the average number of fires per year is 12. The highest number of fires - 27 took place in 2017, and the least - 4 in 2005. The data has an increasing trend.
 When looking into fire subcategories, the most incidents belonged to: Outside Fires (67.9%), and Structure Fires (17.9%).