Estimated zip code population in 2022: 9,520 Zip code population in 2010: 9,156 Zip code population in 2000: 8,397
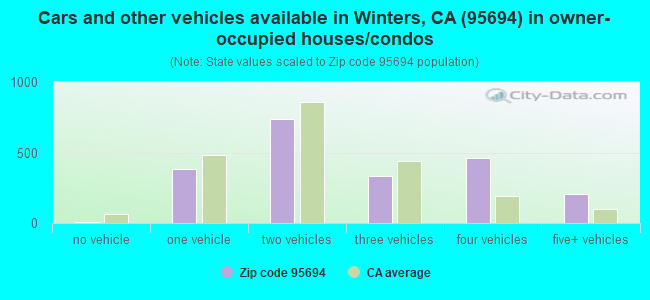
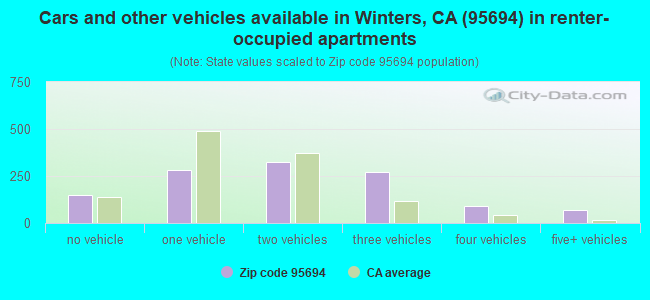
Houses and condos: 3,521 Renter-occupied apartments: 1,186
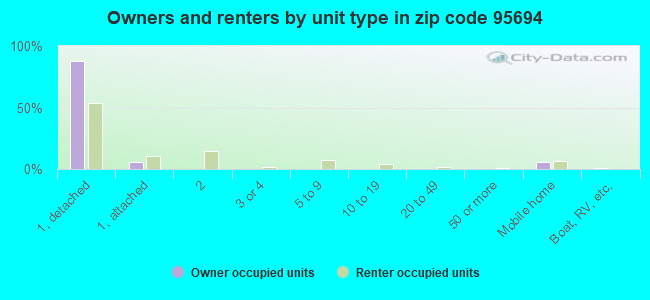
% of renters here:
36%
State:
44%
March 2022 cost of living index in zip code 95694: 101.0 (near average, U.S. average is 100)
Land area: 149.2 sq. mi. Water area: 0.4 sq. mi.
Population density: 64 people per square mile
(very low).
OSM Map
General Map
Google Map
MSN Map
OSM Map
General Map
Google Map
MSN Map
OSM Map
General Map
Google Map
MSN Map
OSM Map
General Map
Google Map
MSN Map
Please wait while loading the map...
Real estate property taxes paid for housing units in 2022:
This zip code:
0.6% ($3,819)
California:
0.7% ($4,831)
Median real estate property taxes paid for housing units with mortgages in 2022: $4,004 (0.6%) Median real estate property taxes paid for housing units with no mortgage in 2022: $2,948 (0.6%)
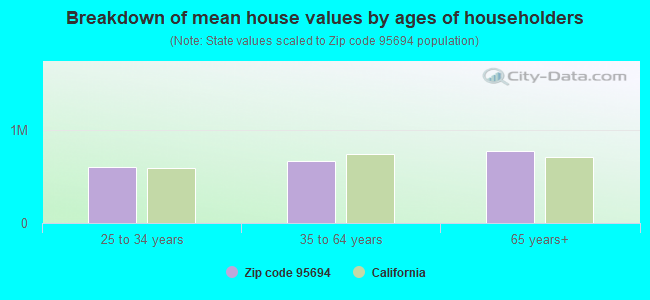
Estimated median house/condo value in 2022: $597,868
95694:
$597,868
California:
$715,900
According to our research of California and other state lists, there were 11 registered sex offenders living in 95694 zip code as of April 25, 2024. The ratio of all residents to sex offenders in zip code 95694 is 906 to 1. The ratio of registered sex offenders to all residents in this zip code is near the state average.
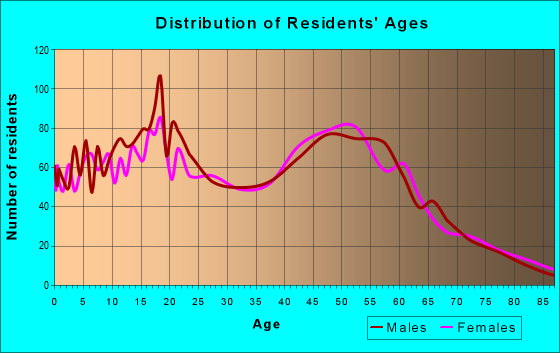
Median resident age:
This zip code:
40.5 years
California median age:
37.9 years
Average household size:
This zip code:
2.9 people
California:
2.8 people
Averages for the 2020 tax year for zip code 95694, filed in 2021:
Average Adjusted Gross Income (AGI) in 2020: $82,710 (Individual Income Tax Returns)
Here:
$82,710
State:
$95,910
Salary/wage: $65,562 (reported on 83.1% of returns)
Here:
$65,562
State:
$77,331
(% of AGI for various income ranges: 1413.7% for AGIs below $25k, 4355.2% for AGIs $25k-50k, 7695.6% for AGIs $50k-75k, 11681.7% for AGIs $75k-100k, 20594.1% for AGIs $100k-200k, 72446.7% for AGIs over 200k)
Taxable interest for individuals: $2,936 (reported on 37.5% of returns)
This zip code:
$2,936
California:
$2,294
(% of AGI for various income ranges: 26.7% for AGIs below $25k, 26.1% for AGIs $25k-50k, 29.6% for AGIs $50k-75k, 54.0% for AGIs $75k-100k, 148.5% for AGIs $100k-200k, 4524.4% for AGIs over 200k)
Ordinary dividends: $10,977 (reported on 16.7% of returns)
Here:
$10,977
State:
$10,949
(% of AGI for various income ranges: 30.6% for AGIs below $25k, 24.5% for AGIs $25k-50k, 47.3% for AGIs $50k-75k, 177.0% for AGIs $75k-100k, 496.6% for AGIs $100k-200k, 6413.3% for AGIs over 200k)
Net capital gain/loss in AGI: +$16,764 (reported on 16.3% of returns)
Here:
+$16,764
State:
+$49,306
(% of AGI for various income ranges: 12.8% for AGIs below $25k, 40.5% for AGIs $25k-50k, 34.2% for AGIs $50k-75k, 154.7% for AGIs $75k-100k, 582.2% for AGIs $100k-200k, 11080.0% for AGIs over 200k)
Profit/loss from business: +$16,875 (reported on 13.0% of returns)
Here:
+$16,875
State:
+$15,671
(% of AGI for various income ranges: 113.7% for AGIs below $25k, 115.6% for AGIs $25k-50k, 208.8% for AGIs $50k-75k, 495.7% for AGIs $75k-100k, 737.3% for AGIs $100k-200k, 3862.2% for AGIs over 200k)
Taxable individual retirement arrangement distribution: $19,412 (reported on 6.5% of returns)
95694:
$19,412
California:
$23,505
(% of AGI for various income ranges: 42.2% for AGIs below $25k, 54.9% for AGIs $25k-50k, 143.5% for AGIs $50k-75k, 233.3% for AGIs $75k-100k, 530.5% for AGIs $100k-200k, 2088.9% for AGIs over 200k)
Self-employed (Keogh) retirement plans: $21,767 (reported on 0.6% of returns)
95694:
$21,767
California:
$30,163
(% of AGI for various income ranges: 217.7% for AGIs $75k-100k)
Total itemized deductions: $32,171 (reported on 13.8% of returns)
Here:
$32,171
State:
$39,517
(% of AGI for various income ranges: 89.2% for AGIs below $25k, 146.2% for AGIs $25k-50k, 439.2% for AGIs $50k-75k, 1021.3% for AGIs $75k-100k, 1842.2% for AGIs $100k-200k, 8094.4% for AGIs over 200k)
Charity contributions: $6,178 (reported on 11.0% of returns)
Here:
$6,178
State:
$12,598
(% of AGI for various income ranges: 21.6% for AGIs $25k-50k, 35.6% for AGIs $50k-75k, 78.7% for AGIs $75k-100k, 271.2% for AGIs $100k-200k, 1826.7% for AGIs over 200k)
Taxes paid: $8,518 (reported on 13.8% of returns)
95694:
$8,518
State:
$8,807
(% of AGI for various income ranges: 16.0% for AGIs below $25k, 32.2% for AGIs $25k-50k, 119.2% for AGIs $50k-75k, 287.0% for AGIs $75k-100k, 591.0% for AGIs $100k-200k, 1725.6% for AGIs over 200k)
Earned income credit: $2,123 (reported on 11.4% of returns)
Here:
$2,123
State:
$2,074
(% of AGI for various income ranges: 88.7% for AGIs below $25k, 62.1% for AGIs $25k-50k)
Percentage of individuals using paid preparers for their 2020 taxes: 93.7%
Here:
94%
State:
92%
(% for various income ranges: 92.9% for AGIs below $25k, 93.2% for AGIs $25k-50k, 94.8% for AGIs $50k-75k, 92.6% for AGIs $75k-100k, 95.2% for AGIs $100k-200k, 93.9% for AGIs over 200k)
Averages for the 2012 tax year for zip code 95694, filed in 2013:
Average Adjusted Gross Income (AGI) in 2012: $60,592 (Individual Income Tax Returns)
Here:
$60,592
State:
$72,726
Salary/wage: $49,571 (reported on 86.3% of returns)
Here:
$49,571
State:
$59,079
(% of AGI for various income ranges: 80.0% for AGIs below $25k, 81.4% for AGIs $25k-50k, 75.2% for AGIs $50k-75k, 79.3% for AGIs $75k-100k, 75.6% for AGIs $100k-200k, 47.5% for AGIs over 200k)
Taxable interest for individuals: $1,712 (reported on 35.6% of returns)
This zip code:
$1,712
California:
$2,146
(% of AGI for various income ranges: 0.8% for AGIs below $25k, 0.3% for AGIs $25k-50k, 0.6% for AGIs $50k-75k, 0.6% for AGIs $75k-100k, 0.5% for AGIs $100k-200k, 2.5% for AGIs over 200k)
Ordinary dividends: $3,893 (reported on 16.5% of returns)
Here:
$3,893
State:
$9,308
(% of AGI for various income ranges: 1.2% for AGIs below $25k, 0.8% for AGIs $25k-50k, 0.9% for AGIs $50k-75k, 0.6% for AGIs $75k-100k, 0.8% for AGIs $100k-200k, 1.9% for AGIs over 200k)
Net capital gain/loss in AGI: +$13,618 (reported on 12.8% of returns)
Here:
+$13,618
State:
+$30,460
(% of AGI for various income ranges: 0.4% for AGIs $25k-50k, 0.2% for AGIs $75k-100k, 0.5% for AGIs $100k-200k, 11.3% for AGIs over 200k)
Profit/loss from business: +$15,360 (reported on 13.3% of returns)
Here:
+$15,360
State:
+$17,064
(% of AGI for various income ranges: 5.1% for AGIs below $25k, 3.8% for AGIs $25k-50k, 4.0% for AGIs $50k-75k, 2.3% for AGIs $75k-100k, 3.7% for AGIs $100k-200k, 2.3% for AGIs over 200k)
Taxable individual retirement arrangement distribution: $14,610 (reported on 7.0% of returns)
95694:
$14,610
California:
$19,557
(% of AGI for various income ranges: 1.9% for AGIs below $25k, 0.8% for AGIs $25k-50k, 2.0% for AGIs $50k-75k, 1.7% for AGIs $75k-100k, 3.5% for AGIs $100k-200k)
Self-employment retirement plans: $22,933 (reported on 0.7% of returns)
95694:
$22,933
California:
$24,530
Total itemized deductions: $26,569 (23% of AGI, reported on 33.3% of returns)
Here:
$26,569
State:
$34,004
Here:
22.7% of AGI
State:
22.7% of AGI
(% of AGI for various income ranges: 8.5% for AGIs below $25k, 10.6% for AGIs $25k-50k, 14.0% for AGIs $50k-75k, 16.2% for AGIs $75k-100k, 18.2% for AGIs $100k-200k, 14.5% for AGIs over 200k)
Charity contributions: $2,809 (reported on 27.7% of returns)
Here:
$2,809
State:
$4,659
(% of AGI for various income ranges: 0.4% for AGIs below $25k, 0.7% for AGIs $25k-50k, 1.2% for AGIs $50k-75k, 1.6% for AGIs $75k-100k, 1.5% for AGIs $100k-200k, 1.6% for AGIs over 200k)
Taxes paid: $9,862 (reported on 33.3% of returns)
95694:
$9,862
State:
$14,448
(% of AGI for various income ranges: 1.8% for AGIs below $25k, 2.3% for AGIs $25k-50k, 3.5% for AGIs $50k-75k, 4.6% for AGIs $75k-100k, 7.1% for AGIs $100k-200k, 8.2% for AGIs over 200k)
Earned income credit: $2,115 (reported on 15.8% of returns)
Here:
$2,115
State:
$2,286
(% of AGI for various income ranges: 4.9% for AGIs below $25k, 1.2% for AGIs $25k-50k)
Percentage of individuals using paid preparers for their 2012 taxes: 59.3%
Here:
59%
State:
64%
(% for various income ranges: 51.6% for AGIs below $25k, 60.0% for AGIs $25k-50k, 67.8% for AGIs $50k-75k, 59.0% for AGIs $75k-100k, 65.4% for AGIs $100k-200k, 80.0% for AGIs over 200k)
Averages for the 2004 tax year for zip code 95694, filed in 2005:
Average Adjusted Gross Income (AGI) in 2004: $48,955 (Individual Income Tax Returns)
Here:
$48,955
State:
$58,600
Salary/wage: $43,064 (reported on 87.2% of returns)
Here:
$43,064
State:
$49,455
(% of AGI for various income ranges: 229.2% for AGIs below $10k, 83.7% for AGIs $10k-25k, 81.3% for AGIs $25k-50k, 83.3% for AGIs $50k-75k, 83.3% for AGIs $75k-100k, 64.1% for AGIs over 100k)
Taxable interest for individuals: $1,384 (reported on 45.8% of returns)
This zip code:
$1,384
California:
$2,365
(% of AGI for various income ranges: 8.6% for AGIs below $10k, 1.6% for AGIs $10k-25k, 1.1% for AGIs $25k-50k, 0.6% for AGIs $50k-75k, 1.1% for AGIs $75k-100k, 1.7% for AGIs over 100k)
Taxable dividends: $3,298 (reported on 19.1% of returns)
Here:
$3,298
State:
$4,746
(% of AGI for various income ranges: 9.8% for AGIs below $10k, 0.7% for AGIs $10k-25k, 0.8% for AGIs $25k-50k, 0.6% for AGIs $50k-75k, 0.3% for AGIs $75k-100k, 2.3% for AGIs over 100k)
Net capital gain/loss: +$12,501 (reported on 15.6% of returns)
Here:
+$12,501
State:
+$23,418
(% of AGI for various income ranges: -5.7% for AGIs below $10k, -0.1% for AGIs $10k-25k, 0.6% for AGIs $25k-50k, 0.7% for AGIs $50k-75k, 1.5% for AGIs $75k-100k, 9.5% for AGIs over 100k)
Profit/loss from business: +$17,727 (reported on 13.3% of returns)
Here:
+$17,727
State:
+$16,826
(% of AGI for various income ranges: -0.7% for AGIs below $10k, 3.5% for AGIs $10k-25k, 3.5% for AGIs $25k-50k, 4.0% for AGIs $50k-75k, 3.8% for AGIs $75k-100k, 6.8% for AGIs over 100k)
IRA payment deduction: $3,163 (reported on 2.3% of returns)
95694:
$3,163
California:
$3,192
(% of AGI for various income ranges: 0.2% for AGIs $10k-25k, 0.2% for AGIs $25k-50k, 0.2% for AGIs $50k-75k, 0.2% for AGIs $75k-100k, 0.1% for AGIs over 100k)
Self-employed pension: $10,467 (reported on 1.1% of returns)
Here:
$10,467
California:
$17,688
Total itemized deductions: $22,617 (25% of AGI, reported on 37.6% of returns)
Here:
$22,617
State:
$28,113
Here:
25.4% of AGI
State:
25.3% of AGI
(% of AGI for various income ranges: 35.0% for AGIs below $10k, 7.3% for AGIs $10k-25k, 14.6% for AGIs $25k-50k, 20.0% for AGIs $50k-75k, 22.6% for AGIs $75k-100k, 17.1% for AGIs over 100k)
Charity contributions deductions: $2,424 (3% of AGI, reported on 32.6% of returns)
Here:
$2,424
State:
$3,923
Here:
2.6% of AGI
State:
3.3% of AGI
(% of AGI for various income ranges: 1.0% for AGIs below $10k, 0.5% for AGIs $10k-25k, 1.4% for AGIs $25k-50k, 1.6% for AGIs $50k-75k, 2.2% for AGIs $75k-100k, 1.7% for AGIs over 100k)
Total tax: $7,344 (reported on 72.5% of returns)
95694:
$7,344
State:
$10,761
(% of AGI for various income ranges: 5.4% for AGIs below $10k, 3.8% for AGIs $10k-25k, 5.8% for AGIs $25k-50k, 7.7% for AGIs $50k-75k, 9.6% for AGIs $75k-100k, 17.3% for AGIs over 100k)
Earned income credit: $1,633 (reported on 13.2% of returns)
Here:
$1,633
State:
$1,763
Percentage of individuals using paid preparers for their 2004 taxes: 64.9%
Here:
65%
State:
66%
(% for various income ranges: 56.8% for AGIs below $10k, 60.2% for AGIs $10k-25k, 67.2% for AGIs $25k-50k, 67.7% for AGIs $50k-75k, 66.7% for AGIs $75k-100k, 77.5% for AGIs over 100k)
Household received Food Stamps/SNAP in the past 12 months: 215 Household did not receive Food Stamps/SNAP in the past 12 months: 3,067
Women who had a birth in the past 12 months: 88 (88 now married, 0 unmarried) Women who did not have a birth in the past 12 months: 2,254 (1,084 now married, 1,161 unmarried)
Housing units in zip code 95694 with a mortgage: 1,507 (208 second mortgage, 16 home equity loan, 124 both second mortgage and home equity loan) Houses without a mortgage: 21
Median monthly owner costs for units with a mortgage: $2,523 Median monthly owner costs for units without a mortgage: $762
Residents with income below the poverty level in 2022:
This zip code:
10.2%
Whole state:
12.2%
Residents with income below 50% of the poverty level in 2022:
This zip code:
4.9%
Whole state:
6.2%
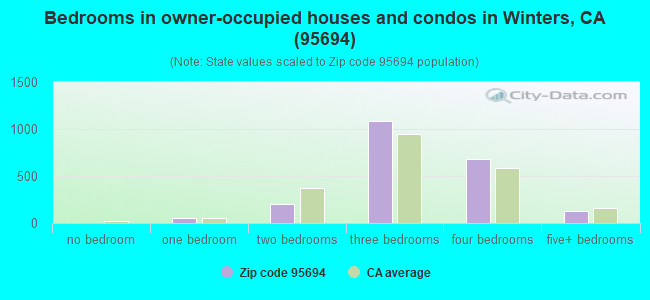
Median number of rooms in houses and condos:
Here:
6.4
State:
6.0
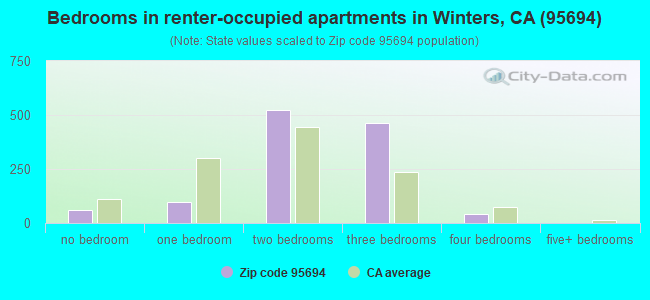
Median number of rooms in apartments:
Here:
4.8
State:
3.9
Notable locations in this zip code not listed on our city pages
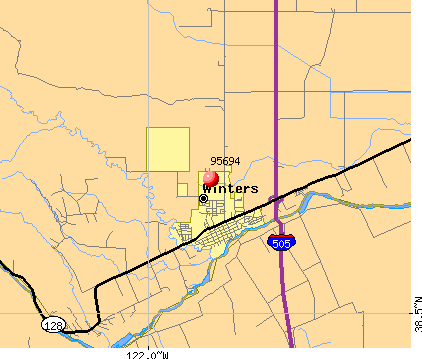
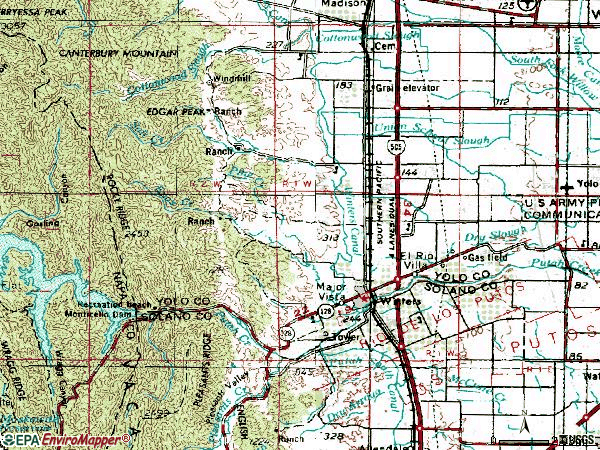
Notable locations in zip code 95694: Chapmans Upper Ranch (A), Corbin Ranch (B), Cowell Ranch (C), Scott Ranch (D), Eatwell Farm (E), Dixon Ridge Farms (F), Eldridge Farm (G), Winters City Hall (H), Winters Branch Yolo County Library (I), Scott Cabin (J), Vacaville Fire Protection District Station 68 (K), Winters Fire Department (L). Display/hide their locations on the map
Streams, rivers, and creeks: Dry Arroyo (A), Dry Creek (B), Enos Creek (C), McCune Creek (D), Pleasants Creek (E), Salt Creek (F), Pleasant Creek (G), Pine Creek (H). Display/hide their locations on the map
In group quarters: 24 (-1 institutionalized population)
Size of family households: 954 2-persons, 550 3-persons, 535 4-persons, 415 5-persons, 40 6-persons, 33 7-or-more-persons
Size of nonfamily households: 527 1-person, 260 2-persons
1,373 married couples with children.
573 single-parent households (260 men, 313 women).
62.2% of residents of 95694 zip code speak English at home.
35.3% of residents speak Spanish at home (64% very well, 8% well, 22% not well, 6% not at all).
0.8% of residents speak other Indo-European language at home (100% very well).
1.0% of residents speak Asian or Pacific Island language at home (22% very well, 24% well, 28% not well, 26% not at all).
0.1% of residents speak other language at home (100% very well).
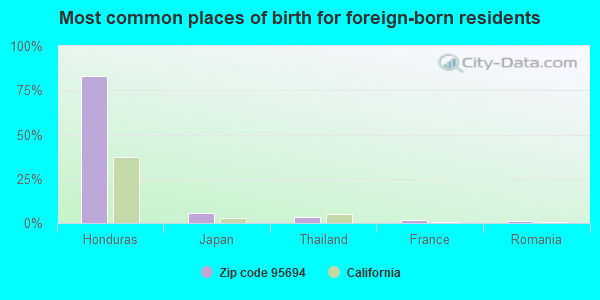
Foreign born population: 1,837 (19.3%) (50.6% of them are naturalized citizens)
This zip code:
19.3%
Whole state:
26.7%
83%Honduras
6%Japan
3%Thailand
2%France
1%Romania
1%Singapore
0%Azores Islands
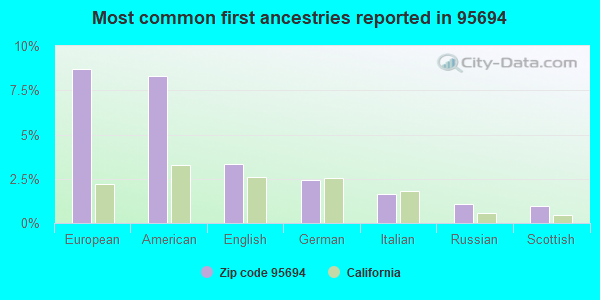
9%European
8%American
3%English
2%German
2%Italian
1%Russian
1%Scottish
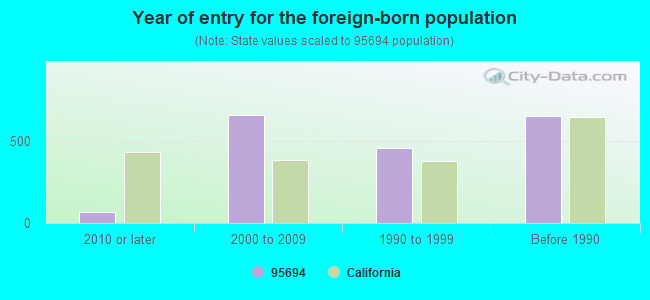
Year of entry for the foreign-born population
702010 or later
6582000 to 2009
4571990 to 1999
653Before 1990
Facilities with environmental interests located in this zip code:
HOLMES CARL WAREHOUSE (E. ABBEY STREET in WINTERS, CA)
(Resource Conservation and Recovery Act (tracking hazardous waste)) Organizations: CARL HOLMES WAREHOUSE (CONTACT/OWNER)
CHEVRON USA INC WINTERS CA BULK PLT (VALLEY RD in WINTERS, CA)
(Resource Conservation and Recovery Act (tracking hazardous waste))
FREMOUW ENVIRONMENTAL SERVICES INC (9110 WINTERS RD in WINTERS, CA)
TRANSPORTER (Resource Conservation and Recovery Act (tracking hazardous waste)) USED OIL PROGRAM (Resource Conservation and Recovery Act (tracking hazardous waste)) Organizations: PIERSON PROPERTIES LLC (CONTACT/OWNER)
ACCESS MANUFACTURING, INC. (1805 RAILROAD AVENUE in WINTERS, CA)
CRITERIA AND HAZARDOUS AIR POLLUTANT INVENTORY (Inventory of air pollution sources) Business SIC classification: TOP, BODY, AND UPHOLSTERY REPAIR SHOPS AND PAINT SHOPS Alternative names: SIX-PAC INDUSTRIES
FAST & EASY #54 (999 E. GRANT AVE. in WINTERS, CA)
CRITERIA AND HAZARDOUS AIR POLLUTANT INVENTORY (Inventory of air pollution sources) Business SIC classification: GASOLINE SERVICE STATIONS
MARIANI NUT (28306 ROAD 90A in WINTERS, CA)
CRITERIA AND HAZARDOUS AIR POLLUTANT INVENTORY (Inventory of air pollution sources)
MARIANI NUT CO (709 DUTTON ST. in WINTERS, CA)
CRITERIA AND HAZARDOUS AIR POLLUTANT INVENTORY (Inventory of air pollution sources)
MARIANI NUT COMPANY (8 EAST EDWARDS ST in WINTERS, CA)
CRITERIA AND HAZARDOUS AIR POLLUTANT INVENTORY (Inventory of air pollution sources)
Housing units lacking complete plumbing facilities: 2.1% Housing units lacking complete kitchen facilities: 1.5%
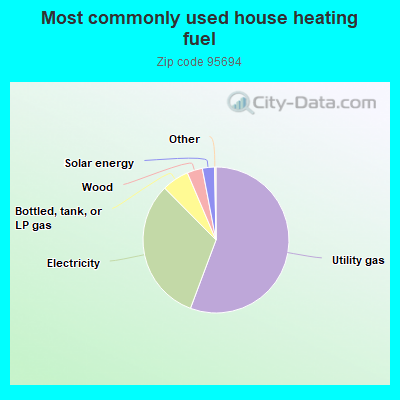
55.7%Utility gas
31.9%Electricity
6.0%Bottled, tank, or LP gas
3.4%Wood
2.7%Solar energy
Population in 1990: 6,253. Population change in the 1990s: +2,144 (+34.3%).
Place of birth for U.S.-born residents:
This state: 6,346
Northeast: 183
Midwest: 462
South: 333
West: 290
68% of the 95694 zip code residents lived in the same house 5 years ago. Out of people who lived in different houses, 59% lived in this county. Out of people who lived in different counties, 50% lived in California.
92% of the 95694 zip code residents lived in the same house 1 year ago. Out of people who lived in different houses, 32% moved from this county. Out of people who lived in different houses, 63% moved from different county within same state. Out of people who lived in different houses, 2% moved from different state. Out of people who lived in different houses, 6% moved from abroad.
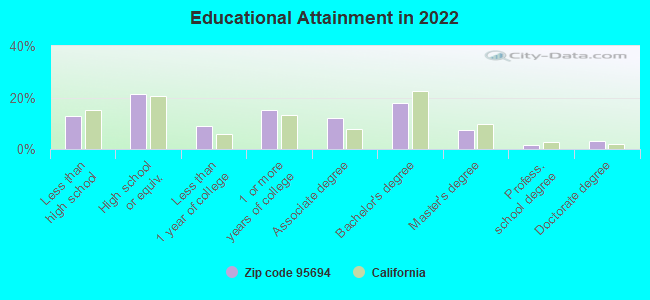
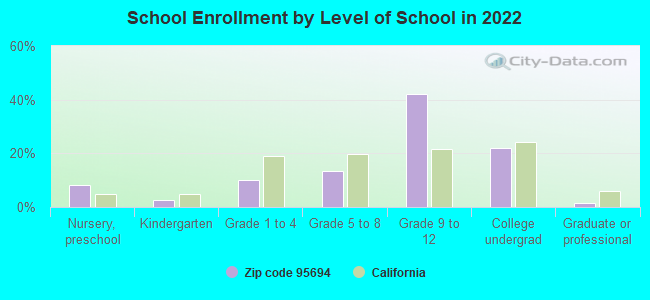
Private vs. public school enrollment:
Students in private schools in grades 1 to 8 (elementary and middle school): 120
Here:
21.2%
California:
10.5%
Students in private schools in grades 9 to 12 (high school): 38
Here:
3.9%
California:
8.5%
Students in private undergraduate colleges: 16
Here:
3.2%
California:
15.9%
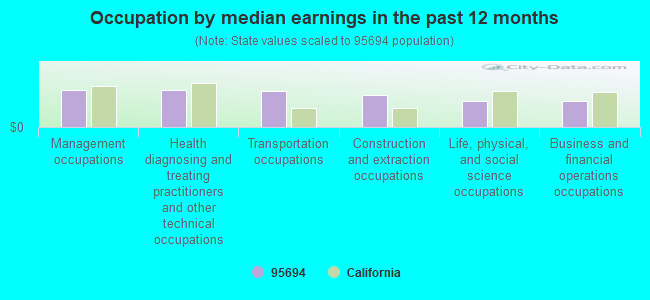
Occupation by median earnings in the past 12 months ($)
102,882Management occupations
102,187Health diagnosing and treating practitioners and other technical occupations
98,152Transportation occupations
86,936Construction and extraction occupations
71,636Life, physical, and social science occupations
71,186Business and financial operations occupations
Companies with federal contracts located in this zip code:
JFD ENTERPRISES (909 MERMOD PLACE in WINTERS, CA; small business) : $179,142 in 25 contractsfrom 2002 to 2005
Contracts for Construction -- Basic Research (R&D), Landscaping/Groundskeeping Services, Other Housekeeping Services by Department of Veterans Affairs, Army, U.S. Army Corps of Engineers - civil program financing only Signed by year:2000: $0; 2001: $0; 2002: $4,600; 2003: $132,500; 2004: $39,864; 2005: $2,178; 2006: $0.
Biggest contracts:
$34,800 with Department of Veterans Affairs for Construction -- Basic Research (R&D). Signed on 2003-10-01. Completion date: 2004-09-30.
$34,800, same as above.Signed on 2003-10-01. Completion date: 2004-09-30.
$28,800 with Department of Veterans Affairs for Landscaping/Groundskeeping Services. Signed on 2003-04-15. Completion date: 2003-09-15.
$13,950 with Army for Landscaping/Groundskeeping Services. Signed on 2004-01-20. Completion date: 2004-07-30.
Top industries in this zip code by the number of employees in 2005:
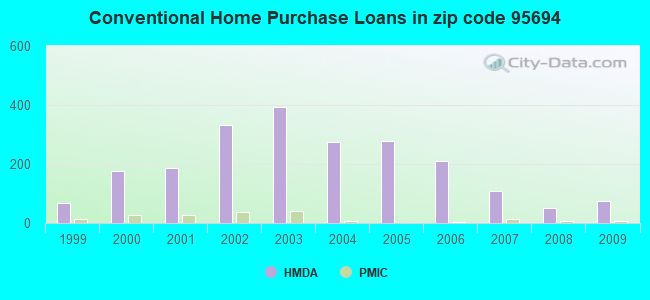
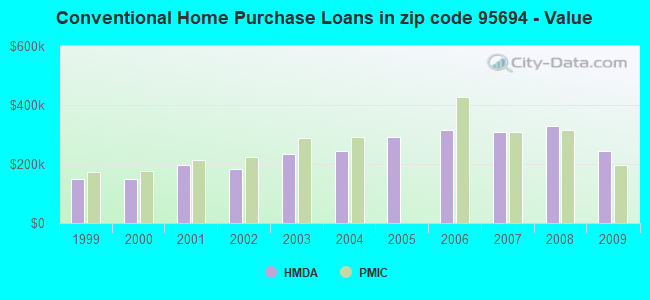
Detailed PMIC statistics for the following Tracts:0113.00
, 2529.03
2005 - 2018 National Fire Incident Reporting System (NFIRS) incidents
Based on the data from the years 2005 - 2018 the average number of fire incidents per year is 34. The highest number of fires - 106 took place in 2005, and the least - 5 in 2010. The data has a dropping trend.
When looking into fire subcategories, the most reports belonged to: Outside Fires (70.6%), and Structure Fires (17.9%).
Fire incident types reported to NFIRS in Zip Code 95694
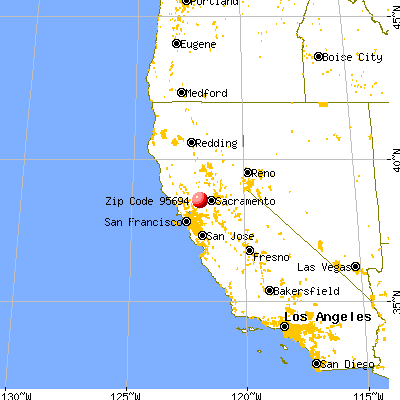


 Nearest zip codes: 95653, 95688, 95627, 94558, 95606, 95695.
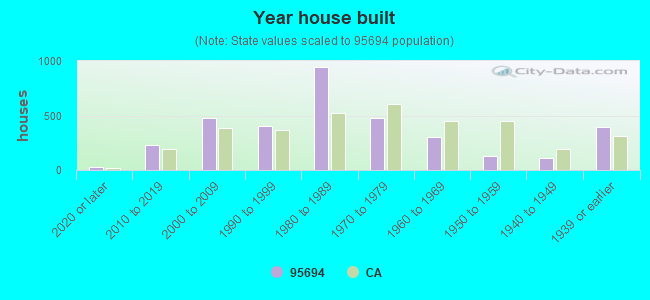


 Based on the data from the years 2005 - 2018 the average number of fire incidents per year is 34. The highest number of fires - 106 took place in 2005, and the least - 5 in 2010. The data has a dropping trend.
 When looking into fire subcategories, the most reports belonged to: Outside Fires (70.6%), and Structure Fires (17.9%).