Estimated zip code population in 2022: 956 Zip code population in 2010: 1,441 Zip code population in 2000: 1,276
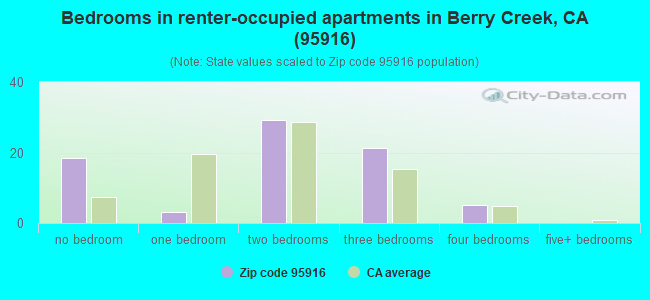
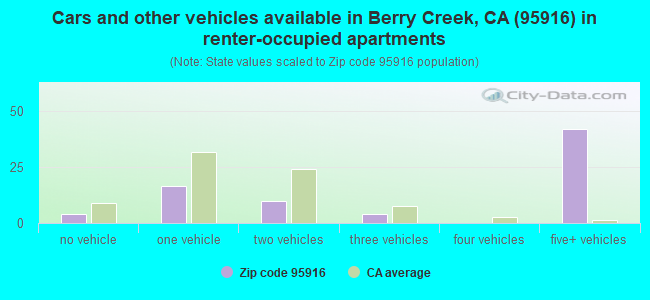
Houses and condos: 624 Renter-occupied apartments: 75
% of renters here:
19%
State:
44%
March 2022 cost of living index in zip code 95916: 95.7 (near average, U.S. average is 100)
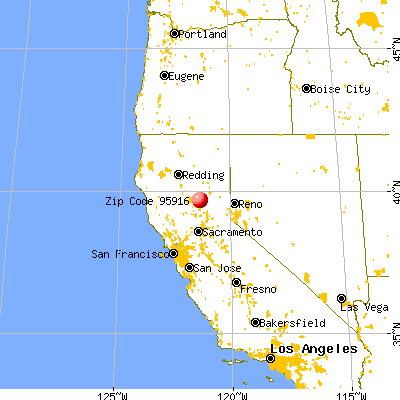
Land area: 96.8 sq. mi. Water area: 7.7 sq. mi.
Population density: 10 people per square mile
(very low).
OSM Map
General Map
Google Map
MSN Map
OSM Map
General Map
Google Map
MSN Map
OSM Map
General Map
Google Map
MSN Map
OSM Map
General Map
Google Map
MSN Map
Please wait while loading the map...
Real estate property taxes paid for housing units in 2022:
This zip code:
0.6% ($1,480)
California:
0.7% ($4,831)
Median real estate property taxes paid for housing units with mortgages in 2022: $1,822 (0.6%) Median real estate property taxes paid for housing units with no mortgage in 2022: $1,283 (0.6%)
Business Search- 14 Million verified businesses
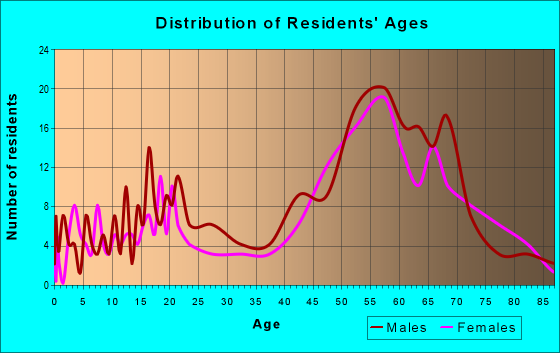
Males: 516
(54.0%)
Females: 440
(46.0%)
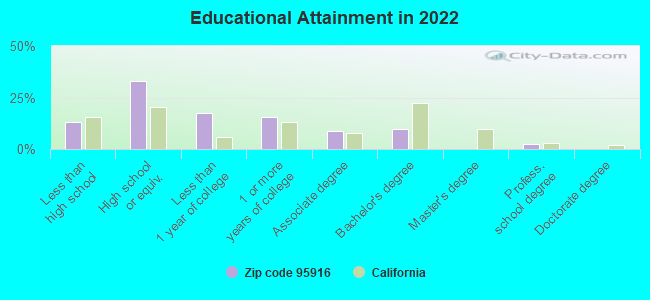
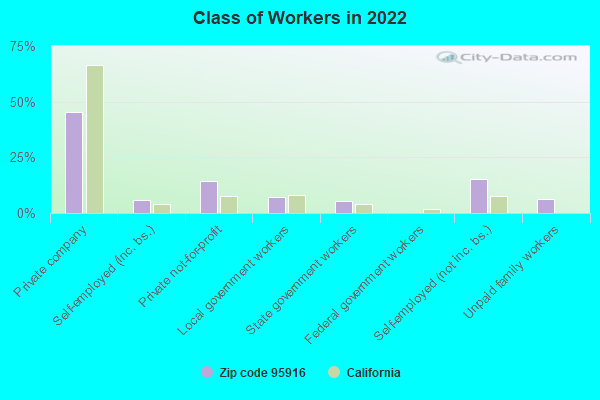
For population 25 years and over in 95916:
High school or higher: 85.7%
Bachelor's degree or higher: 12.4%
Graduate or professional degree: 2.7%
Unemployed: 18.0%
Mean travel time to work (commute): 49.3 minutes
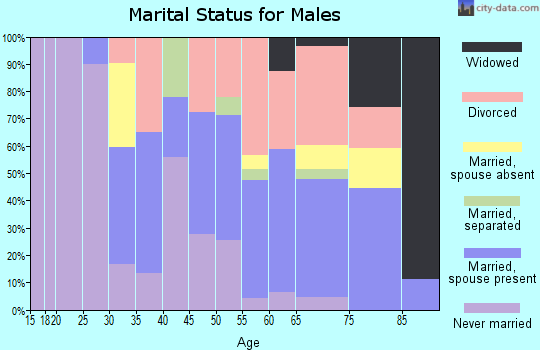
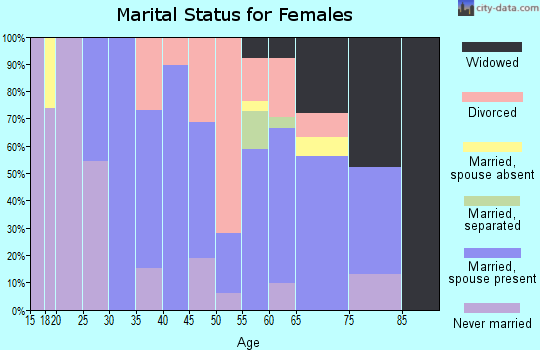
For population 15 years and over in 95916:
Never married: 20.8%
Now married: 51.2%
Separated: 1.3%
Widowed: 6.6%
Divorced: 20.1%
Zip code 95916 compared to state average:
Median household income below state average.
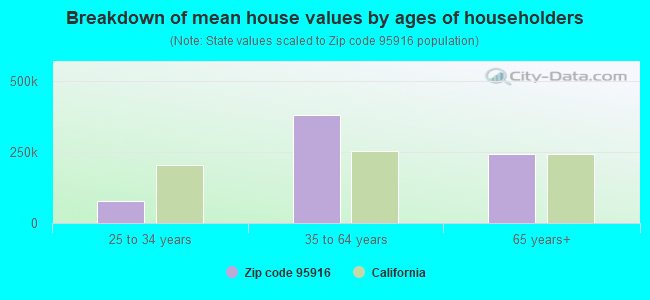
Median house value significantly below state average.
Unemployed percentage significantly above state average.
Black race population percentage significantly below state average.
Hispanic race population percentage significantly below state average.
Median age significantly above state average.
Foreign-born population percentage significantly below state average.
Renting percentage significantly below state average.
Length of stay since moving in significantly above state average.
Number of college students significantly below state average.
Percentage of population with a bachelor's degree or higher significantly below state average.
Averages for the 2020 tax year for zip code 95916, filed in 2021:
Average Adjusted Gross Income (AGI) in 2020: $38,527 (Individual Income Tax Returns)
Here:
$38,527
State:
$95,910
Salary/wage: $34,643 (reported on 53.8% of returns)
Here:
$34,643
State:
$77,331
(% of AGI for various income ranges: 828.8% for AGIs below $25k, 2992.5% for AGIs $25k-50k, 9966.7% for AGIs $50k-75k)
Taxable interest for individuals: $557 (reported on 26.9% of returns)
This zip code:
$557
California:
$2,294
(% of AGI for various income ranges: 22.5% for AGIs below $25k, 70.0% for AGIs $50k-75k)
Ordinary dividends: $1,233 (reported on 11.5% of returns)
Here:
$1,233
State:
$10,949
(% of AGI for various income ranges: 46.2% for AGIs below $25k)
Net capital gain/loss in AGI: +$14,333 (reported on 11.5% of returns)
Here:
+$14,333
State:
+$49,306
(% of AGI for various income ranges: 537.5% for AGIs below $25k)
Profit/loss from business: +$9,375 (reported on 15.4% of returns)
Here:
+$9,375
State:
+$15,671
(% of AGI for various income ranges: 468.8% for AGIs below $25k)
Total itemized deductions: $48,450 (reported on 15.4% of returns)
Here:
$48,450
State:
$39,517
(% of AGI for various income ranges: 4845.0% for AGIs $25k-50k)
Earned income credit: $1,983 (reported on 23.1% of returns)
Here:
$1,983
State:
$2,074
(% of AGI for various income ranges: 148.8% for AGIs below $25k)
Percentage of individuals using paid preparers for their 2020 taxes: 96.2%
Here:
96%
State:
92%
(% for various income ranges: 92.9% for AGIs below $25k, 100.0% for AGIs $25k-50k, 150.0% for AGIs $50k-75k, 0.0% for AGIs $100k-200k)
Averages for the 2012 tax year for zip code 95916, filed in 2013:
Average Adjusted Gross Income (AGI) in 2012: $37,957 (Individual Income Tax Returns)
Here:
$37,957
State:
$72,726
Salary/wage: $30,400 (reported on 63.3% of returns)
Here:
$30,400
State:
$59,079
(% of AGI for various income ranges: 52.4% for AGIs below $25k, 50.4% for AGIs $25k-50k, 56.3% for AGIs $50k-75k, 51.8% for AGIs $75k-100k, 44.7% for AGIs $100k-200k)
Taxable interest for individuals: $1,059 (reported on 34.7% of returns)
This zip code:
$1,059
California:
$2,146
(% of AGI for various income ranges: 2.9% for AGIs below $25k, 1.3% for AGIs $25k-50k, 0.9% for AGIs $50k-75k, 0.1% for AGIs $100k-200k)
Ordinary dividends: $1,614 (reported on 14.3% of returns)
Here:
$1,614
State:
$9,308
(% of AGI for various income ranges: 1.5% for AGIs below $25k, 0.7% for AGIs $25k-50k, 1.0% for AGIs $50k-75k)
Net capital gain/loss in AGI: +$667 (reported on 12.2% of returns)
Here:
+$667
State:
+$30,460
Profit/loss from business: +$5,288 (reported on 16.3% of returns)
Here:
+$5,288
State:
+$17,064
Taxable individual retirement arrangement distribution: $11,340 (reported on 10.2% of returns)
95916:
$11,340
California:
$19,557
Total itemized deductions: $18,808 (27% of AGI, reported on 24.5% of returns)
Here:
$18,808
State:
$34,004
Here:
27.2% of AGI
State:
22.7% of AGI
(% of AGI for various income ranges: 12.4% for AGIs below $25k, 21.4% for AGIs $25k-50k, 13.8% for AGIs $75k-100k, 12.2% for AGIs $100k-200k)
Charity contributions: $2,062 (reported on 16.3% of returns)
Here:
$2,062
State:
$4,659
Taxes paid: $4,931 (reported on 26.5% of returns)
95916:
$4,931
State:
$14,448
(% of AGI for various income ranges: 1.4% for AGIs below $25k, 5.0% for AGIs $25k-50k, 4.4% for AGIs $75k-100k, 5.4% for AGIs $100k-200k)
Earned income credit: $2,250 (reported on 20.4% of returns)
Here:
$2,250
State:
$2,286
(% of AGI for various income ranges: 7.8% for AGIs below $25k)
Percentage of individuals using paid preparers for their 2012 taxes: 63.3%
Here:
63%
State:
64%
(% for various income ranges: 58.3% for AGIs below $25k, 66.7% for AGIs $25k-50k, 66.7% for AGIs $50k-75k, 66.7% for AGIs $75k-100k, 75.0% for AGIs $100k-200k)
Averages for the 2004 tax year for zip code 95916, filed in 2005:
Average Adjusted Gross Income (AGI) in 2004: $34,687 (Individual Income Tax Returns)
Here:
$34,687
State:
$58,600
Salary/wage: $26,938 (reported on 72.0% of returns)
Here:
$26,938
State:
$49,455
(% of AGI for various income ranges: 105.1% for AGIs below $10k, 61.6% for AGIs $10k-25k, 60.1% for AGIs $25k-50k, 59.2% for AGIs $50k-75k, 55.4% for AGIs $75k-100k, 35.2% for AGIs over 100k)
Taxable interest for individuals: $1,472 (reported on 44.7% of returns)
This zip code:
$1,472
California:
$2,365
(% of AGI for various income ranges: 5.9% for AGIs below $10k, 2.8% for AGIs $10k-25k, 0.8% for AGIs $25k-50k, 1.4% for AGIs $50k-75k, 1.3% for AGIs $75k-100k, 3.6% for AGIs over 100k)
Taxable dividends: $2,558 (reported on 16.6% of returns)
Here:
$2,558
State:
$4,746
(% of AGI for various income ranges: 2.6% for AGIs $10k-25k, 0.5% for AGIs $25k-50k, 0.3% for AGIs $50k-75k, 4.1% for AGIs $75k-100k)
Net capital gain/loss: +$6,990 (reported on 18.6% of returns)
Here:
+$6,990
State:
+$23,418
(% of AGI for various income ranges: 0.4% for AGIs $10k-25k, 0.8% for AGIs $25k-50k, 4.4% for AGIs $50k-75k, 10.6% for AGIs $75k-100k, 4.3% for AGIs over 100k)
Profit/loss from business: +$3,885 (reported on 16.8% of returns)
Here:
+$3,885
State:
+$16,826
(% of AGI for various income ranges: -4.0% for AGIs below $10k, 8.6% for AGIs $10k-25k, 2.5% for AGIs $25k-50k, 0.3% for AGIs $50k-75k)
Total itemized deductions: $15,812 (25% of AGI, reported on 28.8% of returns)
Here:
$15,812
State:
$28,113
Here:
24.6% of AGI
State:
25.3% of AGI
(% of AGI for various income ranges: 12.9% for AGIs $10k-25k, 14.2% for AGIs $25k-50k, 11.6% for AGIs $50k-75k, 15.7% for AGIs $75k-100k, 12.9% for AGIs over 100k)
Charity contributions deductions: $1,823 (3% of AGI, reported on 24.0% of returns)
Here:
$1,823
State:
$3,923
Here:
2.8% of AGI
State:
3.3% of AGI
(% of AGI for various income ranges: 0.5% for AGIs $10k-25k, 1.9% for AGIs $25k-50k, 1.3% for AGIs $50k-75k, 0.9% for AGIs $75k-100k, 1.3% for AGIs over 100k)
Total tax: $4,459 (reported on 71.6% of returns)
95916:
$4,459
State:
$10,761
(% of AGI for various income ranges: 3.1% for AGIs below $10k, 3.9% for AGIs $10k-25k, 6.5% for AGIs $25k-50k, 9.8% for AGIs $50k-75k, 11.2% for AGIs $75k-100k, 15.8% for AGIs over 100k)
Earned income credit: $1,513 (reported on 21.9% of returns)
Here:
$1,513
State:
$1,763
Percentage of individuals using paid preparers for their 2004 taxes: 63.2%
Here:
63%
State:
66%
(% for various income ranges: 49.6% for AGIs below $10k, 66.2% for AGIs $10k-25k, 67.4% for AGIs $25k-50k, 62.3% for AGIs $50k-75k, 81.8% for AGIs $75k-100k, 64.7% for AGIs over 100k)
Likely homosexual households (counted as self-reported same-sex unmarried-partner households)
Lesbian couples: 0.0% of all households
Gay men: 1.0% of all households
Household received Food Stamps/SNAP in the past 12 months: 62 Household did not receive Food Stamps/SNAP in the past 12 months: 343
Women who had a birth in the past 12 months: 2 (0 now married, 3 unmarried) Women who did not have a birth in the past 12 months: 103 (34 now married, 69 unmarried)
Housing units in zip code 95916 with a mortgage: 77 Median monthly owner costs for units with a mortgage: $1,399 Median monthly owner costs for units without a mortgage: $466
Residents with income below the poverty level in 2022:
This zip code:
36.0%
Whole state:
12.2%
Residents with income below 50% of the poverty level in 2022:
This zip code:
23.6%
Whole state:
6.2%
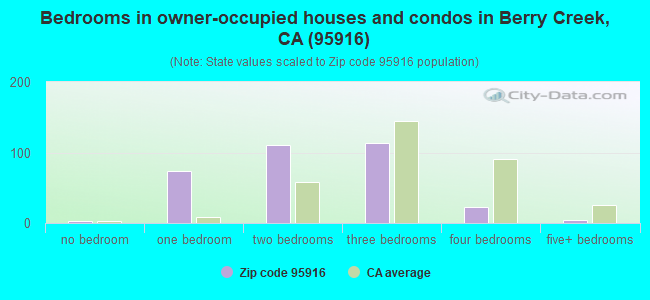
Median number of rooms in houses and condos:
Here:
4.8
State:
6.0
Median number of rooms in apartments:
Here:
5.0
State:
3.9
Notable locations in this zip code not listed on our city pages
Notable locations in zip code 95916: Hinton Ranch (A), Schaefer Ranch (B), Rogers Cow Camp (C), Elks Retreat (D), Mountain House (E), Mishop Bar Campground (F), Brush Creek Administrative Site (G), Seater Ranch (H), Zink Ranch (I), Big Bald Rock Trailhead (J), Dome Trailhead (K), Johnson Ranch (L), California Department of Forestry and Fire Protection Station 62 Harts Mill (M), Butte County Fire Department Station 61 (N), Butte County Fire Department Station 60 (O). Display/hide their locations on the map
Rivers and creeks: Foreman Creek (A), Jordan Creek (B), Minnie Creek (C), South Branch Middle Fork Feather River (D), Tigus Creek (E), Little North Fork of Middle Fork Feather River (F), Pompys Creek (G), Union Creek (H), Sycamore Creek (I). Display/hide their locations on the map
In group quarters: 3 (-1 institutionalized population)
Size of family households: 116 2-persons, 72 3-persons, 24 4-persons, 19 5-persons, 5 7-or-more-persons
Size of nonfamily households: 120 1-person, 48 2-persons
22 married couples with children.
65 single-parent households (65 women).
92.1% of residents of 95916 zip code speak English at home.
1.9% of residents speak Spanish at home (44% very well, 44% well, 11% not well).
1.0% of residents speak other Indo-European language at home (100% very well).
5.2% of residents speak Asian or Pacific Island language at home (82% very well, 18% not well).
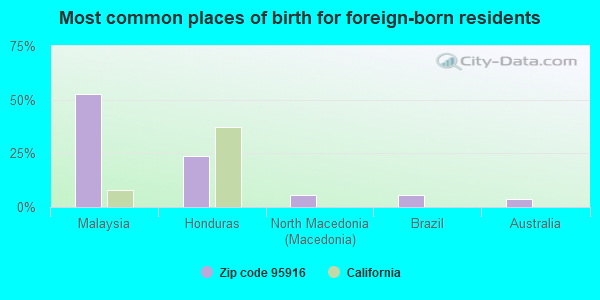
Foreign born population: 55 (5.8%) (28.9% of them are naturalized citizens)
This zip code:
5.8%
Whole state:
26.7%
53%Malaysia
24%Honduras
5%North Macedonia (Macedonia)
5%Brazil
4%Australia
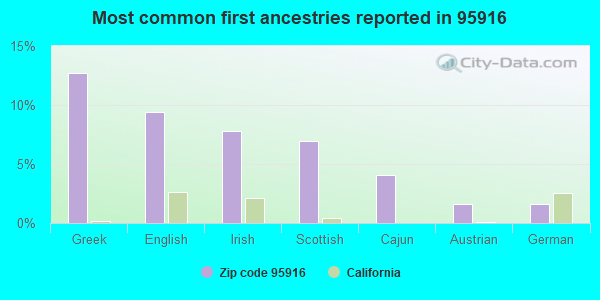
13%Greek
9%English
8%Irish
7%Scottish
4%Cajun
2%Austrian
2%German
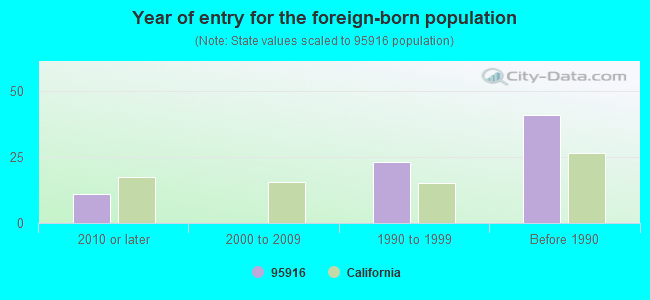
Year of entry for the foreign-born population
112010 or later
02000 to 2009
231990 to 1999
41Before 1990
Facilities with environmental interests located in this zip code:
BALD ROCK COMMUNITY DAY (66 ROCKEFELLER ROAD in BERRY CREEK, CA)
(National Center for Education Statistics) - STATE ID-6115950 Organizations: PIONEER UNION ELEMENTARY (SCHOOL DISTRICT)
374 JATKO ROAD, BERRY CREEK (374 JATKO ROAD in BERRY CREEK, CA)
CRITERIA AND HAZARDOUS AIR POLLUTANT INVENTORY (Inventory of air pollution sources) Business SIC classification: REFUSE SYSTEMS Business NAICS classification: SOLID WASTE LANDFILL.
LAKE MADRONE BURN DUMP (0.5 MI N OF LMADRONE,1000'W OFO in BERRY CREEK, CA)
CRITERIA AND HAZARDOUS AIR POLLUTANT INVENTORY (Inventory of air pollution sources) Business SIC classification: REFUSE SYSTEMS Business NAICS classification: SOLID WASTE LANDFILL.
Housing units lacking complete plumbing facilities: 2.3% Housing units lacking complete kitchen facilities: 2.7%
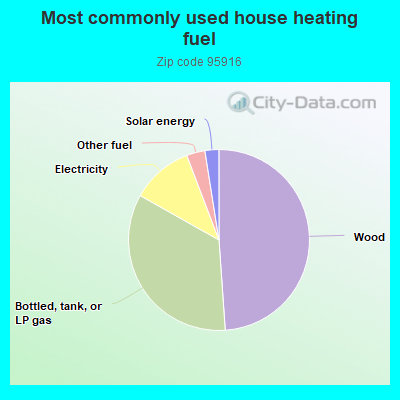
49.1%Wood
34.4%Bottled, tank, or LP gas
11.1%Electricity
3.3%Other fuel
2.5%Solar energy
Population in 1990: 1,285.
Place of birth for U.S.-born residents:
This state: 662
Northeast: 73
Midwest: 22
South: 90
West: 26
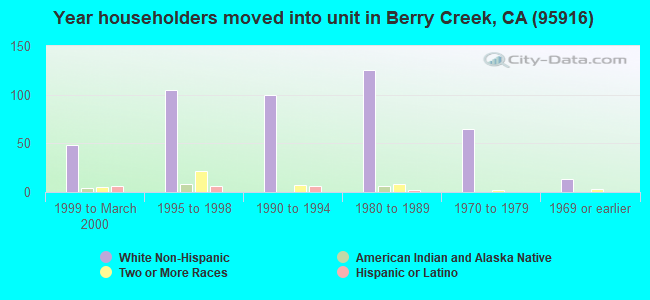
63% of the 95916 zip code residents lived in the same house 5 years ago. Out of people who lived in different houses, 61% lived in this county. Out of people who lived in different counties, 50% lived in California.
86% of the 95916 zip code residents lived in the same house 1 year ago. Out of people who lived in different houses, 5% moved from this county. Out of people who lived in different houses, 84% moved from different county within same state. Out of people who lived in different houses, 12% moved from different state.
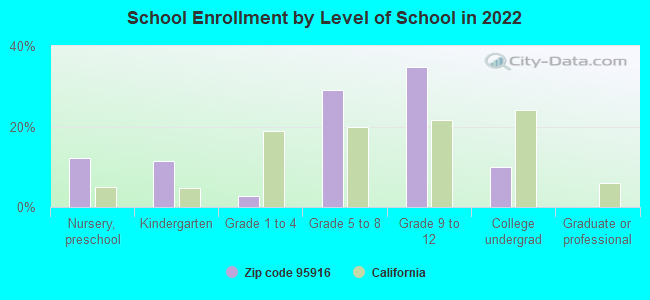
Private vs. public school enrollment:
Students in private schools in grades 1 to 8 (elementary and middle school): 20
Here:
43.3%
California:
10.5%
Students in private schools in grades 9 to 12 (high school): 10
Here:
21.7%
California:
8.5%
Students in private undergraduate colleges:
Here:
0.0%
California:
15.9%
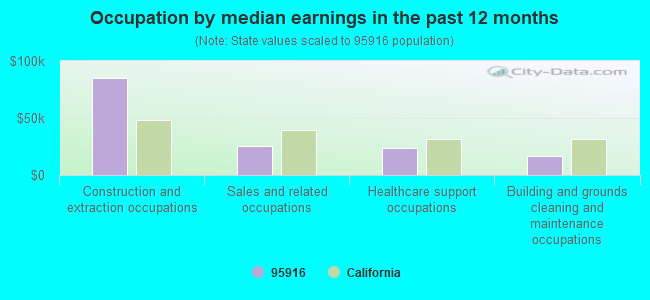
Occupation by median earnings in the past 12 months ($)
85,447Construction and extraction occupations
25,250Sales and related occupations
23,964Healthcare support occupations
16,269Building and grounds cleaning and maintenance occupations
Companies with federal contracts located in this zip code:
RONTIMCO (240 SUNDAY DRIVE in BERRY CREEK, CA; small business)
$54,579 with Air Force for Maintenance, Repair or Alteration of Real Property -- Recreation Facilities (Non-Building). Taking place in FL. Signed on 2001-09-27. Completion date: 2001-11-23.
Top industries in this zip code by the number of employees in 2005:
Accommodation and Food Services: Full-Service Restaurants (5-9 employees: 1 establishment)
Wholesale Trade: Business to Business Electronic Markets (1-4: 1)
Construction: Residential Remodelers (1-4: 1)
Accommodation and Food Services: Drinking Places (Alcoholic Beverages) (1-4: 1)
Accommodation and Food Services: Bed-and-Breakfast Inns (1-4: 1)
Administrative and Support and Waste Management and Remediation Services: Document Preparation Services (1-4: 1)
Home Mortgage Disclosure Act Aggregated Statistics For Year 2009 (Based on 2 partial tracts)
A) FHA, FSA/RHS & VA Home Purchase Loans
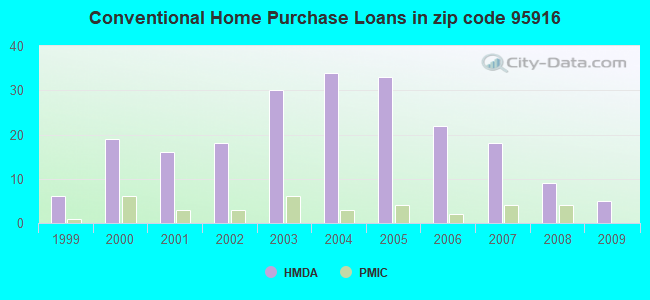
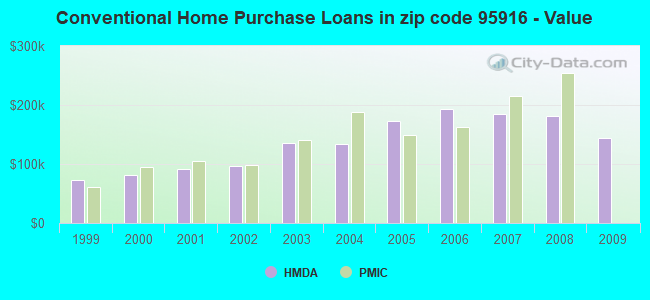
B) Conventional Home Purchase Loans
C) Refinancings
D) Home Improvement Loans
F) Non-occupant Loans on < 5 Family Dwellings (A B C & D)
G) Loans On Manufactured Home Dwelling (A B C & D)
Number
Average Value
Number
Average Value
Number
Average Value
Number
Average Value
Number
Average Value
Number
Average Value
LOANS ORIGINATED
5
$165,742
5
$144,138
22
$163,215
2
$84,665
5
$163,426
9
$135,191
APPLICATIONS APPROVED, NOT ACCEPTED
0
$0
0
$0
3
$252,190
0
$0
1
$157,740
0
$0
APPLICATIONS DENIED
2
$188,955
1
$263,900
19
$166,754
1
$48,220
3
$102,420
4
$156,062
APPLICATIONS WITHDRAWN
1
$74,010
1
$255,310
11
$165,254
0
$0
2
$198,115
3
$167,587
FILES CLOSED FOR INCOMPLETENESS
1
$130,460
0
$0
2
$179,235
0
$0
0
$0
1
$176,430
Aggregated Statistics For Year 2008 (Based on 2 partial tracts)
A) FHA, FSA/RHS & VA Home Purchase Loans
B) Conventional Home Purchase Loans
C) Refinancings
D) Home Improvement Loans
F) Non-occupant Loans on < 5 Family Dwellings (A B C & D)
G) Loans On Manufactured Home Dwelling (A B C & D)
Number
Average Value
Number
Average Value
Number
Average Value
Number
Average Value
Number
Average Value
Number
Average Value
LOANS ORIGINATED
3
$173,193
9
$181,086
23
$161,157
4
$93,825
4
$187,368
11
$142,452
APPLICATIONS APPROVED, NOT ACCEPTED
0
$0
4
$177,742
5
$144,736
3
$50,090
3
$95,693
5
$140,624
APPLICATIONS DENIED
1
$196,990
4
$162,415
32
$175,160
7
$142,417
3
$152,760
9
$102,961
APPLICATIONS WITHDRAWN
0
$0
2
$157,555
13
$194,175
3
$131,703
1
$127,090
5
$146,156
FILES CLOSED FOR INCOMPLETENESS
0
$0
1
$244,840
3
$215,310
1
$61,680
1
$114,380
1
$48,970
Aggregated Statistics For Year 2007 (Based on 2 partial tracts)
A) FHA, FSA/RHS & VA Home Purchase Loans
B) Conventional Home Purchase Loans
C) Refinancings
D) Home Improvement Loans
F) Non-occupant Loans on < 5 Family Dwellings (A B C & D)
G) Loans On Manufactured Home Dwelling (A B C & D)
Number
Average Value
Number
Average Value
Number
Average Value
Number
Average Value
Number
Average Value
Number
Average Value
LOANS ORIGINATED
1
$326,700
18
$184,367
39
$194,108
9
$121,278
8
$182,088
13
$151,130
APPLICATIONS APPROVED, NOT ACCEPTED
0
$0
6
$200,357
11
$229,139
0
$0
3
$134,193
3
$129,957
APPLICATIONS DENIED
1
$134,570
7
$166,769
46
$185,567
14
$109,657
7
$231,543
19
$125,203
APPLICATIONS WITHDRAWN
0
$0
4
$168,490
18
$169,518
3
$119,867
3
$139,553
1
$213,810
FILES CLOSED FOR INCOMPLETENESS
0
$0
1
$221,290
6
$215,745
0
$0
1
$148,400
0
$0
Aggregated Statistics For Year 2006 (Based on 2 partial tracts)
A) FHA, FSA/RHS & VA Home Purchase Loans
B) Conventional Home Purchase Loans
C) Refinancings
D) Home Improvement Loans
F) Non-occupant Loans on < 5 Family Dwellings (A B C & D)
G) Loans On Manufactured Home Dwelling (A B C & D)
Number
Average Value
Number
Average Value
Number
Average Value
Number
Average Value
Number
Average Value
Number
Average Value
LOANS ORIGINATED
3
$158,617
22
$193,544
59
$182,009
13
$101,904
13
$169,590
23
$137,120
APPLICATIONS APPROVED, NOT ACCEPTED
0
$0
5
$187,722
11
$178,405
4
$118,308
3
$175,687
4
$127,745
APPLICATIONS DENIED
0
$0
8
$197,788
51
$165,872
13
$78,355
5
$161,406
19
$136,929
APPLICATIONS WITHDRAWN
0
$0
5
$190,938
31
$166,064
4
$115,410
4
$211,290
5
$108,476
FILES CLOSED FOR INCOMPLETENESS
0
$0
0
$0
5
$157,296
1
$213,070
0
$0
1
$81,490
Aggregated Statistics For Year 2005 (Based on 2 partial tracts)
A) FHA, FSA/RHS & VA Home Purchase Loans
B) Conventional Home Purchase Loans
C) Refinancings
D) Home Improvement Loans
F) Non-occupant Loans on < 5 Family Dwellings (A B C & D)
G) Loans On Manufactured Home Dwelling (A B C & D)
Number
Average Value
Number
Average Value
Number
Average Value
Number
Average Value
Number
Average Value
Number
Average Value
LOANS ORIGINATED
1
$165,220
33
$173,500
53
$148,765
11
$85,056
16
$190,404
21
$127,786
APPLICATIONS APPROVED, NOT ACCEPTED
0
$0
5
$175,462
17
$182,920
1
$22,430
2
$165,035
6
$111,828
APPLICATIONS DENIED
0
$0
16
$156,786
64
$141,857
9
$84,396
3
$178,427
21
$107,067
APPLICATIONS WITHDRAWN
0
$0
12
$149,676
42
$159,444
4
$161,015
3
$183,163
8
$124,009
FILES CLOSED FOR INCOMPLETENESS
0
$0
2
$130,270
12
$143,913
2
$93,450
1
$174,940
4
$117,468
Aggregated Statistics For Year 2004 (Based on 2 partial tracts)
A) FHA, FSA/RHS & VA Home Purchase Loans
B) Conventional Home Purchase Loans
C) Refinancings
D) Home Improvement Loans
F) Non-occupant Loans on < 5 Family Dwellings (A B C & D)
G) Loans On Manufactured Home Dwelling (A B C & D)
Number
Average Value
Number
Average Value
Number
Average Value
Number
Average Value
Number
Average Value
Number
Average Value
LOANS ORIGINATED
2
$152,135
34
$133,820
51
$123,750
10
$68,555
14
$126,745
22
$99,924
APPLICATIONS APPROVED, NOT ACCEPTED
0
$0
12
$93,512
18
$125,098
2
$87,845
1
$111,390
7
$90,780
APPLICATIONS DENIED
1
$113,260
9
$115,588
46
$115,748
9
$71,687
4
$101,488
13
$105,671
APPLICATIONS WITHDRAWN
0
$0
7
$135,796
30
$115,267
1
$50,460
2
$113,820
6
$93,325
FILES CLOSED FOR INCOMPLETENESS
1
$132,700
1
$104,660
7
$121,486
0
$0
0
$0
1
$106,530
Aggregated Statistics For Year 2003 (Based on 2 partial tracts)
A) FHA, FSA/RHS & VA Home Purchase Loans
B) Conventional Home Purchase Loans
C) Refinancings
D) Home Improvement Loans
F) Non-occupant Loans on < 5 Family Dwellings (A B C & D)
Number
Average Value
Number
Average Value
Number
Average Value
Number
Average Value
Number
Average Value
LOANS ORIGINATED
2
$115,315
30
$135,365
89
$114,059
4
$38,688
12
$107,966
APPLICATIONS APPROVED, NOT ACCEPTED
0
$0
2
$161,110
15
$121,485
1
$44,110
2
$116,815
APPLICATIONS DENIED
0
$0
9
$98,932
49
$111,804
5
$40,072
6
$104,353
APPLICATIONS WITHDRAWN
1
$137,930
3
$165,593
36
$115,245
1
$95,320
1
$73,260
FILES CLOSED FOR INCOMPLETENESS
0
$0
0
$0
6
$92,142
0
$0
1
$50,460
Aggregated Statistics For Year 2002 (Based on 2 partial tracts)
A) FHA, FSA/RHS & VA Home Purchase Loans
B) Conventional Home Purchase Loans
C) Refinancings
D) Home Improvement Loans
F) Non-occupant Loans on < 5 Family Dwellings (A B C & D)
Number
Average Value
Number
Average Value
Number
Average Value
Number
Average Value
Number
Average Value
LOANS ORIGINATED
1
$155,130
18
$95,921
49
$106,289
4
$30,558
7
$90,246
APPLICATIONS APPROVED, NOT ACCEPTED
0
$0
3
$102,420
8
$94,899
0
$0
0
$0
APPLICATIONS DENIED
0
$0
3
$188,270
25
$188,560
2
$25,980
1
$65,040
APPLICATIONS WITHDRAWN
0
$0
6
$122,482
17
$100,508
1
$6,730
1
$117,000
FILES CLOSED FOR INCOMPLETENESS
0
$0
1
$131,200
3
$127,717
0
$0
0
$0
Aggregated Statistics For Year 2001 (Based on 2 partial tracts)
A) FHA, FSA/RHS & VA Home Purchase Loans
B) Conventional Home Purchase Loans
C) Refinancings
D) Home Improvement Loans
F) Non-occupant Loans on < 5 Family Dwellings (A B C & D)
Number
Average Value
Number
Average Value
Number
Average Value
Number
Average Value
Number
Average Value
LOANS ORIGINATED
1
$117,370
16
$91,698
34
$95,484
2
$32,145
7
$83,250
APPLICATIONS APPROVED, NOT ACCEPTED
0
$0
3
$83,483
6
$109,398
0
$0
0
$0
APPLICATIONS DENIED
0
$0
6
$55,322
17
$73,199
2
$29,715
1
$61,300
APPLICATIONS WITHDRAWN
0
$0
2
$89,525
14
$86,801
3
$26,040
1
$66,910
FILES CLOSED FOR INCOMPLETENESS
0
$0
0
$0
3
$61,427
0
$0
0
$0
Aggregated Statistics For Year 2000 (Based on 2 partial tracts)
A) FHA, FSA/RHS & VA Home Purchase Loans
B) Conventional Home Purchase Loans
C) Refinancings
D) Home Improvement Loans
F) Non-occupant Loans on < 5 Family Dwellings (A B C & D)
Number
Average Value
Number
Average Value
Number
Average Value
Number
Average Value
Number
Average Value
LOANS ORIGINATED
4
$103,635
19
$81,193
20
$72,910
3
$31,523
3
$94,570
APPLICATIONS APPROVED, NOT ACCEPTED
0
$0
4
$58,408
6
$118,120
3
$27,660
1
$47,470
APPLICATIONS DENIED
1
$104,660
12
$66,848
16
$78,825
2
$21,680
0
$0
APPLICATIONS WITHDRAWN
0
$0
4
$77,562
11
$88,523
0
$0
1
$52,330
FILES CLOSED FOR INCOMPLETENESS
0
$0
1
$35,510
3
$103,170
0
$0
0
$0
Aggregated Statistics For Year 1999 (Based on 1 partial tract)
A) FHA, FSA/RHS & VA Home Purchase Loans
B) Conventional Home Purchase Loans
C) Refinancings
D) Home Improvement Loans
F) Non-occupant Loans on < 5 Family Dwellings (A B C & D)
Detailed PMIC statistics for the following Tracts:0024.00
2003 - 2018 National Fire Incident Reporting System (NFIRS) incidents
According to the data from the years 2003 - 2018 the average number of fires per year is 13. The highest number of reported fires - 20 took place in 2015, and the least - 0 in 2004. The data has a decreasing trend.
When looking into fire subcategories, the most reports belonged to: Outside Fires (54.7%), and Structure Fires (20.9%).
Fire incident types reported to NFIRS in Zip Code 95916


 Nearest zip codes: 95941, 95930, 95966, 95914, 95965, 95925.


 According to the data from the years 2003 - 2018 the average number of fires per year is 13. The highest number of reported fires - 20 took place in 2015, and the least - 0 in 2004. The data has a decreasing trend.
 When looking into fire subcategories, the most reports belonged to: Outside Fires (54.7%), and Structure Fires (20.9%).