Averages for the 2020 tax year for zip code 95935, filed in 2021:
Average Adjusted Gross Income (AGI) in 2020: $42,200 (Individual Income Tax Returns)
Here:
$42,200
State:
$95,910
Salary/wage: $41,095 (reported on 61.3% of returns)
Here:
$41,095
State:
$77,331
(% of AGI for various income ranges: 1084.3% for AGIs below $25k, 3021.7% for AGIs $25k-50k, 5946.7% for AGIs $50k-75k, 17260.0% for AGIs $75k-100k)
Taxable interest for individuals: $230 (reported on 32.3% of returns)
This zip code:
$230
California:
$2,294
(% of AGI for various income ranges: 5.7% for AGIs below $25k, 10.0% for AGIs $25k-50k, 20.0% for AGIs $50k-75k, 35.0% for AGIs $75k-100k)
Ordinary dividends: $1,067 (reported on 9.7% of returns)
Here:
$1,067
State:
$10,949
(% of AGI for various income ranges: 53.3% for AGIs $25k-50k)
Net capital gain/loss in AGI: +$2,067 (reported on 9.7% of returns)
Here:
+$2,067
State:
+$49,306
(% of AGI for various income ranges: 103.3% for AGIs $25k-50k)
Profit/loss from business: +$9,417 (reported on 19.4% of returns)
Here:
+$9,417
State:
+$15,671
(% of AGI for various income ranges: 240.0% for AGIs below $25k, 661.7% for AGIs $25k-50k)
Total itemized deductions: $29,550 (reported on 6.5% of returns)
Here:
$29,550
State:
$39,517
(% of AGI for various income ranges: 985.0% for AGIs $25k-50k)
Taxes paid: $7,400 (reported on 6.5% of returns)
95935:
$7,400
State:
$8,807
(% of AGI for various income ranges: 246.7% for AGIs $25k-50k)
Earned income credit: $2,120 (reported on 16.1% of returns)
Here:
$2,120
State:
$2,074
(% of AGI for various income ranges: 151.4% for AGIs below $25k)
Percentage of individuals using paid preparers for their 2020 taxes: 93.5%
Here:
94%
State:
92%
(% for various income ranges: 92.3% for AGIs below $25k, 100.0% for AGIs $25k-50k, 80.0% for AGIs $50k-75k, 100.0% for AGIs $75k-100k, 100.0% for AGIs $100k-200k)
Averages for the 2012 tax year for zip code 95935, filed in 2013:
Average Adjusted Gross Income (AGI) in 2012: $36,854 (Individual Income Tax Returns)
Here:
$36,854
State:
$72,726
Salary/wage: $36,033 (reported on 64.3% of returns)
Here:
$36,033
State:
$59,079
(% of AGI for various income ranges: 59.1% for AGIs below $25k, 67.5% for AGIs $25k-50k, 72.2% for AGIs $50k-75k, 56.2% for AGIs $75k-100k)
Taxable interest for individuals: $491 (reported on 39.3% of returns)
This zip code:
$491
California:
$2,146
(% of AGI for various income ranges: 1.8% for AGIs below $25k, 0.4% for AGIs $25k-50k, 0.4% for AGIs $75k-100k)
Ordinary dividends: $960 (reported on 17.9% of returns)
Here:
$960
State:
$9,308
Net capital gain/loss in AGI: +$233 (reported on 10.7% of returns)
Here:
+$233
State:
+$30,460
Profit/loss from business: +$4,933 (reported on 21.4% of returns)
Here:
+$4,933
State:
+$17,064
Taxable individual retirement arrangement distribution: $7,800 (reported on 7.1% of returns)
95935:
$7,800
California:
$19,557
Total itemized deductions: $20,400 (31% of AGI, reported on 28.6% of returns)
Here:
$20,400
State:
$34,004
Here:
30.8% of AGI
State:
22.7% of AGI
Charity contributions: $1,660 (reported on 17.9% of returns)
Here:
$1,660
State:
$4,659
Taxes paid: $5,188 (reported on 28.6% of returns)
95935:
$5,188
State:
$14,448
Earned income credit: $2,357 (reported on 25.0% of returns)
Here:
$2,357
State:
$2,286
(% of AGI for various income ranges: 10.8% for AGIs below $25k)
Percentage of individuals using paid preparers for their 2012 taxes: 53.6%
Here:
54%
State:
64%
(% for various income ranges: 53.8% for AGIs below $25k, 57.1% for AGIs $25k-50k, 50.0% for AGIs $50k-75k, 50.0% for AGIs $75k-100k)
Averages for the 2004 tax year for zip code 95935, filed in 2005:
Average Adjusted Gross Income (AGI) in 2004: $32,738 (Individual Income Tax Returns)
Here:
$32,738
State:
$58,600
Salary/wage: $32,307 (reported on 78.1% of returns)
Here:
$32,307
State:
$49,455
(% of AGI for various income ranges: 77.6% for AGIs below $10k, 65.3% for AGIs $10k-25k, 71.2% for AGIs $25k-50k, 80.5% for AGIs $50k-75k, 166.6% for AGIs $75k-100k)
Taxable interest for individuals: $938 (reported on 40.1% of returns)
This zip code:
$938
California:
$2,365
(% of AGI for various income ranges: 4.2% for AGIs below $10k, 2.6% for AGIs $10k-25k, 1.5% for AGIs $25k-50k, 0.5% for AGIs $50k-75k, 0.5% for AGIs $75k-100k)
Taxable dividends: $800 (reported on 16.1% of returns)
Here:
$800
State:
$4,746
Net capital gain/loss: +$81 (reported on 13.3% of returns)
Here:
+$81
State:
+$23,418
Profit/loss from business: +$6,257 (reported on 12.5% of returns)
Here:
+$6,257
State:
+$16,826
Total itemized deductions: $19,662 (36% of AGI, reported on 28.7% of returns)
Here:
$19,662
State:
$28,113
Here:
36.2% of AGI
State:
25.3% of AGI
(% of AGI for various income ranges: 22.4% for AGIs $10k-25k, 14.6% for AGIs $25k-50k, 23.5% for AGIs $50k-75k, 23.3% for AGIs over 100k)
Charity contributions deductions: $2,508 (4% of AGI, reported on 21.9% of returns)
Here:
$2,508
State:
$3,923
Here:
4.5% of AGI
State:
3.3% of AGI
(% of AGI for various income ranges: 2.6% for AGIs $10k-25k, 0.8% for AGIs $25k-50k, 1.5% for AGIs $50k-75k, 4.5% for AGIs $75k-100k)
Total tax: $3,461 (reported on 73.1% of returns)
95935:
$3,461
State:
$10,761
(% of AGI for various income ranges: 2.8% for AGIs below $10k, 5.3% for AGIs $10k-25k, 5.8% for AGIs $25k-50k, 8.3% for AGIs $50k-75k, 10.3% for AGIs $75k-100k, 11.8% for AGIs over 100k)
Earned income credit: $1,642 (reported on 19.0% of returns)
Here:
$1,642
State:
$1,763
Percentage of individuals using paid preparers for their 2004 taxes: 50.5%
Here:
51%
State:
66%
(% for various income ranges: 39.7% for AGIs below $10k, 52.9% for AGIs $10k-25k, 48.4% for AGIs $25k-50k, 60.9% for AGIs $50k-75k, 92.9% for AGIs $75k-100k)
Household received Food Stamps/SNAP in the past 12 months: 45 Household did not receive Food Stamps/SNAP in the past 12 months: 169
Women who did not have a birth in the past 12 months: 30 (0 now married, 31 unmarried)
Housing units in zip code 95935 with a mortgage: 143 (9 second mortgage, 10 both second mortgage and home equity loan) Residents with income below the poverty level in 2022:
This zip code:
22.1%
Whole state:
12.2%
Residents with income below 50% of the poverty level in 2022:
This zip code:
1.3%
Whole state:
6.2%
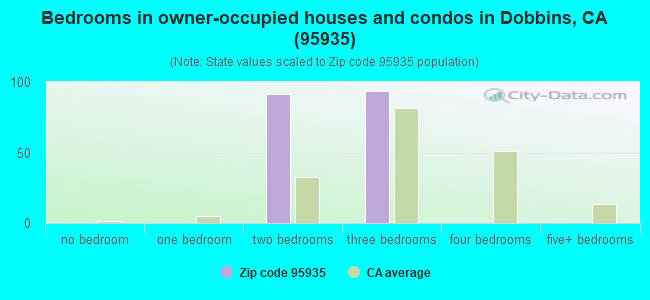
Median number of rooms in houses and condos:
Here:
5.5
State:
6.0
Notable locations in this zip code not listed on our city pages
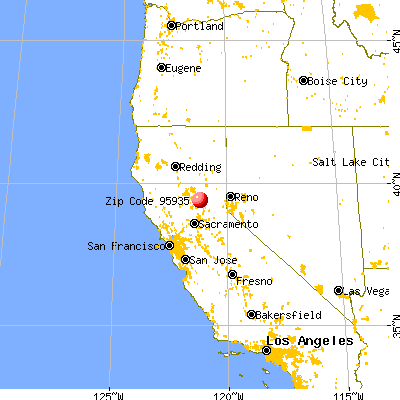
Notable locations in zip code 95935: Williams Ranch (A), Colgate Powerhouse (B), Yuba County Forestry Headquarter (C). Display/hide their locations on the map
In group quarters: 29 (-1 institutionalized population)
Size of family households: 139 2-persons, 47 3-persons
Size of nonfamily households: 25 2-persons
14 married couples with children.
29 single-parent households (29 men).
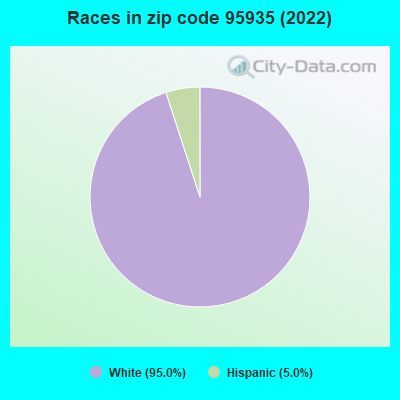
100.5% of residents of 95935 zip code speak English at home.
Foreign born population: 0 (0.0%)
:
0.0%
Whole state:
26.7%
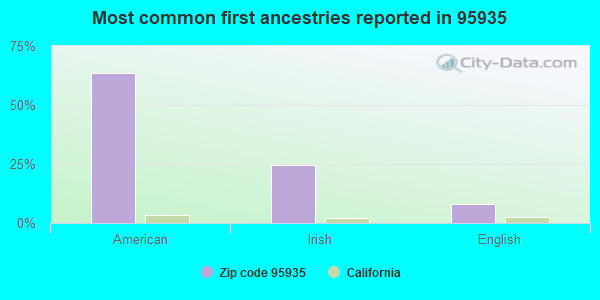
64%American
25%Irish
8%English
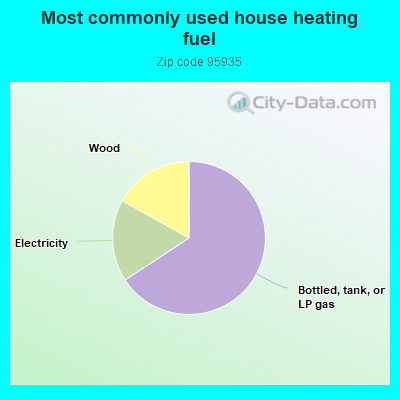
66.2%Bottled, tank, or LP gas
17.5%Electricity
17.0%Wood
Population in 1990: 1,502.
Place of birth for U.S.-born residents:
This state: 294
Northeast: 28
Midwest: 76
South: 4
West: 51
42% of the 95935 zip code residents lived in the same house 5 years ago. Out of people who lived in different houses, 71% lived in this county. Out of people who lived in different counties, 50% lived in California.
80% of the 95935 zip code residents lived in the same house 1 year ago. Out of people who lived in different houses, 78% moved from this county. Out of people who lived in different houses, 15% moved from different county within same state.
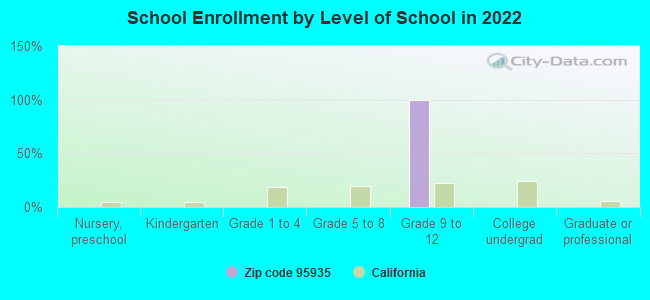
Students in private schools in grades 9 to 12 (high school): 15
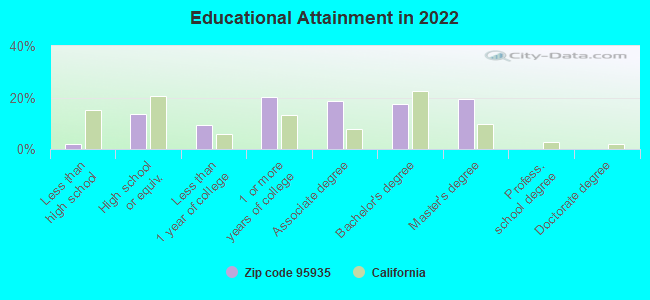
Here:
100.0%
California:
8.5%
Top industries in this zip code by the number of employees in 2005:
Health Care and Social Assistance: Other Residential Care Facilities (10-19 employees: 1 establishment)
Arts, Entertainment, and Recreation: Marinas (5-9: 1)
Construction: Plumbing, Heating, and Air-Conditioning Contractors (1-4: 1)
Real Estate and Rental and Leasing: Lessors of Other Real Estate Property (1-4: 1)
Real Estate and Rental and Leasing: Lessors of Nonresidential Buildings (except Miniwarehouses) (1-4: 1)
Other Services (except Public Administration): Religious Organizations (1-4: 1)
People in group quarters in 2000:
26 people in other nonhousehold living situations
Fatal accident statistics in 2014:
Fatal accident count: 1
Vehicles involved in fatal accidents: 1
Fatal accidents caused by drunken drivers: 0
Fatalities: 1
Persons involved in fatal accidents: 1
Pedestrians involved in fatal accidents: 0
Home Mortgage Disclosure Act Aggregated Statistics For Year 2009 (Based on 2 partial tracts)
A) FHA, FSA/RHS & VA Home Purchase Loans
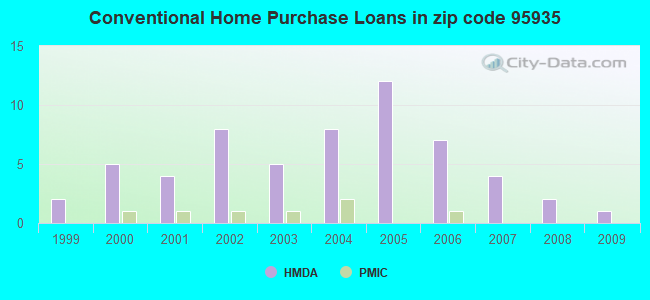
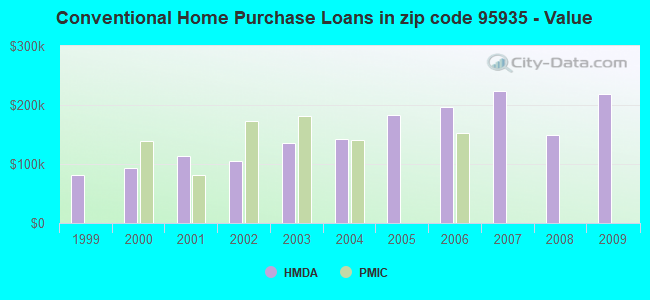
B) Conventional Home Purchase Loans
C) Refinancings
D) Home Improvement Loans
F) Non-occupant Loans on < 5 Family Dwellings (A B C & D)
G) Loans On Manufactured Home Dwelling (A B C & D)
Number
Average Value
Number
Average Value
Number
Average Value
Number
Average Value
Number
Average Value
Number
Average Value
LOANS ORIGINATED
2
$211,995
1
$218,130
6
$176,743
0
$0
2
$151,220
1
$241,530
APPLICATIONS APPROVED, NOT ACCEPTED
0
$0
0
$0
1
$124,080
0
$0
0
$0
0
$0
APPLICATIONS DENIED
1
$77,830
1
$173,150
6
$199,233
1
$28,480
1
$108,850
2
$187,670
APPLICATIONS WITHDRAWN
0
$0
0
$0
2
$210,160
0
$0
1
$61,480
1
$101,660
FILES CLOSED FOR INCOMPLETENESS
0
$0
0
$0
0
$0
0
$0
0
$0
0
$0
Aggregated Statistics For Year 2008 (Based on 2 partial tracts)
A) FHA, FSA/RHS & VA Home Purchase Loans
B) Conventional Home Purchase Loans
C) Refinancings
D) Home Improvement Loans
F) Non-occupant Loans on < 5 Family Dwellings (A B C & D)
G) Loans On Manufactured Home Dwelling (A B C & D)
Number
Average Value
Number
Average Value
Number
Average Value
Number
Average Value
Number
Average Value
Number
Average Value
LOANS ORIGINATED
1
$252,250
2
$149,530
7
$188,276
1
$87,140
2
$138,745
3
$215,730
APPLICATIONS APPROVED, NOT ACCEPTED
0
$0
0
$0
2
$183,370
0
$0
1
$139,730
1
$169,340
APPLICATIONS DENIED
0
$0
1
$210,940
7
$177,620
2
$128,240
1
$46,390
2
$152,775
APPLICATIONS WITHDRAWN
0
$0
0
$0
3
$212,580
0
$0
0
$0
1
$128,170
FILES CLOSED FOR INCOMPLETENESS
0
$0
0
$0
1
$190,630
0
$0
0
$0
0
$0
Aggregated Statistics For Year 2007 (Based on 2 partial tracts)
B) Conventional Home Purchase Loans
C) Refinancings
D) Home Improvement Loans
F) Non-occupant Loans on < 5 Family Dwellings (A B C & D)
G) Loans On Manufactured Home Dwelling (A B C & D)
Number
Average Value
Number
Average Value
Number
Average Value
Number
Average Value
Number
Average Value
LOANS ORIGINATED
4
$223,450
11
$217,653
3
$134,043
2
$253,940
4
$167,015
APPLICATIONS APPROVED, NOT ACCEPTED
1
$143,260
3
$287,077
0
$0
0
$0
1
$201,630
APPLICATIONS DENIED
2
$167,510
10
$246,792
2
$101,730
0
$0
3
$169,340
APPLICATIONS WITHDRAWN
1
$185,840
4
$251,402
1
$111,670
0
$0
1
$124,930
FILES CLOSED FOR INCOMPLETENESS
0
$0
2
$233,000
0
$0
0
$0
0
$0
Aggregated Statistics For Year 2006 (Based on 2 partial tracts)
A) FHA, FSA/RHS & VA Home Purchase Loans
B) Conventional Home Purchase Loans
C) Refinancings
D) Home Improvement Loans
F) Non-occupant Loans on < 5 Family Dwellings (A B C & D)
G) Loans On Manufactured Home Dwelling (A B C & D)
Number
Average Value
Number
Average Value
Number
Average Value
Number
Average Value
Number
Average Value
Number
Average Value
LOANS ORIGINATED
1
$183,860
7
$196,090
15
$211,913
3
$94,423
2
$208,325
5
$176,362
APPLICATIONS APPROVED, NOT ACCEPTED
0
$0
2
$139,095
4
$236,245
0
$0
0
$0
1
$116,320
APPLICATIONS DENIED
0
$0
5
$178,928
16
$236,228
3
$131,930
1
$194,020
5
$151,068
APPLICATIONS WITHDRAWN
0
$0
3
$161,070
8
$255,650
1
$90,660
0
$0
1
$207,970
FILES CLOSED FOR INCOMPLETENESS
0
$0
0
$0
2
$251,545
0
$0
0
$0
0
$0
Aggregated Statistics For Year 2005 (Based on 2 partial tracts)
B) Conventional Home Purchase Loans
C) Refinancings
D) Home Improvement Loans
F) Non-occupant Loans on < 5 Family Dwellings (A B C & D)
G) Loans On Manufactured Home Dwelling (A B C & D)
Number
Average Value
Number
Average Value
Number
Average Value
Number
Average Value
Number
Average Value
LOANS ORIGINATED
12
$182,818
19
$181,296
4
$105,610
2
$229,335
6
$167,062
APPLICATIONS APPROVED, NOT ACCEPTED
2
$203,955
4
$176,180
0
$0
1
$151,010
2
$114,560
APPLICATIONS DENIED
4
$172,690
12
$165,981
2
$132,610
1
$142,550
4
$116,360
APPLICATIONS WITHDRAWN
3
$152,983
8
$144,366
0
$0
0
$0
3
$118,157
FILES CLOSED FOR INCOMPLETENESS
1
$79,520
3
$186,073
0
$0
0
$0
1
$152,000
Aggregated Statistics For Year 2004 (Based on 2 partial tracts)
B) Conventional Home Purchase Loans
C) Refinancings
D) Home Improvement Loans
F) Non-occupant Loans on < 5 Family Dwellings (A B C & D)
G) Loans On Manufactured Home Dwelling (A B C & D)
Number
Average Value
Number
Average Value
Number
Average Value
Number
Average Value
Number
Average Value
LOANS ORIGINATED
8
$142,128
18
$152,789
3
$122,200
3
$139,353
5
$127,040
APPLICATIONS APPROVED, NOT ACCEPTED
1
$105,470
5
$147,598
0
$0
0
$0
1
$130,280
APPLICATIONS DENIED
5
$143,678
15
$155,645
2
$104,620
1
$93,910
6
$152,022
APPLICATIONS WITHDRAWN
2
$160,600
7
$147,143
0
$0
1
$120,270
1
$114,070
FILES CLOSED FOR INCOMPLETENESS
0
$0
2
$120,625
0
$0
0
$0
0
$0
Aggregated Statistics For Year 2003 (Based on 2 partial tracts)
B) Conventional Home Purchase Loans
C) Refinancings
D) Home Improvement Loans
F) Non-occupant Loans on < 5 Family Dwellings (A B C & D)
Number
Average Value
Number
Average Value
Number
Average Value
Number
Average Value
LOANS ORIGINATED
5
$134,796
21
$131,050
1
$32,710
2
$133,810
APPLICATIONS APPROVED, NOT ACCEPTED
1
$130,710
4
$123,128
1
$28,200
0
$0
APPLICATIONS DENIED
2
$130,355
9
$137,507
1
$37,790
1
$57,390
APPLICATIONS WITHDRAWN
1
$113,930
6
$130,730
0
$0
0
$0
FILES CLOSED FOR INCOMPLETENESS
0
$0
2
$85,585
0
$0
0
$0
Aggregated Statistics For Year 2002 (Based on 2 partial tracts)
A) FHA, FSA/RHS & VA Home Purchase Loans
B) Conventional Home Purchase Loans
C) Refinancings
F) Non-occupant Loans on < 5 Family Dwellings (A B C & D)
Number
Average Value
Number
Average Value
Number
Average Value
Number
Average Value
LOANS ORIGINATED
1
$112,800
8
$104,464
14
$117,745
2
$75,225
APPLICATIONS APPROVED, NOT ACCEPTED
0
$0
1
$53,860
2
$97,855
0
$0
APPLICATIONS DENIED
0
$0
2
$71,205
6
$112,212
1
$63,590
APPLICATIONS WITHDRAWN
0
$0
1
$142,830
5
$125,264
1
$98,140
FILES CLOSED FOR INCOMPLETENESS
0
$0
0
$0
1
$110,400
0
$0
Aggregated Statistics For Year 2001 (Based on 2 partial tracts)
A) FHA, FSA/RHS & VA Home Purchase Loans
B) Conventional Home Purchase Loans
C) Refinancings
D) Home Improvement Loans
F) Non-occupant Loans on < 5 Family Dwellings (A B C & D)
Number
Average Value
Number
Average Value
Number
Average Value
Number
Average Value
Number
Average Value
LOANS ORIGINATED
1
$101,380
4
$114,315
11
$103,405
0
$0
2
$106,735
APPLICATIONS APPROVED, NOT ACCEPTED
0
$0
1
$67,680
1
$115,060
0
$0
0
$0
APPLICATIONS DENIED
0
$0
1
$116,890
6
$113,905
1
$25,660
0
$0
APPLICATIONS WITHDRAWN
0
$0
1
$34,690
3
$86,810
0
$0
0
$0
FILES CLOSED FOR INCOMPLETENESS
0
$0
0
$0
0
$0
0
$0
0
$0
Aggregated Statistics For Year 2000 (Based on 2 partial tracts)
A) FHA, FSA/RHS & VA Home Purchase Loans
B) Conventional Home Purchase Loans
C) Refinancings
D) Home Improvement Loans
F) Non-occupant Loans on < 5 Family Dwellings (A B C & D)
Number
Average Value
Number
Average Value
Number
Average Value
Number
Average Value
Number
Average Value
LOANS ORIGINATED
2
$70,640
5
$93,680
4
$93,095
1
$18,190
1
$79,240
APPLICATIONS APPROVED, NOT ACCEPTED
0
$0
1
$84,460
1
$95,460
1
$46,530
0
$0
APPLICATIONS DENIED
0
$0
2
$103,845
4
$121,718
1
$25,240
0
$0
APPLICATIONS WITHDRAWN
0
$0
1
$107,720
2
$100,815
0
$0
0
$0
FILES CLOSED FOR INCOMPLETENESS
0
$0
0
$0
0
$0
0
$0
0
$0
Aggregated Statistics For Year 1999 (Based on 1 partial tract)
B) Conventional Home Purchase Loans
C) Refinancings
F) Non-occupant Loans on < 5 Family Dwellings (A B C & D)
Detailed PMIC statistics for the following Tracts:0411.00
2004 - 2018 National Fire Incident Reporting System (NFIRS) incidents
According to the data from the years 2004 - 2018 the average number of fires per year is 10. The highest number of reported fires - 19 took place in 2010, and the least - 2 in 2004. The data has an increasing trend.
When looking into fire subcategories, the most reports belonged to: Outside Fires (78.8%), and Structure Fires (13.5%).
Fire incident types reported to NFIRS in Zip Code 95935


 Nearest zip codes: 95962, 95919, 95925, 95941, 95914, 95960.
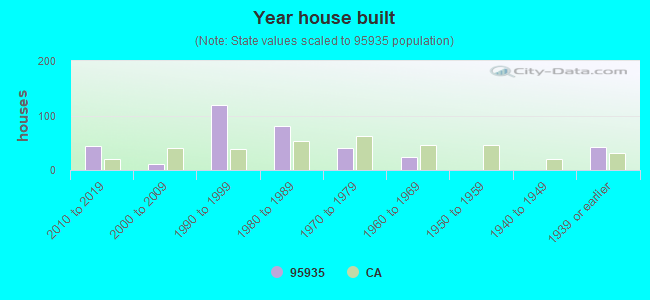


 According to the data from the years 2004 - 2018 the average number of fires per year is 10. The highest number of reported fires - 19 took place in 2010, and the least - 2 in 2004. The data has an increasing trend.
 When looking into fire subcategories, the most reports belonged to: Outside Fires (78.8%), and Structure Fires (13.5%).