Estimated zip code population in 2022: 1,204 Zip code population in 2010: 1,022 Zip code population in 2000: 1,018
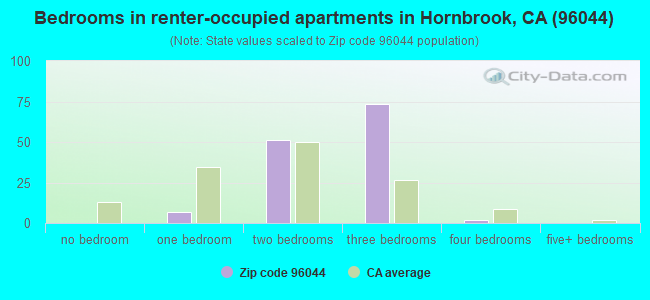
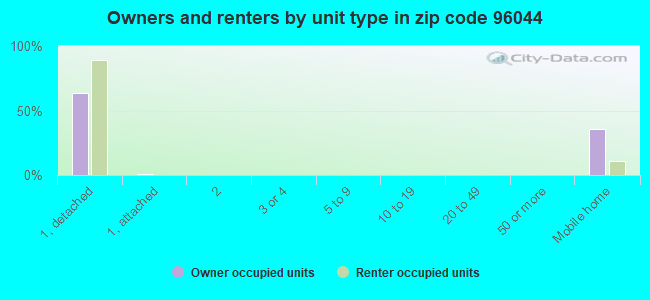
Houses and condos: 608 Renter-occupied apartments: 134
% of renters here:
28%
State:
44%
March 2022 cost of living index in zip code 96044: 93.7 (less than average, U.S. average is 100)
Land area: 140.9 sq. mi. Water area: 2.1 sq. mi.
Population density: 9 people per square mile
(very low).
OSM Map
General Map
Google Map
MSN Map
OSM Map
General Map
Google Map
MSN Map
OSM Map
General Map
Google Map
MSN Map
OSM Map
General Map
Google Map
MSN Map
Please wait while loading the map...
Real estate property taxes paid for housing units in 2022:
This zip code:
0.6% ($1,270)
California:
0.7% ($4,831)
Median real estate property taxes paid for housing units with mortgages in 2022: $1,736 (0.7%) Median real estate property taxes paid for housing units with no mortgage in 2022: $1,042 (0.6%)
Business Search- 14 Million verified businesses
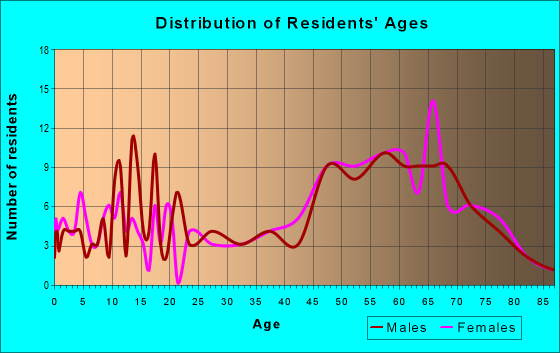
Males: 563
(46.7%)
Females: 641
(53.3%)
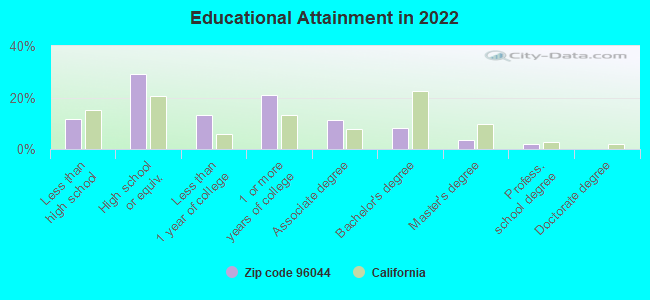
For population 25 years and over in 96044:
High school or higher: 86.3%
Bachelor's degree or higher: 13.6%
Graduate or professional degree: 5.6%
Unemployed: 12.2%
Mean travel time to work (commute): 21.2 minutes
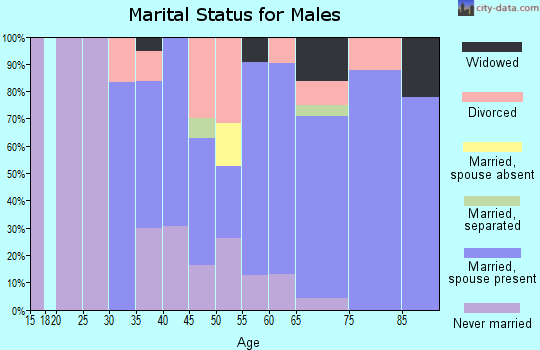
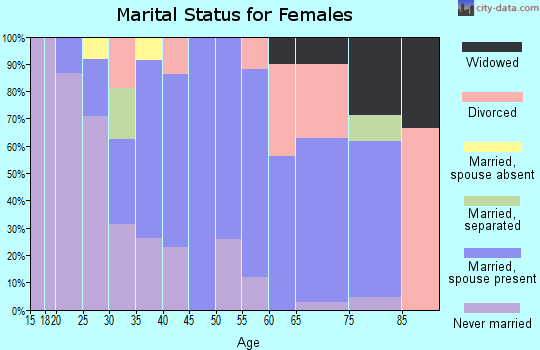
For population 15 years and over in 96044:
Never married: 30.2%
Now married: 43.9%
Separated: 1.7%
Widowed: 5.5%
Divorced: 18.7%
Zip code 96044 compared to state average:
Median household income below state average.
Median house value significantly below state average.
Unemployed percentage above state average.
Black race population percentage significantly below state average.
Hispanic race population percentage significantly below state average.
Median age significantly above state average.
Foreign-born population percentage significantly below state average.
Renting percentage below state average.
Length of stay since moving in below state average.
Number of college students significantly below state average.
Percentage of population with a bachelor's degree or higher significantly below state average.
Averages for the 2020 tax year for zip code 96044, filed in 2021:
Average Adjusted Gross Income (AGI) in 2020: $48,136 (Individual Income Tax Returns)
Here:
$48,136
State:
$95,910
Salary/wage: $38,768 (reported on 66.7% of returns)
Here:
$38,768
State:
$77,331
(% of AGI for various income ranges: 1095.0% for AGIs below $25k, 4054.3% for AGIs $25k-50k, 7186.7% for AGIs $50k-75k, 4920.0% for AGIs $75k-100k)
Taxable interest for individuals: $619 (reported on 38.1% of returns)
This zip code:
$619
California:
$2,294
(% of AGI for various income ranges: 41.7% for AGIs below $25k, 14.3% for AGIs $25k-50k, 90.0% for AGIs $50k-75k)
Ordinary dividends: $2,025 (reported on 9.5% of returns)
Here:
$2,025
State:
$10,949
(% of AGI for various income ranges: 25.8% for AGIs below $25k, 166.7% for AGIs $50k-75k)
Net capital gain/loss in AGI: +$2,267 (reported on 14.3% of returns)
Here:
+$2,267
State:
+$49,306
(% of AGI for various income ranges: 473.3% for AGIs $50k-75k)
Profit/loss from business: +$8,767 (reported on 14.3% of returns)
Here:
+$8,767
State:
+$15,671
(% of AGI for various income ranges: 112.5% for AGIs below $25k, 558.6% for AGIs $25k-50k)
Taxable individual retirement arrangement distribution: $9,567 (reported on 7.1% of returns)
96044:
$9,567
California:
$23,505
(% of AGI for various income ranges: 239.2% for AGIs below $25k)
Earned income credit: $2,212 (reported on 19.0% of returns)
Here:
$2,212
State:
$2,074
(% of AGI for various income ranges: 97.5% for AGIs below $25k, 85.7% for AGIs $25k-50k)
Percentage of individuals using paid preparers for their 2020 taxes: 90.5%
Here:
90%
State:
92%
(% for various income ranges: 88.9% for AGIs below $25k, 90.9% for AGIs $25k-50k, 83.3% for AGIs $50k-75k, 100.0% for AGIs $75k-100k, 100.0% for AGIs $100k-200k)
Averages for the 2012 tax year for zip code 96044, filed in 2013:
Average Adjusted Gross Income (AGI) in 2012: $38,629 (Individual Income Tax Returns)
Here:
$38,629
State:
$72,726
Salary/wage: $31,783 (reported on 68.6% of returns)
Here:
$31,783
State:
$59,079
(% of AGI for various income ranges: 49.5% for AGIs below $25k, 64.5% for AGIs $25k-50k, 80.5% for AGIs $50k-75k, 58.2% for AGIs $100k-200k)
Taxable interest for individuals: $371 (reported on 40.0% of returns)
This zip code:
$371
California:
$2,146
(% of AGI for various income ranges: 2.0% for AGIs below $25k, 0.2% for AGIs $50k-75k, 0.4% for AGIs $75k-100k)
Ordinary dividends: $1,450 (reported on 17.1% of returns)
Here:
$1,450
State:
$9,308
Profit/loss from business: +$8,771 (reported on 20.0% of returns)
Here:
+$8,771
State:
+$17,064
(% of AGI for various income ranges: 14.6% for AGIs below $25k, 10.3% for AGIs $25k-50k)
Taxable individual retirement arrangement distribution: $10,467 (reported on 8.6% of returns)
96044:
$10,467
California:
$19,557
Total itemized deductions: $18,778 (26% of AGI, reported on 25.7% of returns)
Here:
$18,778
State:
$34,004
Here:
26.5% of AGI
State:
22.7% of AGI
(% of AGI for various income ranges: 16.7% for AGIs $25k-50k, 19.5% for AGIs $50k-75k, 14.9% for AGIs $100k-200k)
Charity contributions: $2,600 (reported on 20.0% of returns)
Here:
$2,600
State:
$4,659
(% of AGI for various income ranges: 3.0% for AGIs below $25k, 3.0% for AGIs $50k-75k, 0.9% for AGIs $100k-200k)
Taxes paid: $6,025 (reported on 22.9% of returns)
96044:
$6,025
State:
$14,448
(% of AGI for various income ranges: 2.7% for AGIs $25k-50k, 5.3% for AGIs $50k-75k, 6.5% for AGIs $100k-200k)
Earned income credit: $1,750 (reported on 22.9% of returns)
Here:
$1,750
State:
$2,286
(% of AGI for various income ranges: 7.5% for AGIs below $25k)
Percentage of individuals using paid preparers for their 2012 taxes: 60.0%
Here:
60%
State:
64%
(% for various income ranges: 56.2% for AGIs below $25k, 66.7% for AGIs $25k-50k, 60.0% for AGIs $50k-75k, 150.0% for AGIs $75k-100k)
Averages for the 2004 tax year for zip code 96044, filed in 2005:
Average Adjusted Gross Income (AGI) in 2004: $33,038 (Individual Income Tax Returns)
Here:
$33,038
State:
$58,600
Salary/wage: $27,212 (reported on 70.0% of returns)
Here:
$27,212
State:
$49,455
(% of AGI for various income ranges: 73.8% for AGIs below $10k, 54.6% for AGIs $10k-25k, 66.9% for AGIs $25k-50k, 61.6% for AGIs $50k-75k, 119.2% for AGIs $75k-100k)
Taxable interest for individuals: $1,122 (reported on 46.4% of returns)
This zip code:
$1,122
California:
$2,365
(% of AGI for various income ranges: 5.3% for AGIs below $10k, 4.4% for AGIs $10k-25k, 1.0% for AGIs $25k-50k, 1.4% for AGIs $50k-75k, 1.3% for AGIs $75k-100k)
Taxable dividends: $1,597 (reported on 19.7% of returns)
Here:
$1,597
State:
$4,746
(% of AGI for various income ranges: 3.2% for AGIs $10k-25k, 0.6% for AGIs $25k-50k, 0.2% for AGIs $50k-75k, 2.2% for AGIs $75k-100k)
Net capital gain/loss: +$2,593 (reported on 22.1% of returns)
Here:
+$2,593
State:
+$23,418
(% of AGI for various income ranges: 1.5% for AGIs $10k-25k, 2.7% for AGIs $25k-50k, 1.6% for AGIs $50k-75k, 3.0% for AGIs $75k-100k)
Profit/loss from business: +$6,257 (reported on 19.0% of returns)
Here:
+$6,257
State:
+$16,826
(% of AGI for various income ranges: -2.2% for AGIs below $10k, 9.8% for AGIs $10k-25k, 3.7% for AGIs $25k-50k, 4.8% for AGIs $50k-75k)
Total itemized deductions: $16,232 (27% of AGI, reported on 24.4% of returns)
Here:
$16,232
State:
$28,113
Here:
27.2% of AGI
State:
25.3% of AGI
(% of AGI for various income ranges: 16.3% for AGIs $10k-25k, 10.9% for AGIs $25k-50k, 10.3% for AGIs $50k-75k, 35.6% for AGIs $75k-100k)
Charity contributions deductions: $2,000 (3% of AGI, reported on 18.2% of returns)
Here:
$2,000
State:
$3,923
Here:
3.4% of AGI
State:
3.3% of AGI
(% of AGI for various income ranges: 0.7% for AGIs $10k-25k, 1.2% for AGIs $25k-50k, 2.0% for AGIs $50k-75k, 1.7% for AGIs $75k-100k)
Total tax: $4,257 (reported on 70.8% of returns)
96044:
$4,257
State:
$10,761
(% of AGI for various income ranges: 1.9% for AGIs below $10k, 3.7% for AGIs $10k-25k, 6.7% for AGIs $25k-50k, 9.4% for AGIs $50k-75k, 10.0% for AGIs $75k-100k, 18.1% for AGIs over 100k)
Earned income credit: $1,391 (reported on 17.7% of returns)
Here:
$1,391
State:
$1,763
Percentage of individuals using paid preparers for their 2004 taxes: 61.0%
Here:
61%
State:
66%
(% for various income ranges: 51.2% for AGIs below $10k, 62.9% for AGIs $10k-25k, 62.3% for AGIs $25k-50k, 87.0% for AGIs $50k-75k, 90.9% for AGIs over 100k)
Household received Food Stamps/SNAP in the past 12 months: 96 Household did not receive Food Stamps/SNAP in the past 12 months: 390
Women who had a birth in the past 12 months: 6 (3 now married, 3 unmarried) Women who did not have a birth in the past 12 months: 175 (59 now married, 116 unmarried)
Housing units in zip code 96044 with a mortgage: 161 (12 second mortgage, 10 both second mortgage and home equity loan) Houses without a mortgage: 9
Median monthly owner costs for units with a mortgage: $1,283 Median monthly owner costs for units without a mortgage: $370
Residents with income below the poverty level in 2022:
This zip code:
21.9%
Whole state:
12.2%
Residents with income below 50% of the poverty level in 2022:
This zip code:
14.8%
Whole state:
6.2%
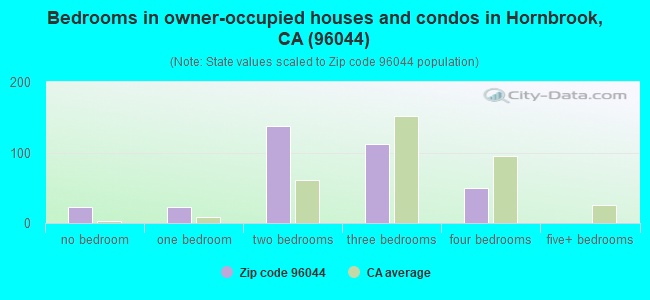
Median number of rooms in houses and condos:
Here:
5.0
State:
6.0
Median number of rooms in apartments:
Here:
5.3
State:
3.9
Notable locations in this zip code not listed on our city pages
Notable locations in zip code 96044: Fall Creek Fish Hatchery (A), Camp Creek Campground (B), Liskey (C), Klamathon (D), Fall Creek Powerhouse (E), Colestin Rural Fire District Station 2 (F), Hornbrook Fire Protection District (G), California Department of Forestry and Fire Protection Hornbrook (H). Display/hide their locations on the map
Creeks: Camp Creek (A), Fall Creek (B), Maxwell Creek (C), Sloan Creek (D), Scotch Creek (E), Spaulding Creek (F), Shelton Creek (G), Hutton Creek (H), Hunts Creek (I). Display/hide their locations on the map
Parks in zip code 96044 include: Alden Historical Marker (1), Jefferson Davis Historical Monument (2), B R Alden Historical Marker (3), Juniper Point Picnic Area (4), Mirror Cove Picnic Area (5). Display/hide their locations on the map
In group quarters: 23 (-1 institutionalized population)
Size of family households: 166 2-persons, 39 3-persons, 54 4-persons, 6 5-persons, 25 6-persons, 3 7-or-more-persons
Size of nonfamily households: 152 1-person, 24 2-persons, 8 3-persons
132 married couples with children.
129 single-parent households (16 men, 113 women).
93.9% of residents of 96044 zip code speak English at home.
3.6% of residents speak Spanish at home (48% very well, 20% well, 15% not well, 18% not at all).
1.6% of residents speak other Indo-European language at home (50% very well, 33% well, 17% not well).
0.2% of residents speak other language at home (100% very well).
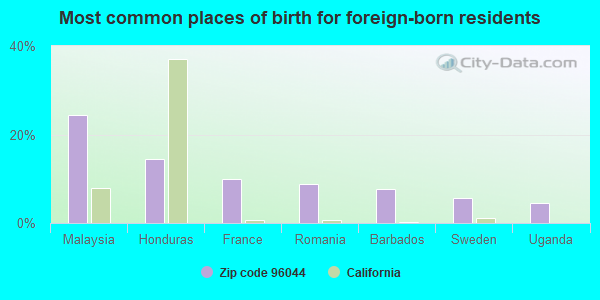
Foreign born population: 91 (7.6%) (71.8% of them are naturalized citizens)
This zip code:
7.6%
Whole state:
26.7%
24%Malaysia
14%Honduras
10%France
9%Romania
8%Barbados
6%Sweden
4%Uganda
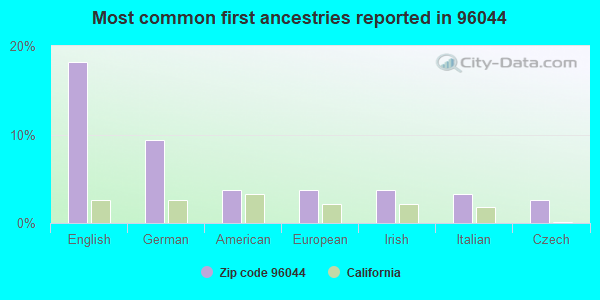
18%English
9%German
4%American
4%European
4%Irish
3%Italian
3%Czech
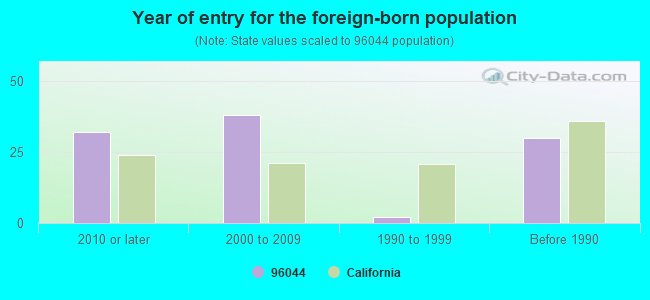
Year of entry for the foreign-born population
322010 or later
382000 to 2009
21990 to 1999
30Before 1990
Facilities with environmental interests located in this zip code:
HORNBROOK ELEMENTARY (15430 OREGON ST. in HORNBROOK, CA)
(National Center for Education Statistics) - STATE ID-6050801
IRONGATE HATCHERY WWTS (COPCO RD in HORNBROOK, CA)
National Pollutant Discharge Elimination System NON-MAJOR (Tracking pollutant discharge elimination systems) - permit Business SIC classification: FISH HATCHERIES AND PRESERVES Organizations: CA DEPT OF FISH & GAME (CONTACT/OWNER)
Alternative names: CA DEPT OF FISH & GAME
HILT TOWN DUMP (T48N, R7W, S23 MDM in HILT, CA)
CRITERIA AND HAZARDOUS AIR POLLUTANT INVENTORY (Inventory of air pollution sources) Business SIC classification: REFUSE SYSTEMS Business NAICS classification: SOLID WASTE LANDFILL.
HORNBROOK - HENLEY (T47N, R6W, S29 MDM in HORNBROOK, CA)
CRITERIA AND HAZARDOUS AIR POLLUTANT INVENTORY (Inventory of air pollution sources) Business SIC classification: REFUSE SYSTEMS Business NAICS classification: SOLID WASTE LANDFILL.
Housing units lacking complete plumbing facilities: 5.0% Housing units lacking complete kitchen facilities: 5.1%
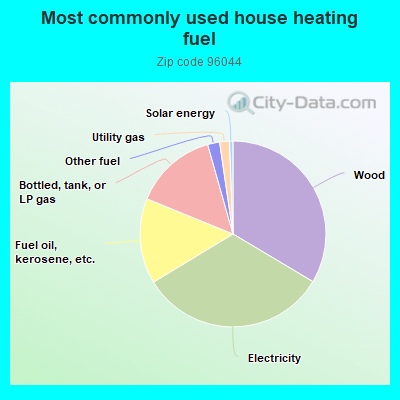
33.7%Wood
32.9%Electricity
14.9%Fuel oil, kerosene, etc.
14.5%Bottled, tank, or LP gas
2.1%Other fuel
1.7%Utility gas
0.6%Solar energy
Population in 1990: 905. Population change in the 1990s: +113 (+12.5%).
Place of birth for U.S.-born residents:
This state: 642
Northeast: 36
Midwest: 106
South: 41
West: 261
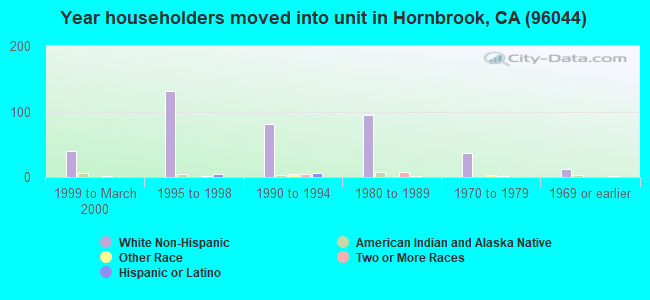
64% of the 96044 zip code residents lived in the same house 5 years ago. Out of people who lived in different houses, 44% lived in this county. Out of people who lived in different counties, 50% lived in California.
84% of the 96044 zip code residents lived in the same house 1 year ago. Out of people who lived in different houses, 54% moved from this county. Out of people who lived in different houses, 11% moved from different county within same state. Out of people who lived in different houses, 31% moved from different state.
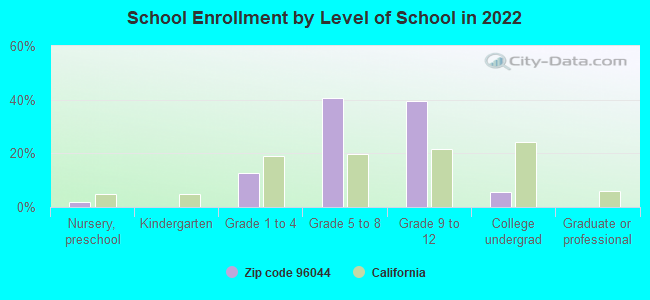
Private vs. public school enrollment:
Students in private schools in grades 1 to 8 (elementary and middle school):
Here:
0.0%
California:
10.5%
Students in private schools in grades 9 to 12 (high school):
Here:
0.0%
California:
8.5%
Students in private undergraduate colleges:
Here:
0.0%
California:
15.9%
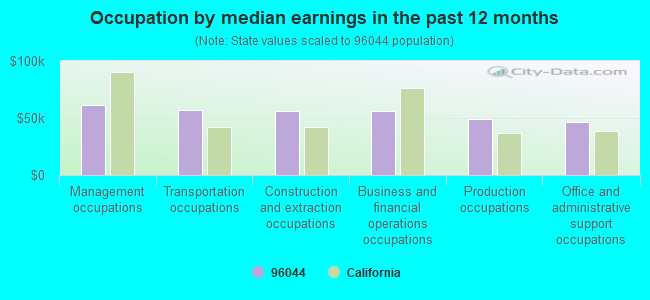
Occupation by median earnings in the past 12 months ($)
61,723Management occupations
57,351Transportation occupations
56,515Construction and extraction occupations
56,026Business and financial operations occupations
49,196Production occupations
46,596Office and administrative support occupations
Top industries in this zip code by the number of employees in 2005:
Accommodation and Food Services: Recreational and Vacation Camps (except Campgrounds) (20-49 employees: 1 establishment)
Utilities: Electric Power Distribution (1-4: 3)
Other Services (except Public Administration): All Other Personal Services (1-4: 1)
Construction: Electrical Contractors (1-4: 1)
Other Services (except Public Administration): Other Similar Organizations (except Business, Professional, Labor, and Political Organizations) (1-4: 1)
Utilities: Hydroelectric Power Generation (1-4: 1)
People in group quarters in 2010:
2 people in workers' group living quarters and job corps centers
Fatal accident statistics in 2013:
Fatal accident count: 2
Vehicles involved in fatal accidents: 4
Fatal accidents caused by drunken drivers: 0
Fatalities: 2
Persons involved in fatal accidents: 8
Pedestrians involved in fatal accidents: 0
Fatal accident statistics in 2012:
Fatal accident count: 2
Vehicles involved in fatal accidents: 3
Fatal accidents caused by drunken drivers: 1
Fatalities: 2
Persons involved in fatal accidents: 3
Pedestrians involved in fatal accidents: 0
2004 - 2018 National Fire Incident Reporting System (NFIRS) incidents
According to the data from the years 2004 - 2018 the average number of fire incidents per year is 14. The highest number of reported fires - 28 took place in 2007, and the least - 1 in 2004. The data has an increasing trend.
When looking into fire subcategories, the most reports belonged to: Outside Fires (64.8%), and Mobile Property/Vehicle Fires (21.9%).
Fire incident types reported to NFIRS in Zip Code 96044
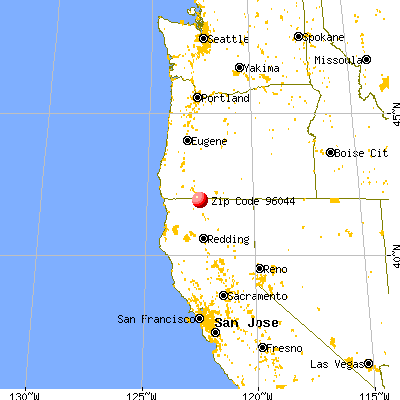


 Nearest zip codes: 96064, 96097, 97520, 96038, 96050, 97540.


 According to the data from the years 2004 - 2018 the average number of fire incidents per year is 14. The highest number of reported fires - 28 took place in 2007, and the least - 1 in 2004. The data has an increasing trend.
 When looking into fire subcategories, the most reports belonged to: Outside Fires (64.8%), and Mobile Property/Vehicle Fires (21.9%).