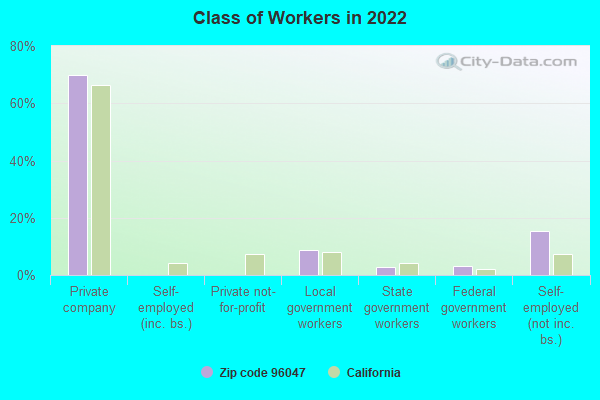
Estimated zip code population in 2022: 836 Zip code population in 2010: 1,004 Zip code population in 2000: 907
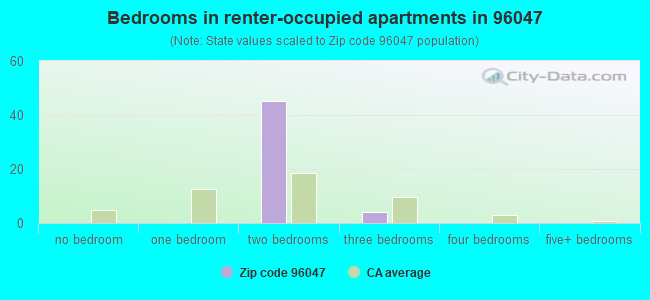
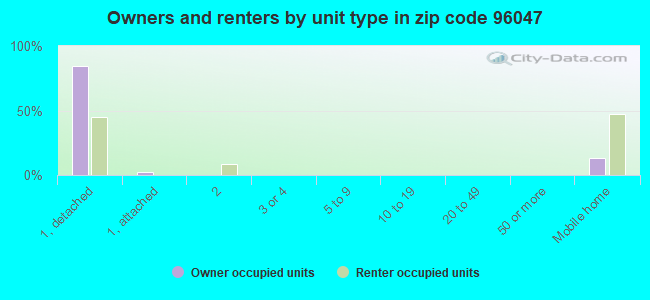
Houses and condos: 486 Renter-occupied apartments: 49
% of renters here:
13%
State:
44%
March 2022 cost of living index in zip code 96047: 94.4 (less than average, U.S. average is 100)
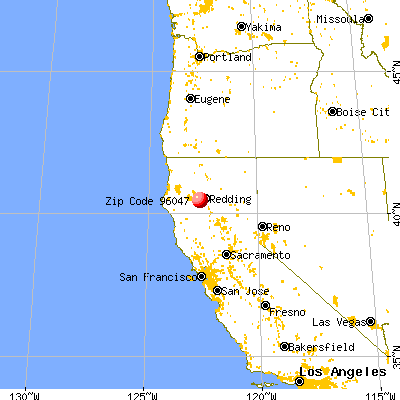
Land area: 205.9 sq. mi. Water area: 0.3 sq. mi.
Population density: 4 people per square mile
(very low).
OSM Map
General Map
Google Map
MSN Map
OSM Map
General Map
Google Map
MSN Map
OSM Map
General Map
Google Map
MSN Map
OSM Map
General Map
Google Map
MSN Map
Please wait while loading the map...
Real estate property taxes paid for housing units in 2022:
This zip code:
0.6% ($2,342)
California:
0.7% ($4,831)
Median real estate property taxes paid for housing units with mortgages in 2022: $2,657 (0.7%) Median real estate property taxes paid for housing units with no mortgage in 2022: $2,178 (0.5%)
Business Search- 14 Million verified businesses
Males: 455
(54.5%)
Females: 379
(45.5%)
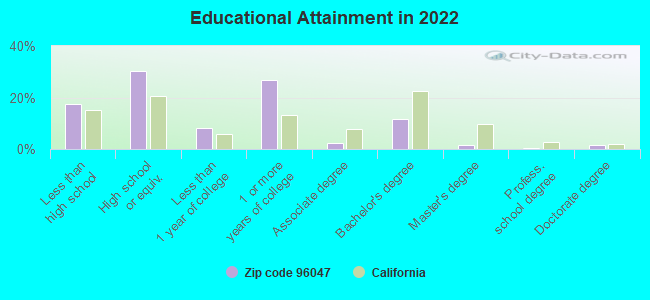
For population 25 years and over in 96047:
High school or higher: 81.6%
Bachelor's degree or higher: 15.2%
Graduate or professional degree: 3.8%
Unemployed: 11.3%
Mean travel time to work (commute): 34.9 minutes
For population 15 years and over in 96047:
Never married: 16.6%
Now married: 63.1%
Separated: 5.3%
Widowed: 8.7%
Divorced: 6.4%
Zip code 96047 compared to state average:
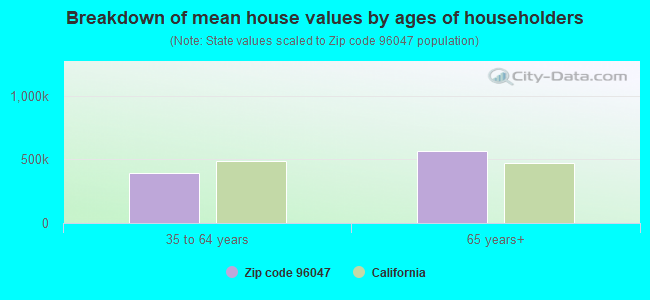
Median house value below state average.
Unemployed percentage above state average.
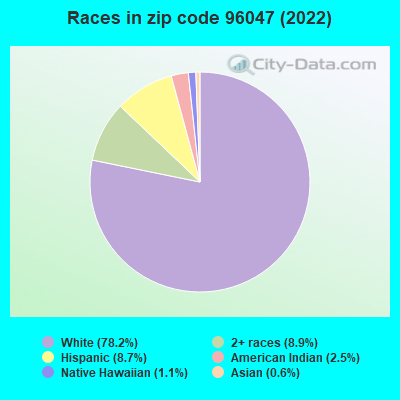
Black race population percentage significantly below state average.
Hispanic race population percentage significantly below state average.
Median age significantly above state average.
Foreign-born population percentage significantly below state average.
Renting percentage significantly below state average.
Length of stay since moving in significantly above state average.
Number of college students below state average.
Percentage of population with a bachelor's degree or higher below state average.
Averages for the 2020 tax year for zip code 96047, filed in 2021:
Average Adjusted Gross Income (AGI) in 2020: $63,281 (Individual Income Tax Returns)
Here:
$63,281
State:
$95,910
Salary/wage: $57,690 (reported on 64.5% of returns)
Here:
$57,690
State:
$77,331
(% of AGI for various income ranges: 1095.0% for AGIs below $25k, 3482.0% for AGIs $25k-50k, 3815.0% for AGIs $50k-75k, 20360.0% for AGIs $100k-200k)
Taxable interest for individuals: $264 (reported on 45.2% of returns)
This zip code:
$264
California:
$2,294
(% of AGI for various income ranges: 16.0% for AGIs $25k-50k, 30.0% for AGIs $50k-75k, 56.7% for AGIs $100k-200k)
Ordinary dividends: $2,780 (reported on 16.1% of returns)
Here:
$2,780
State:
$10,949
(% of AGI for various income ranges: 102.0% for AGIs $25k-50k, 293.3% for AGIs $100k-200k)
Net capital gain/loss in AGI: +$7,340 (reported on 16.1% of returns)
Here:
+$7,340
State:
+$49,306
(% of AGI for various income ranges: 21.7% for AGIs below $25k, 885.0% for AGIs $50k-75k)
Profit/loss from business: +$13,980 (reported on 16.1% of returns)
Here:
+$13,980
State:
+$15,671
(% of AGI for various income ranges: 530.0% for AGIs below $25k, 952.5% for AGIs $50k-75k)
Taxable individual retirement arrangement distribution: $20,800 (reported on 9.7% of returns)
96047:
$20,800
California:
$23,505
(% of AGI for various income ranges: 1560.0% for AGIs $50k-75k)
Total itemized deductions: $29,700 (reported on 9.7% of returns)
Here:
$29,700
State:
$39,517
(% of AGI for various income ranges: )
Taxes paid: $9,550 (reported on 6.5% of returns)
96047:
$9,550
State:
$8,807
(% of AGI for various income ranges: 477.5% for AGIs $50k-75k)
Earned income credit: $2,125 (reported on 12.9% of returns)
Here:
$2,125
State:
$2,074
(% of AGI for various income ranges: 141.7% for AGIs below $25k)
Percentage of individuals using paid preparers for their 2020 taxes: 90.3%
Here:
90%
State:
92%
(% for various income ranges: 88.9% for AGIs below $25k, 87.5% for AGIs $25k-50k, 80.0% for AGIs $50k-75k, 100.0% for AGIs $75k-100k, 100.0% for AGIs $100k-200k)
Averages for the 2012 tax year for zip code 96047, filed in 2013:
Average Adjusted Gross Income (AGI) in 2012: $49,943 (Individual Income Tax Returns)
Here:
$49,943
State:
$72,726
Salary/wage: $40,581 (reported on 70.3% of returns)
Here:
$40,581
State:
$59,079
(% of AGI for various income ranges: 47.9% for AGIs below $25k, 58.8% for AGIs $25k-50k, 93.5% for AGIs $50k-75k, 55.7% for AGIs $100k-200k)
Taxable interest for individuals: $427 (reported on 40.5% of returns)
This zip code:
$427
California:
$2,146
(% of AGI for various income ranges: 0.3% for AGIs below $25k, 0.3% for AGIs $25k-50k, 0.3% for AGIs $50k-75k, 0.5% for AGIs $100k-200k)
Ordinary dividends: $2,367 (reported on 16.2% of returns)
Here:
$2,367
State:
$9,308
Net capital gain/loss in AGI: +$7,380 (reported on 13.5% of returns)
Here:
+$7,380
State:
+$30,460
Profit/loss from business: +$9,240 (reported on 13.5% of returns)
Here:
+$9,240
State:
+$17,064
Taxable individual retirement arrangement distribution: $9,000 (reported on 8.1% of returns)
96047:
$9,000
California:
$19,557
Total itemized deductions: $20,554 (25% of AGI, reported on 35.1% of returns)
Here:
$20,554
State:
$34,004
Here:
25.3% of AGI
State:
22.7% of AGI
(% of AGI for various income ranges: 14.8% for AGIs $25k-50k, 24.3% for AGIs $50k-75k, 16.3% for AGIs $100k-200k)
Charity contributions: $2,550 (reported on 21.6% of returns)
Here:
$2,550
State:
$4,659
(% of AGI for various income ranges: 1.0% for AGIs $25k-50k, 1.4% for AGIs $50k-75k, 1.5% for AGIs $100k-200k)
Taxes paid: $7,031 (reported on 35.1% of returns)
96047:
$7,031
State:
$14,448
(% of AGI for various income ranges: 2.9% for AGIs $25k-50k, 7.1% for AGIs $50k-75k, 7.2% for AGIs $100k-200k)
Earned income credit: $1,980 (reported on 13.5% of returns)
Here:
$1,980
State:
$2,286
(% of AGI for various income ranges: 6.5% for AGIs below $25k)
Percentage of individuals using paid preparers for their 2012 taxes: 62.2%
Here:
62%
State:
64%
(% for various income ranges: 50.0% for AGIs below $25k, 77.8% for AGIs $25k-50k, 83.3% for AGIs $50k-75k, 80.0% for AGIs $100k-200k)
Averages for the 2004 tax year for zip code 96047, filed in 2005:
Average Adjusted Gross Income (AGI) in 2004: $40,834 (Individual Income Tax Returns)
Here:
$40,834
State:
$58,600
Salary/wage: $35,132 (reported on 75.7% of returns)
Here:
$35,132
State:
$49,455
(% of AGI for various income ranges: 129.6% for AGIs below $10k, 63.2% for AGIs $10k-25k, 68.5% for AGIs $25k-50k, 59.3% for AGIs $50k-75k, 75.8% for AGIs $75k-100k, 59.2% for AGIs over 100k)
Taxable interest for individuals: $1,187 (reported on 46.5% of returns)
This zip code:
$1,187
California:
$2,365
(% of AGI for various income ranges: 2.1% for AGIs below $10k, 1.2% for AGIs $10k-25k, 1.3% for AGIs $25k-50k, 2.3% for AGIs $50k-75k, 1.6% for AGIs $75k-100k, 0.8% for AGIs over 100k)
Taxable dividends: $921 (reported on 19.4% of returns)
Here:
$921
State:
$4,746
(% of AGI for various income ranges: 0.3% for AGIs $10k-25k, 1.0% for AGIs $25k-50k, 0.3% for AGIs $50k-75k, 0.4% for AGIs over 100k)
Net capital gain/loss: +$5,197 (reported on 15.6% of returns)
Here:
+$5,197
State:
+$23,418
(% of AGI for various income ranges: -0.5% for AGIs $10k-25k, 0.4% for AGIs $25k-50k, 6.2% for AGIs $50k-75k, 6.1% for AGIs $75k-100k)
Profit/loss from business: +$16,578 (reported on 21.2% of returns)
Here:
+$16,578
State:
+$16,826
(% of AGI for various income ranges: 24.7% for AGIs below $10k, 11.7% for AGIs $10k-25k, 7.5% for AGIs $25k-50k, 4.1% for AGIs $50k-75k, 13.7% for AGIs over 100k)
Total itemized deductions: $17,677 (25% of AGI, reported on 34.0% of returns)
Here:
$17,677
State:
$28,113
Here:
24.5% of AGI
State:
25.3% of AGI
(% of AGI for various income ranges: 14.2% for AGIs $10k-25k, 13.1% for AGIs $25k-50k, 15.5% for AGIs $50k-75k, 19.8% for AGIs $75k-100k, 14.2% for AGIs over 100k)
Charity contributions deductions: $2,158 (3% of AGI, reported on 29.2% of returns)
Here:
$2,158
State:
$3,923
Here:
2.8% of AGI
State:
3.3% of AGI
(% of AGI for various income ranges: 0.6% for AGIs $10k-25k, 1.2% for AGIs $25k-50k, 3.4% for AGIs $50k-75k, 2.0% for AGIs $75k-100k, 1.0% for AGIs over 100k)
Total tax: $5,990 (reported on 74.7% of returns)
96047:
$5,990
State:
$10,761
(% of AGI for various income ranges: 4.9% for AGIs below $10k, 4.9% for AGIs $10k-25k, 7.1% for AGIs $25k-50k, 8.0% for AGIs $50k-75k, 10.1% for AGIs $75k-100k, 18.4% for AGIs over 100k)
Earned income credit: $1,344 (reported on 16.4% of returns)
Here:
$1,344
State:
$1,763
Percentage of individuals using paid preparers for their 2004 taxes: 62.1%
Here:
62%
State:
66%
(% for various income ranges: 52.0% for AGIs below $10k, 58.6% for AGIs $10k-25k, 61.6% for AGIs $25k-50k, 80.0% for AGIs $50k-75k, 68.0% for AGIs $75k-100k, 67.7% for AGIs over 100k)
Household received Food Stamps/SNAP in the past 12 months: 40 Household did not receive Food Stamps/SNAP in the past 12 months: 326
Women who had a birth in the past 12 months: 7 (7 now married, 0 unmarried) Women who did not have a birth in the past 12 months: 72 (45 now married, 26 unmarried)
Housing units in zip code 96047 with a mortgage: 131 (12 second mortgage, 12 both second mortgage and home equity loan) Median monthly owner costs for units with a mortgage: $1,996 Median monthly owner costs for units without a mortgage: $495
Residents with income below the poverty level in 2022:
This zip code:
19.1%
Whole state:
12.2%
Residents with income below 50% of the poverty level in 2022:
This zip code:
9.0%
Whole state:
6.2%
Median number of rooms in houses and condos:
Here:
4.7
State:
6.0
Median number of rooms in apartments:
Here:
4.3
State:
3.9
Notable locations in this zip code not listed on our city pages
Notable locations in zip code 96047: Selvester Ranch (A), AC Graves Ranch (B), A C Graves Ranch (C), Williams Ranch (D), Whiteman Ranch (E), Ogo State Fire Station (F), Redding Landfill (G), Ono State Fire Station (H), Igo - Ono Volunteer Fire Company Station 50 (I). Display/hide their locations on the map
Rivers and creeks: Crow Creek (A), Doby Creek (B), Ducket Creek (C), Eagle Creek (D), Gimblin Creek (E), Huling Creek (F), Jerusalem Creek (G), Kanaka Creek (H), Moon Fork Cottonwood Creek (I). Display/hide their locations on the map
In group quarters: 10 (-1 institutionalized population)
Size of family households: 159 2-persons, 56 3-persons, 53 4-persons, 6 5-persons, 1 7-or-more-persons
Size of nonfamily households: 78 1-person, 12 3-persons
39 married couples with children.
24 single-parent households (24 men).
94.9% of residents of 96047 zip code speak English at home.
4.5% of residents speak Spanish at home (78% very well, 22% not at all).
0.6% of residents speak Asian or Pacific Island language at home (100% well).
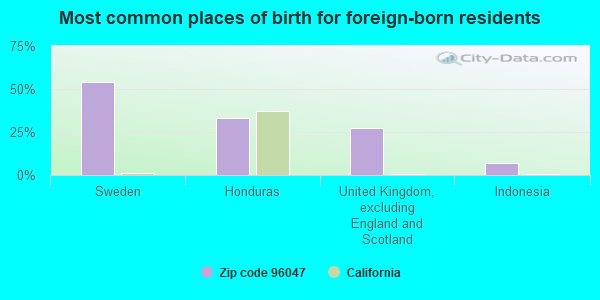
Foreign born population: 70 (8.5%) (45.5% of them are naturalized citizens)
This zip code:
8.5%
Whole state:
26.7%
54%Sweden
33%Honduras
27%United Kingdom, excluding England and Scotland
7%Indonesia
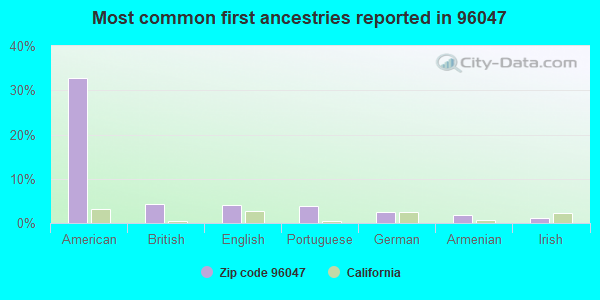
33%American
4%British
4%English
4%Portuguese
3%German
2%Armenian
1%Irish
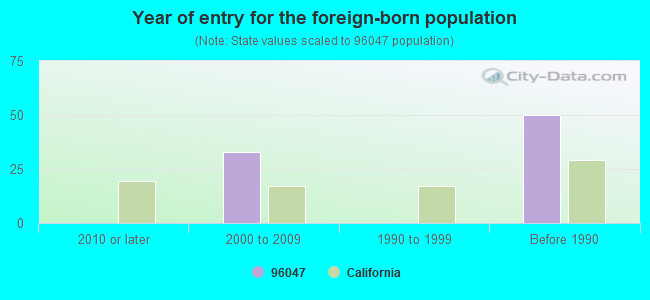
Year of entry for the foreign-born population
02010 or later
332000 to 2009
01990 to 1999
50Before 1990
Public elementary/middle school in in zip code 96047 not listed on the city page:
Facilities with environmental interests located in this zip code:
IGO-ONO ELEMENTARY (6429 PLACER ST. in IGO, CA)
(National Center for Education Statistics) - STATE ID-6050355 Organizations: IGO, ONO, PLATINA UNION ELEMENTARY (SCHOOL DISTRICT)
Housing units lacking complete plumbing facilities: 5.6% Housing units lacking complete kitchen facilities: 3.3%
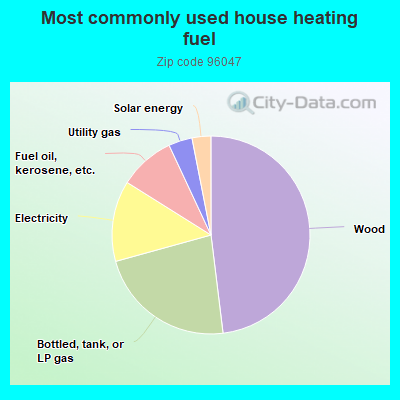
48.4%Wood
22.8%Bottled, tank, or LP gas
13.3%Electricity
9.2%Fuel oil, kerosene, etc.
3.9%Utility gas
3.1%Solar energy
Population in 1990: 205. Population change in the 1990s: +702 (+342.4%).
Place of birth for U.S.-born residents:
This state: 604
Northeast: 7
Midwest: 26
South: 17
West: 90
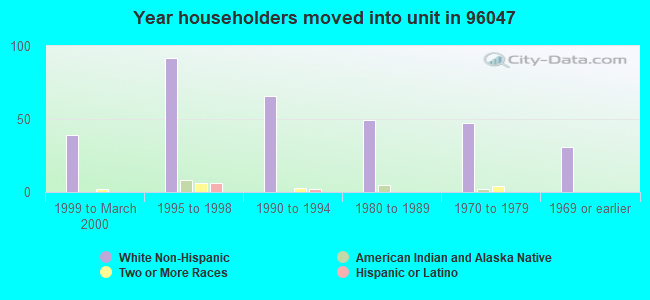
64% of the 96047 zip code residents lived in the same house 5 years ago. Out of people who lived in different houses, 63% lived in this county. Out of people who lived in different counties, 50% lived in California.
99% of the 96047 zip code residents lived in the same house 1 year ago. Out of people who lived in different houses, 27% moved from this county. Out of people who lived in different houses, 100% moved from different county within same state.
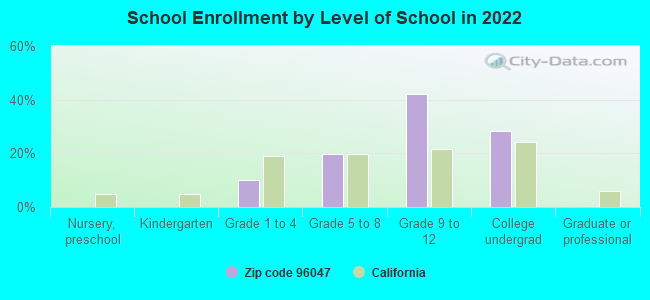
Private vs. public school enrollment:
Students in private schools in grades 1 to 8 (elementary and middle school): 1
Here:
4.2%
California:
10.5%
Students in private schools in grades 9 to 12 (high school):
Here:
0.0%
California:
8.5%
Students in private undergraduate colleges: 3
Here:
17.1%
California:
15.9%
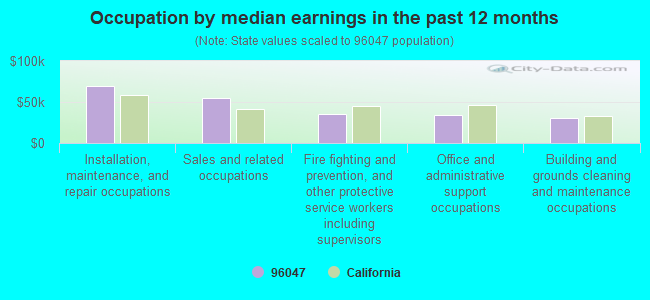
Occupation by median earnings in the past 12 months ($)
69,180Installation, maintenance, and repair occupations
54,689Sales and related occupations
35,596Fire fighting and prevention, and other protective service workers including supervisors
34,218Office and administrative support occupations
30,741Building and grounds cleaning and maintenance occupations
Top industries in this zip code by the number of employees in 2005:
Educational Services: Elementary and Secondary Schools (20-49 employees: 1 establishment)
Administrative and Support and Waste Management and Remediation Services: Landscaping Services (1-4: 2)
Wholesale Trade: General Line Grocery Merchant Wholesalers (1-4: 1)
Other Services (except Public Administration): Cemeteries and Crematories (1-4: 1)
Professional, Scientific, and Technical Services: Landscape Architectural Services (1-4: 1)
Accommodation and Food Services: Bed-and-Breakfast Inns (1-4: 1)
Fatal accident statistics in 2013:
Fatal accident count: 4
Vehicles involved in fatal accidents: 5
Fatal accidents caused by drunken drivers: 3
Fatalities: 4
Persons involved in fatal accidents: 7
Pedestrians involved in fatal accidents: 0
Fatal accident statistics in 2012:
Fatal accident count: 1
Vehicles involved in fatal accidents: 1
Fatal accidents caused by drunken drivers: 1
Fatalities: 1
Persons involved in fatal accidents: 1
Pedestrians involved in fatal accidents: 0
Home Mortgage Disclosure Act Aggregated Statistics For Year 2009 (Based on 2 partial tracts)
A) FHA, FSA/RHS & VA Home Purchase Loans
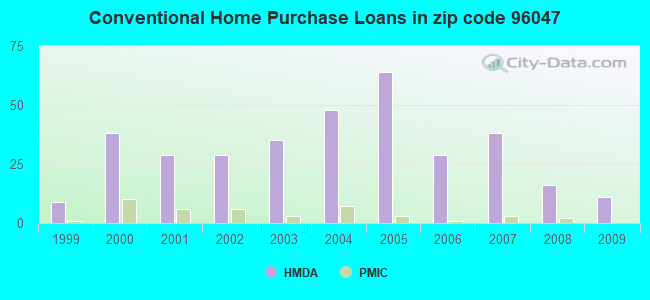
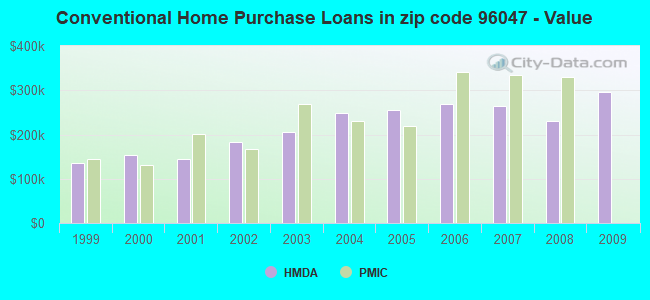
B) Conventional Home Purchase Loans
C) Refinancings
D) Home Improvement Loans
F) Non-occupant Loans on < 5 Family Dwellings (A B C & D)
G) Loans On Manufactured Home Dwelling (A B C & D)
Number
Average Value
Number
Average Value
Number
Average Value
Number
Average Value
Number
Average Value
Number
Average Value
LOANS ORIGINATED
6
$227,627
11
$297,005
64
$238,962
1
$296,760
5
$280,794
5
$108,196
APPLICATIONS APPROVED, NOT ACCEPTED
0
$0
2
$275,270
5
$218,168
0
$0
1
$191,020
1
$75,040
APPLICATIONS DENIED
1
$220,350
1
$85,960
24
$271,146
2
$194,085
1
$343,830
2
$179,080
APPLICATIONS WITHDRAWN
1
$326,770
1
$143,940
20
$264,386
0
$0
1
$176,010
2
$136,100
FILES CLOSED FOR INCOMPLETENESS
0
$0
3
$240,363
6
$246,957
0
$0
1
$284,480
3
$73,450
Aggregated Statistics For Year 2008 (Based on 2 partial tracts)
A) FHA, FSA/RHS & VA Home Purchase Loans
B) Conventional Home Purchase Loans
C) Refinancings
D) Home Improvement Loans
F) Non-occupant Loans on < 5 Family Dwellings (A B C & D)
G) Loans On Manufactured Home Dwelling (A B C & D)
Number
Average Value
Number
Average Value
Number
Average Value
Number
Average Value
Number
Average Value
Number
Average Value
LOANS ORIGINATED
5
$213,120
16
$231,138
33
$245,447
6
$110,630
5
$277,518
1
$101,650
APPLICATIONS APPROVED, NOT ACCEPTED
0
$0
4
$123,820
3
$152,587
0
$0
0
$0
3
$62,990
APPLICATIONS DENIED
0
$0
7
$223,664
15
$279,929
10
$178,805
3
$497,550
5
$116,246
APPLICATIONS WITHDRAWN
0
$0
4
$324,558
8
$263,585
1
$68,220
1
$390,900
1
$68,220
FILES CLOSED FOR INCOMPLETENESS
0
$0
1
$170,550
4
$254,630
1
$88,690
0
$0
1
$75,040
Aggregated Statistics For Year 2007 (Based on 2 partial tracts)
B) Conventional Home Purchase Loans
C) Refinancings
D) Home Improvement Loans
F) Non-occupant Loans on < 5 Family Dwellings (A B C & D)
G) Loans On Manufactured Home Dwelling (A B C & D)
Number
Average Value
Number
Average Value
Number
Average Value
Number
Average Value
Number
Average Value
LOANS ORIGINATED
38
$263,329
58
$253,320
11
$131,913
9
$166,457
12
$109,947
APPLICATIONS APPROVED, NOT ACCEPTED
4
$265,205
10
$247,707
1
$240,130
2
$124,500
2
$166,455
APPLICATIONS DENIED
8
$307,928
29
$270,104
14
$129,911
3
$210,347
10
$115,360
APPLICATIONS WITHDRAWN
3
$309,947
16
$228,239
5
$182,148
2
$259,235
4
$176,008
FILES CLOSED FOR INCOMPLETENESS
3
$270,607
6
$324,387
1
$272,880
0
$0
1
$30,700
Aggregated Statistics For Year 2006 (Based on 2 partial tracts)
B) Conventional Home Purchase Loans
C) Refinancings
D) Home Improvement Loans
F) Non-occupant Loans on < 5 Family Dwellings (A B C & D)
G) Loans On Manufactured Home Dwelling (A B C & D)
Number
Average Value
Number
Average Value
Number
Average Value
Number
Average Value
Number
Average Value
LOANS ORIGINATED
29
$268,575
81
$250,039
18
$137,994
13
$253,726
8
$144,285
APPLICATIONS APPROVED, NOT ACCEPTED
7
$276,681
17
$279,060
5
$79,680
1
$97,550
3
$115,520
APPLICATIONS DENIED
7
$168,114
49
$216,230
14
$146,332
7
$156,906
5
$141,078
APPLICATIONS WITHDRAWN
4
$302,045
27
$277,074
3
$84,820
1
$281,750
1
$225,130
FILES CLOSED FOR INCOMPLETENESS
1
$440,020
10
$198,998
1
$53,890
0
$0
1
$195,790
Aggregated Statistics For Year 2005 (Based on 2 partial tracts)
A) FHA, FSA/RHS & VA Home Purchase Loans
B) Conventional Home Purchase Loans
C) Refinancings
D) Home Improvement Loans
F) Non-occupant Loans on < 5 Family Dwellings (A B C & D)
G) Loans On Manufactured Home Dwelling (A B C & D)
Number
Average Value
Number
Average Value
Number
Average Value
Number
Average Value
Number
Average Value
Number
Average Value
LOANS ORIGINATED
1
$154,180
64
$254,866
96
$219,583
15
$122,114
11
$262,895
12
$149,118
APPLICATIONS APPROVED, NOT ACCEPTED
0
$0
8
$257,957
15
$206,979
2
$126,890
2
$253,780
4
$141,385
APPLICATIONS DENIED
0
$0
15
$277,792
36
$180,120
15
$111,062
1
$884,810
6
$121,318
APPLICATIONS WITHDRAWN
1
$154,180
10
$296,075
38
$176,744
2
$72,315
3
$311,083
4
$96,190
FILES CLOSED FOR INCOMPLETENESS
0
$0
5
$288,298
10
$167,275
1
$73,000
1
$120,750
2
$120,750
Aggregated Statistics For Year 2004 (Based on 2 partial tracts)
A) FHA, FSA/RHS & VA Home Purchase Loans
B) Conventional Home Purchase Loans
C) Refinancings
D) Home Improvement Loans
F) Non-occupant Loans on < 5 Family Dwellings (A B C & D)
G) Loans On Manufactured Home Dwelling (A B C & D)
Number
Average Value
Number
Average Value
Number
Average Value
Number
Average Value
Number
Average Value
Number
Average Value
LOANS ORIGINATED
1
$122,800
48
$248,889
77
$193,630
13
$144,364
8
$167,310
11
$98,919
APPLICATIONS APPROVED, NOT ACCEPTED
0
$0
9
$220,123
28
$192,161
3
$77,997
5
$170,004
3
$130,757
APPLICATIONS DENIED
1
$120,070
10
$266,126
52
$158,559
11
$89,120
1
$119,390
6
$95,508
APPLICATIONS WITHDRAWN
1
$257,190
3
$135,987
37
$160,225
4
$73,165
3
$148,720
1
$149,400
FILES CLOSED FOR INCOMPLETENESS
0
$0
0
$0
9
$244,682
0
$0
0
$0
1
$122,110
Aggregated Statistics For Year 2003 (Based on 2 partial tracts)
A) FHA, FSA/RHS & VA Home Purchase Loans
B) Conventional Home Purchase Loans
C) Refinancings
D) Home Improvement Loans
F) Non-occupant Loans on < 5 Family Dwellings (A B C & D)
Number
Average Value
Number
Average Value
Number
Average Value
Number
Average Value
Number
Average Value
LOANS ORIGINATED
3
$121,887
35
$205,381
192
$182,361
5
$50,482
7
$133,029
APPLICATIONS APPROVED, NOT ACCEPTED
0
$0
9
$190,258
29
$175,372
1
$53,210
5
$134,120
APPLICATIONS DENIED
0
$0
12
$202,158
68
$164,811
10
$28,857
9
$168,352
APPLICATIONS WITHDRAWN
1
$38,890
5
$353,926
47
$161,797
1
$27,290
1
$215,580
FILES CLOSED FOR INCOMPLETENESS
0
$0
2
$234,335
7
$216,744
0
$0
0
$0
Aggregated Statistics For Year 2002 (Based on 2 partial tracts)
A) FHA, FSA/RHS & VA Home Purchase Loans
B) Conventional Home Purchase Loans
C) Refinancings
D) Home Improvement Loans
F) Non-occupant Loans on < 5 Family Dwellings (A B C & D)
Number
Average Value
Number
Average Value
Number
Average Value
Number
Average Value
Number
Average Value
LOANS ORIGINATED
5
$106,968
29
$182,806
129
$173,797
5
$41,888
8
$130,726
APPLICATIONS APPROVED, NOT ACCEPTED
1
$206,710
8
$133,285
17
$149,964
3
$105,740
0
$0
APPLICATIONS DENIED
1
$124,840
6
$154,405
30
$153,040
4
$27,458
1
$78,450
APPLICATIONS WITHDRAWN
1
$79,140
5
$217,076
32
$140,491
1
$72,310
0
$0
FILES CLOSED FOR INCOMPLETENESS
0
$0
1
$81,180
9
$157,437
0
$0
0
$0
Aggregated Statistics For Year 2001 (Based on 2 partial tracts)
A) FHA, FSA/RHS & VA Home Purchase Loans
B) Conventional Home Purchase Loans
C) Refinancings
D) Home Improvement Loans
F) Non-occupant Loans on < 5 Family Dwellings (A B C & D)
Number
Average Value
Number
Average Value
Number
Average Value
Number
Average Value
Number
Average Value
LOANS ORIGINATED
4
$115,292
29
$145,638
83
$144,339
5
$24,286
6
$117,225
APPLICATIONS APPROVED, NOT ACCEPTED
0
$0
8
$175,155
12
$99,317
1
$81,860
1
$143,260
APPLICATIONS DENIED
0
$0
10
$142,853
33
$116,863
4
$25,922
3
$101,193
APPLICATIONS WITHDRAWN
1
$119,390
3
$129,847
20
$102,126
0
$0
1
$68,220
FILES CLOSED FOR INCOMPLETENESS
0
$0
1
$57,990
5
$213,528
1
$35,470
1
$750,420
Aggregated Statistics For Year 2000 (Based on 2 partial tracts)
A) FHA, FSA/RHS & VA Home Purchase Loans
B) Conventional Home Purchase Loans
C) Refinancings
D) Home Improvement Loans
F) Non-occupant Loans on < 5 Family Dwellings (A B C & D)
Number
Average Value
Number
Average Value
Number
Average Value
Number
Average Value
Number
Average Value
LOANS ORIGINATED
3
$111,653
38
$154,034
28
$115,950
8
$24,645
3
$111,653
APPLICATIONS APPROVED, NOT ACCEPTED
0
$0
10
$118,157
5
$78,316
5
$25,242
2
$141,215
APPLICATIONS DENIED
2
$95,850
12
$98,067
12
$152,528
4
$88,345
3
$92,097
APPLICATIONS WITHDRAWN
0
$0
4
$113,588
7
$109,250
3
$20,010
1
$44,340
FILES CLOSED FOR INCOMPLETENESS
0
$0
0
$0
1
$105,740
0
$0
0
$0
Aggregated Statistics For Year 1999 (Based on 1 partial tract)
Detailed PMIC statistics for the following Tracts:0124.00
2005 - 2018 National Fire Incident Reporting System (NFIRS) incidents
Based on the data from the years 2005 - 2018 the average number of fires per year is 20. The highest number of fires - 85 took place in 2013, and the least - 3 in 2005. The data has an increasing trend.
When looking into fire subcategories, the most incidents belonged to: Outside Fires (54.2%), and Structure Fires (37.7%).
Fire incident types reported to NFIRS in Zip Code 96047


 Nearest zip codes: 96087, 96024, 96001, 96022, 96076, 96052.


 (Students: 46, Location: 6429 PLACER ST., Grades: KG-8)

 Based on the data from the years 2005 - 2018 the average number of fires per year is 20. The highest number of fires - 85 took place in 2013, and the least - 3 in 2005. The data has an increasing trend.
 When looking into fire subcategories, the most incidents belonged to: Outside Fires (54.2%), and Structure Fires (37.7%).