Estimated zip code population in 2022: 4,417 Zip code population in 2010: 4,530 Zip code population in 2000: 6,526
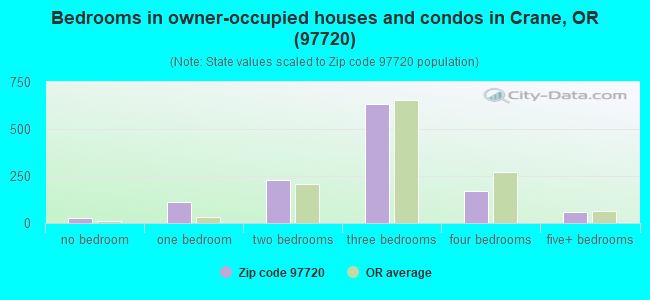
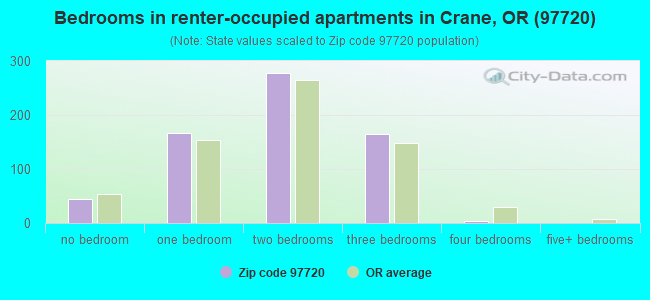
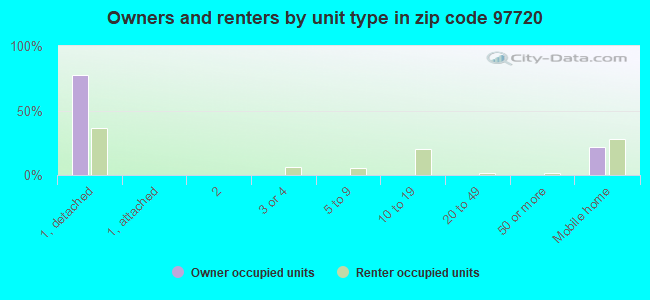
Houses and condos: 2,226 Renter-occupied apartments: 657
% of renters here:
35%
State:
37%
March 2022 cost of living index in zip code 97720: 84.9 (less than average, U.S. average is 100)
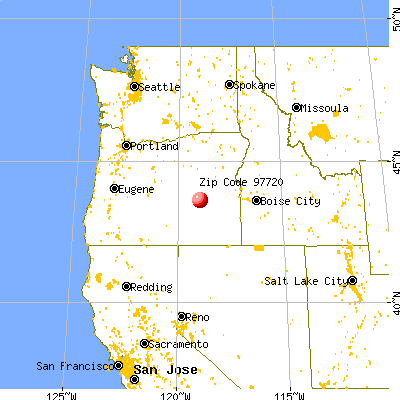
Land area: 1034.1 sq. mi. Water area: 76.6 sq. mi.
Population density: 4 people per square mile
(very low).
OSM Map
General Map
Google Map
MSN Map
OSM Map
General Map
Google Map
MSN Map
OSM Map
General Map
Google Map
MSN Map
OSM Map
General Map
Google Map
MSN Map
Please wait while loading the map...
Real estate property taxes paid for housing units in 2022:
This zip code:
0.9% ($1,574)
Oregon:
0.8% ($3,646)
Median real estate property taxes paid for housing units with mortgages in 2022: $1,857 (1.0%) Median real estate property taxes paid for housing units with no mortgage in 2022: $1,194 (0.9%)
Averages for the 2020 tax year for zip code 97720, filed in 2021:
Average Adjusted Gross Income (AGI) in 2020: $43,924 (Individual Income Tax Returns)
Here:
$43,924
State:
$76,001
Salary/wage: $39,832 (reported on 76.7% of returns)
Here:
$39,832
State:
$61,959
(% of AGI for various income ranges: 1388.3% for AGIs below $25k, 3815.9% for AGIs $25k-50k, 7483.3% for AGIs $50k-75k, 9521.1% for AGIs $75k-100k, 18395.6% for AGIs $100k-200k)
Taxable interest for individuals: $2,080 (reported on 28.6% of returns)
This zip code:
$2,080
Oregon:
$1,628
(% of AGI for various income ranges: 25.5% for AGIs below $25k, 31.5% for AGIs $25k-50k, 90.7% for AGIs $50k-75k, 141.1% for AGIs $75k-100k, 685.6% for AGIs $100k-200k)
Ordinary dividends: $2,713 (reported on 12.2% of returns)
Here:
$2,713
State:
$7,165
(% of AGI for various income ranges: 20.0% for AGIs below $25k, 28.7% for AGIs $25k-50k, 41.3% for AGIs $50k-75k, 174.4% for AGIs $75k-100k, 221.1% for AGIs $100k-200k)
Net capital gain/loss in AGI: +$10,571 (reported on 14.8% of returns)
Here:
+$10,571
State:
+$23,403
(% of AGI for various income ranges: 11.9% for AGIs below $25k, 142.6% for AGIs $25k-50k, 264.0% for AGIs $50k-75k, 641.1% for AGIs $75k-100k, 1527.8% for AGIs $100k-200k)
Profit/loss from business: +$9,343 (reported on 15.9% of returns)
Here:
+$9,343
State:
+$16,511
(% of AGI for various income ranges: 118.5% for AGIs below $25k, 172.8% for AGIs $25k-50k, 382.7% for AGIs $50k-75k, 464.4% for AGIs $75k-100k, 644.4% for AGIs $100k-200k)
Taxable individual retirement arrangement distribution: $14,040 (reported on 7.9% of returns)
97720:
$14,040
Oregon:
$20,730
(% of AGI for various income ranges: 63.4% for AGIs below $25k, 61.3% for AGIs $25k-50k, 471.3% for AGIs $50k-75k, 957.8% for AGIs $100k-200k)
Total itemized deductions: $24,814 (reported on 3.7% of returns)
Here:
$24,814
State:
$31,050
(% of AGI for various income ranges: 700.0% for AGIs $50k-75k, 763.3% for AGIs $100k-200k)
Charity contributions: $9,460 (reported on 2.6% of returns)
Here:
$9,460
State:
$8,791
(% of AGI for various income ranges: 168.7% for AGIs $50k-75k, 244.4% for AGIs $100k-200k)
Taxes paid: $6,314 (reported on 3.7% of returns)
97720:
$6,314
State:
$8,487
(% of AGI for various income ranges: 164.7% for AGIs $50k-75k, 216.7% for AGIs $100k-200k)
Earned income credit: $2,333 (reported on 20.6% of returns)
Here:
$2,333
State:
$1,977
(% of AGI for various income ranges: 111.3% for AGIs below $25k, 99.2% for AGIs $25k-50k)
Percentage of individuals using paid preparers for their 2020 taxes: 94.2%
Here:
94%
State:
93%
(% for various income ranges: 94.6% for AGIs below $25k, 94.5% for AGIs $25k-50k, 92.3% for AGIs $50k-75k, 93.3% for AGIs $75k-100k, 94.7% for AGIs $100k-200k)
Averages for the 2012 tax year for zip code 97720, filed in 2013:
Average Adjusted Gross Income (AGI) in 2012: $37,934 (Individual Income Tax Returns)
Here:
$37,934
State:
$57,845
Salary/wage: $33,105 (reported on 77.5% of returns)
Here:
$33,105
State:
$47,723
(% of AGI for various income ranges: 71.0% for AGIs below $25k, 74.2% for AGIs $25k-50k, 70.1% for AGIs $50k-75k, 72.0% for AGIs $75k-100k, 54.6% for AGIs $100k-200k)
Taxable interest for individuals: $2,511 (reported on 32.5% of returns)
This zip code:
$2,511
Oregon:
$1,848
(% of AGI for various income ranges: 3.0% for AGIs below $25k, 1.8% for AGIs $25k-50k, 1.4% for AGIs $50k-75k, 1.2% for AGIs $75k-100k, 3.2% for AGIs $100k-200k)
Ordinary dividends: $2,638 (reported on 14.2% of returns)
Here:
$2,638
State:
$5,987
(% of AGI for various income ranges: 1.8% for AGIs below $25k, 1.2% for AGIs $25k-50k, 0.8% for AGIs $50k-75k, 0.6% for AGIs $75k-100k, 0.7% for AGIs $100k-200k)
Net capital gain/loss in AGI: +$13,377 (reported on 17.8% of returns)
Here:
+$13,377
State:
+$13,095
(% of AGI for various income ranges: 1.8% for AGIs below $25k, 2.2% for AGIs $25k-50k, 2.2% for AGIs $50k-75k, 4.9% for AGIs $75k-100k, 17.3% for AGIs $100k-200k)
Profit/loss from business: +$4,272 (reported on 17.2% of returns)
Here:
+$4,272
State:
+$13,871
(% of AGI for various income ranges: 6.2% for AGIs below $25k, 2.0% for AGIs $25k-50k, 1.2% for AGIs $50k-75k, 1.5% for AGIs $75k-100k)
Taxable individual retirement arrangement distribution: $8,032 (reported on 11.2% of returns)
97720:
$8,032
Oregon:
$16,036
(% of AGI for various income ranges: 4.7% for AGIs below $25k, 2.3% for AGIs $25k-50k, 1.8% for AGIs $50k-75k, 4.8% for AGIs $75k-100k)
Total itemized deductions: $17,043 (26% of AGI, reported on 24.9% of returns)
Here:
$17,043
State:
$24,430
Here:
26.1% of AGI
State:
23.2% of AGI
(% of AGI for various income ranges: 11.5% for AGIs below $25k, 9.0% for AGIs $25k-50k, 12.0% for AGIs $50k-75k, 14.5% for AGIs $75k-100k, 10.2% for AGIs $100k-200k)
Charity contributions: $3,448 (reported on 17.2% of returns)
Here:
$3,448
State:
$3,648
(% of AGI for various income ranges: 1.4% for AGIs below $25k, 1.3% for AGIs $25k-50k, 1.7% for AGIs $50k-75k, 2.3% for AGIs $75k-100k, 1.3% for AGIs $100k-200k)
Taxes paid: $5,644 (reported on 24.3% of returns)
97720:
$5,644
State:
$10,269
(% of AGI for various income ranges: 1.9% for AGIs below $25k, 2.1% for AGIs $25k-50k, 3.5% for AGIs $50k-75k, 5.5% for AGIs $75k-100k, 5.1% for AGIs $100k-200k)
Earned income credit: $2,183 (reported on 24.9% of returns)
Here:
$2,183
State:
$2,021
(% of AGI for various income ranges: 6.8% for AGIs below $25k, 1.4% for AGIs $25k-50k)
Percentage of individuals using paid preparers for their 2012 taxes: 52.7%
Here:
53%
State:
47%
(% for various income ranges: 43.0% for AGIs below $25k, 55.0% for AGIs $25k-50k, 63.6% for AGIs $50k-75k, 72.7% for AGIs $75k-100k, 80.0% for AGIs $100k-200k)
Averages for the 2004 tax year for zip code 97720, filed in 2005:
Average Adjusted Gross Income (AGI) in 2004: $28,207 (Individual Income Tax Returns)
Here:
$28,207
State:
$46,788
Salary/wage: $28,159 (reported on 78.1% of returns)
Here:
$28,159
State:
$39,788
(% of AGI for various income ranges: 75.0% for AGIs $10k-25k, 80.7% for AGIs $25k-50k, 76.4% for AGIs $50k-75k, 73.8% for AGIs $75k-100k, 53.2% for AGIs over 100k)
Taxable interest for individuals: $2,100 (reported on 46.1% of returns)
This zip code:
$2,100
Oregon:
$2,126
(% of AGI for various income ranges: 4.2% for AGIs $10k-25k, 2.9% for AGIs $25k-50k, 2.7% for AGIs $50k-75k, 1.8% for AGIs $75k-100k, 1.6% for AGIs over 100k)
Taxable dividends: $1,557 (reported on 17.3% of returns)
Here:
$1,557
State:
$3,427
(% of AGI for various income ranges: 1.1% for AGIs $10k-25k, 1.1% for AGIs $25k-50k, 0.7% for AGIs $50k-75k, 0.8% for AGIs $75k-100k, 0.3% for AGIs over 100k)
Net capital gain/loss: +$8,801 (reported on 20.2% of returns)
Here:
+$8,801
State:
+$12,447
(% of AGI for various income ranges: 5.8% for AGIs $10k-25k, 1.6% for AGIs $25k-50k, 3.9% for AGIs $50k-75k, 5.2% for AGIs $75k-100k, 20.9% for AGIs over 100k)
Profit/loss from business: +$3,469 (reported on 20.3% of returns)
Here:
+$3,469
State:
+$11,682
(% of AGI for various income ranges: 4.4% for AGIs $10k-25k, 2.2% for AGIs $25k-50k, -0.2% for AGIs $50k-75k, -0.1% for AGIs $75k-100k, 1.6% for AGIs over 100k)
IRA payment deduction: $3,228 (reported on 3.3% of returns)
97720:
$3,228
Oregon:
$3,035
Total itemized deductions: $14,685 (28% of AGI, reported on 25.8% of returns)
Here:
$14,685
State:
$20,209
Here:
27.6% of AGI
State:
24.7% of AGI
(% of AGI for various income ranges: 9.3% for AGIs $10k-25k, 12.6% for AGIs $25k-50k, 14.2% for AGIs $50k-75k, 16.0% for AGIs $75k-100k, 12.1% for AGIs over 100k)
Charity contributions deductions: $2,718 (5% of AGI, reported on 19.8% of returns)
Here:
$2,718
State:
$3,145
Here:
4.8% of AGI
State:
3.6% of AGI
(% of AGI for various income ranges: 1.2% for AGIs $10k-25k, 1.6% for AGIs $25k-50k, 2.0% for AGIs $50k-75k, 3.0% for AGIs $75k-100k, 2.2% for AGIs over 100k)
Total tax: $3,326 (reported on 67.3% of returns)
97720:
$3,326
State:
$7,148
(% of AGI for various income ranges: 3.7% for AGIs $10k-25k, 5.9% for AGIs $25k-50k, 8.1% for AGIs $50k-75k, 10.2% for AGIs $75k-100k, 14.7% for AGIs over 100k)
Earned income credit: $1,753 (reported on 19.5% of returns)
Here:
$1,753
State:
$1,605
Percentage of individuals using paid preparers for their 2004 taxes: 69.8%
Here:
70%
State:
53%
(% for various income ranges: 68.8% for AGIs below $10k, 69.6% for AGIs $10k-25k, 68.4% for AGIs $25k-50k, 70.3% for AGIs $50k-75k, 80.3% for AGIs $75k-100k, 79.1% for AGIs over 100k)
Household received Food Stamps/SNAP in the past 12 months: 541 Household did not receive Food Stamps/SNAP in the past 12 months: 1,372
Women who had a birth in the past 12 months: 26 (22 now married, 3 unmarried) Women who did not have a birth in the past 12 months: 812 (346 now married, 464 unmarried)
Housing units in zip code 97720 with a mortgage: 675 (70 second mortgage, 70 both second mortgage and home equity loan) Houses without a mortgage: 15
Median monthly owner costs for units with a mortgage: $1,100 Median monthly owner costs for units without a mortgage: $444
Residents with income below the poverty level in 2022:
This zip code:
11.3%
Whole state:
12.1%
Residents with income below 50% of the poverty level in 2022:
This zip code:
7.1%
Whole state:
6.2%
Median number of rooms in houses and condos:
Here:
5.7
State:
6.2
Median number of rooms in apartments:
Here:
3.6
State:
4.0
Notable locations in this zip code not listed on our city pages
Notable locations in zip code 97720: Idlewild Recreation Site (A), Island Ranch (B), Hamilton Ranch (C), H and Y Cabin (D), Ring Mountain Lookout (E), Call Meadow Forest Service Facility (F), Cross Ranch (G), Boy Scout Cabin (H), Hayes Ranch (I), Buchanan Ranch (J), Buchanan Springs Safety Rest Area (K), Old Horton Mill (L), Dickenson Ranch (M), Purdy Ranch (N), Crow Flat Guard Station (O), Temple Ranch (P), Nelson Ranch (Q), Hardesty Ranch (R), Old Graham Homestead (S), Jameson Ranch (T). Display/hide their locations on the map
Cemeteries: Saddle Butte Cemetery (1), Burns Cemetery (2), Paiute Cemetery II (3), Windy Point Cemetery (4), Sunset Valley Cemetery (5), Harney Cemetery (6). Display/hide their locations on the map
Lakes and reservoirs: Howell Lake (A), Malheur Lake (B), Malheur Slough (C), McDonald Waterhole (D), Bennett Lake (E), Vickers Lake (F), Angle Reservoir (G), Aspen Reservoir (H). Display/hide their locations on the map
Streams, rivers, and creeks: Lake Creek (A), Slickear Creek (B), Fuqua Creek (C), Emigrant Creek (D), East Creek (E), North Fork Trout Creek (F), Cow Creek (G), Coffeepot Creek (H), Camp Creek (I). Display/hide their locations on the map
Parks in zip code 97720 include: Triangle City Park (1), Washington City Park (2), Malheur National Wildlife Refuge (3), Great Basin Historical Marker (4). Display/hide their locations on the map
In group quarters: 86 (-1 institutionalized population)
Size of family households: 683 2-persons, 147 3-persons, 74 4-persons, 156 5-persons, 12 6-persons, 41 7-or-more-persons
Size of nonfamily households: 610 1-person, 155 2-persons, 11 4-persons
474 married couples with children.
176 single-parent households (75 men, 101 women).
94.8% of residents of 97720 zip code speak English at home.
3.6% of residents speak Spanish at home (79% very well, 11% well, 10% not well).
0.7% of residents speak other Indo-European language at home (71% very well, 29% well).
0.3% of residents speak Asian or Pacific Island language at home (100% very well).
0.8% of residents speak other language at home (100% very well).
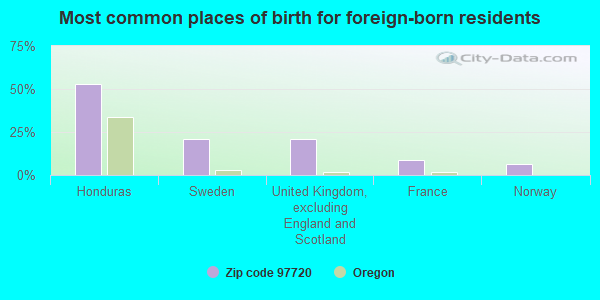
Foreign born population: 115 (2.6%) (22.5% of them are naturalized citizens)
This zip code:
2.6%
Whole state:
9.9%
53%Honduras
21%Sweden
21%United Kingdom, excluding England and Scotland
9%France
6%Norway
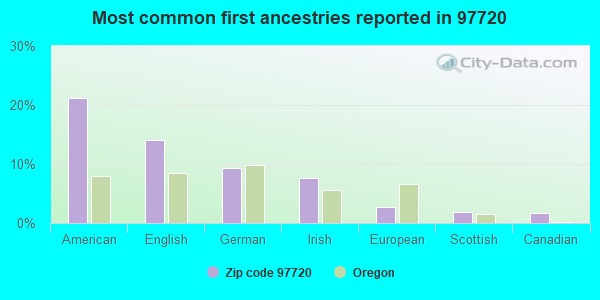
21%American
14%English
9%German
8%Irish
3%European
2%Scottish
2%Canadian
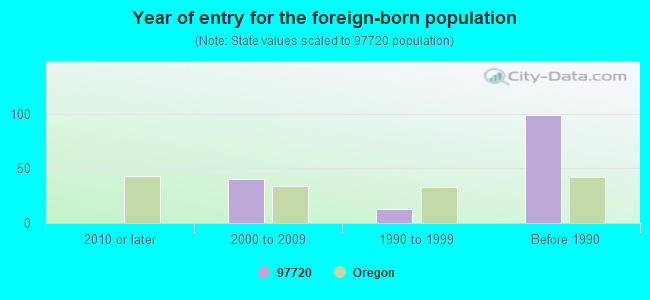
Year of entry for the foreign-born population
02010 or later
402000 to 2009
131990 to 1999
99Before 1990
Facilities with environmental interests located in this zip code:
BURNS / HINES DISPOSAL SITE (WEST MONROE, SEC14,T23S,R30E in BURNS, OR)
CRITERIA AND HAZARDOUS AIR POLLUTANT INVENTORY (Inventory of air pollution sources) STATE MASTER (Oregon inspections and permits database) - OR-SWMS-104066A179, REFUSE DISPOSAL Business SIC classification: REFUSE SYSTEMS Business NAICS classification: SOLID WASTE LANDFILL.
BURNS HIGH SCHOOL (1100 OREGON AVE in BURNS, OR)
(National Center for Education Statistics) - STATE ID-359 Organizations: HARNEY COUNTY SCH DIST 3 (SCHOOL DISTRICT)
HENRY SLATER ELEM. SCHOOL (800 N FAIRVIEW AVE in BURNS, OR)
(National Center for Education Statistics) - STATE ID-342 Organizations: HARNEY COUNTY SCH DIST 3 (SCHOOL DISTRICT)
BURNS PAIUTE DRINKING WATER SYS (HC-71 100 PASIGO ST in BURNS, OR) . Tribal Land
(Integrated Compliance Information System) - ICIS-10-2001-0167, FORMAL ENFORCEMENT ACTION, Business SIC classification: WATER SUPPLY
EASTERN OREGON AG EXP CTR SQUA (HWY 205 MP4.51 in BURNS, OR)
(Resource Conservation and Recovery Act (tracking hazardous waste)) Organizations: EASTERN OREGON AG EXP CTR SQUAW BUTTE (CONTACT/OPERATOR)
, OREGON STATE UNIVERSITY (CONTACT/OWNER)
Alternative names: EASTERN OREGON AG EXP CTR SQUAW BUTTE
CHEVRON USA INC BURNS BULK PLT (429 E CRANE in BURNS, OR)
(Resource Conservation and Recovery Act (tracking hazardous waste))
CHARLIE WILLIAMS PROPERTY (71415 WEST LOOP ROAD in BURNS, OR)
(Resource Conservation and Recovery Act (tracking hazardous waste))
DAVE MILLER (69326 CRANE BUCHANON ROAD in BURNS, OR)
(Resource Conservation and Recovery Act (tracking hazardous waste))
BURNS AIRFORCE RANGE (T23S R30E SEC 20 WM in BURNS, OR)
SUPERFUND (Superfund database)
HARNEY CO SD 3 (458 E WASHINGTON in BURNS, OR)
COMPLIANCE ACTIVITY (Tracking inspections of insecticide, fungicide, and rodenticide, and toxic substances)
HARNEY ELECTRIC COOP (1326 HINES RD in BURNS, OR)
COMPLIANCE ACTIVITY (Tracking inspections of insecticide, fungicide, and rodenticide, and toxic substances)
Housing units lacking complete plumbing facilities: 3.7% Housing units lacking complete kitchen facilities: 5.4%
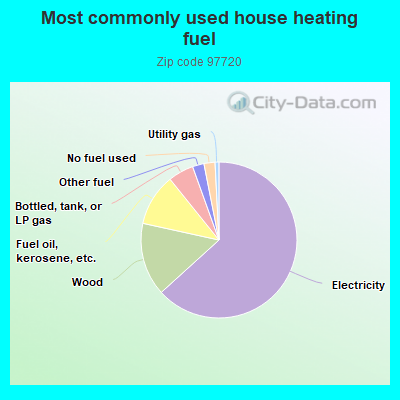
63.4%Electricity
15.2%Wood
10.8%Fuel oil, kerosene, etc.
5.3%Bottled, tank, or LP gas
2.4%Other fuel
2.3%No fuel used
0.8%Utility gas
Population in 1990: 5,844. Population change in the 1990s: +682 (+11.7%).
Place of birth for U.S.-born residents:
This state: 2,510
Northeast: 83
Midwest: 442
South: 91
West: 1,114
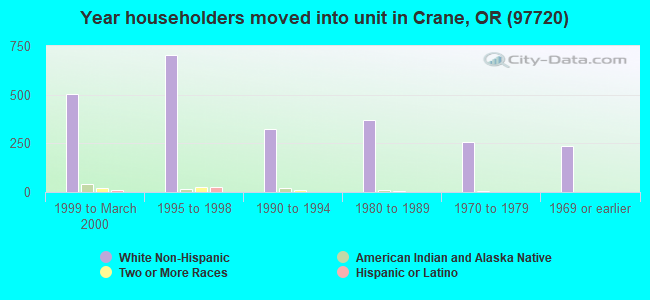
46% of the 97720 zip code residents lived in the same house 5 years ago. Out of people who lived in different houses, 47% lived in this county. Out of people who lived in different counties, 50% lived in Oregon.
88% of the 97720 zip code residents lived in the same house 1 year ago. Out of people who lived in different houses, 42% moved from this county. Out of people who lived in different houses, 33% moved from different county within same state. Out of people who lived in different houses, 24% moved from different state. Out of people who lived in different houses, 3% moved from abroad.
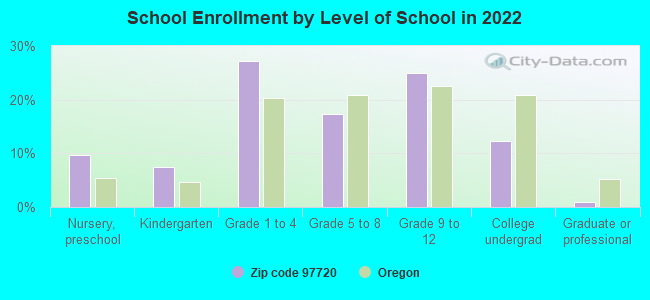
Private vs. public school enrollment:
Students in private schools in grades 1 to 8 (elementary and middle school): 57
Here:
16.1%
Oregon:
13.7%
Students in private schools in grades 9 to 12 (high school): 20
Here:
9.9%
Oregon:
8.8%
Students in private undergraduate colleges: 62
Here:
62.6%
Oregon:
17.7%
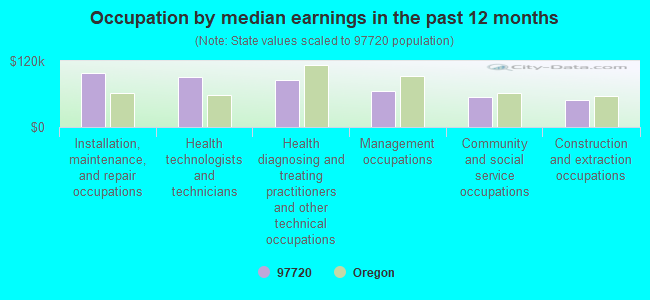
Occupation by median earnings in the past 12 months ($)
98,329Installation, maintenance, and repair occupations
91,111Health technologists and technicians
84,631Health diagnosing and treating practitioners and other technical occupations
66,096Management occupations
54,700Community and social service occupations
48,207Construction and extraction occupations
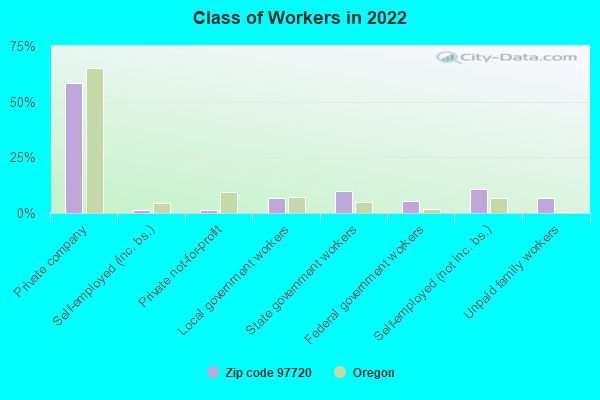
Companies with federal contracts located in this zip code:
TOM SAMS (1821 PENNY LN in BURNS, OR; small business) : $3,000 in 2 contractsfrom 1999 to 2000
$2,000 with Bureau of Land Management for Construction of Structures and Facilities -- Unimproved Real Property (Land). Signed on 1999-12-15. Completion date: 1999-12-15.
$1,000, same as above.Signed on 2000-01-15. Completion date: 1999-12-15.
Top industries in this zip code by the number of employees in 2005:
Health Care and Social Assistance: General Medical and Surgical Hospitals (100-249 employees: 1 establishment)
Administrative and Support and Waste Management and Remediation Services: Temporary Help Services (20-49: 1)
People in group quarters in 2010:
50 people in correctional facilities intended for juveniles
17 people in local jails and other municipal confinement facilities
14 people in nursing facilities/skilled-nursing facilities
8 people in emergency and transitional shelters (with sleeping facilities) for people experiencing homelessness
People in group quarters in 2000:
55 people in nursing homes
45 people in training schools for juvenile delinquents
19 people in other group homes
14 people in local jails and other confinement facilities (including police lockups)
12 people in other noninstitutional group quarters
6 people in hospitals or wards for drug/alcohol abuse
2 people in other nonhousehold living situations
Fatal accident statistics in 2013:
Fatal accident count: 1
Vehicles involved in fatal accidents: 1
Fatal accidents caused by drunken drivers: 0
Fatalities: 1
Persons involved in fatal accidents: 1
Pedestrians involved in fatal accidents: 1
Fatal accident statistics in 2012:
Fatal accident count: 2
Vehicles involved in fatal accidents: 2
Fatal accidents caused by drunken drivers: 1
Fatalities: 2
Persons involved in fatal accidents: 2
Pedestrians involved in fatal accidents: 0
2002 - 2018 National Fire Incident Reporting System (NFIRS) incidents
According to the data from the years 2002 - 2018 the average number of fire incidents per year is 21. The highest number of reported fires - 36 took place in 2009, and the least - 3 in 2004. The data has a declining trend.
When looking into fire subcategories, the most reports belonged to: Structure Fires (47.8%), and Outside Fires (36.3%).
Fire incident types reported to NFIRS in Zip Code 97720


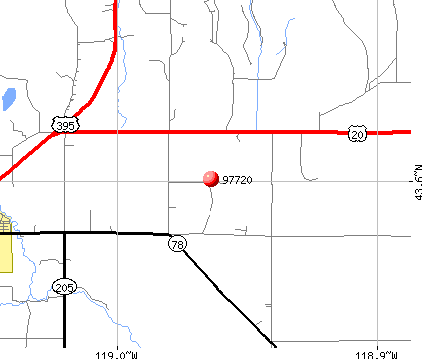 Nearest zip codes: 97738, 97904, 97732, 97873, 97722, 97820.


 According to the data from the years 2002 - 2018 the average number of fire incidents per year is 21. The highest number of reported fires - 36 took place in 2009, and the least - 3 in 2004. The data has a declining trend.
 When looking into fire subcategories, the most reports belonged to: Structure Fires (47.8%), and Outside Fires (36.3%).