Estimated zip code population in 2022: 51,420
Zip code population in 2010: 47,510
Zip code population in 2000: 47,572
Houses and condos: 19,472
Renter-occupied apartments: 6,316
% of renters here:
34%State:
36%
March 2022 cost of living index in zip code 98023: 111.7
(more than average, U.S. average is 100)
Land area: 10.3
sq. mi.
Water area: 1.4
sq. mi.
Population density: 4,986 people per square mile (average).
OSM Map
General Map
Google Map
MSN Map
OSM Map
General Map
Google Map
MSN Map
OSM Map
General Map
Google Map
MSN Map
OSM Map
General Map
Google Map
MSN Map
Please wait while loading the map...
Real estate property taxes paid for housing units in 2022:
This zip code:
0.8% ($4,596)Washington:
0.8% ($4,283)
Median real estate property taxes paid for housing units with mortgages in 2022: $4,436 (0.8%)
Median real estate property taxes paid for housing units with no mortgage in 2022: $4,914 (0.9%)
Profiles of local businesses
Business Search - 14 Million verified businesses
Males: 26,330 Females: 25,090
For population 25 years and over in 98023:
High school or higher: 92.1%Bachelor's degree or higher: 34.5%Graduate or professional degree: 11.2%Unemployed: 4.4%Mean travel time to work (commute): 33.7 minutes
For population 15 years and over in 98023:
Never married: 35.5%Now married: 50.9%Separated: 1.1%Widowed: 4.0%Divorced: 8.5%
Zip code 98023 compared to state average:
Black race population percentage significantly above state average. Foreign-born population percentage above state average. Length of stay since moving in significantly above state average. 22,059 42.9% White 7,874 15.3% Hispanic or Latino 7,644 14.9% Asian 7,012 13.6% Black 4,326 8.4% Two or more races 1,571 3.1% Native Hawaiian and Other 496 1.0% Some other race 435 0.8% American Indian
Data:
Median household income ($)
Median household income (% change since 2000)
Household income diversity
Ratio of average income to average house value (%)
Ratio of average income to average rent
Median household income ($) - White
Median household income ($) - Black or African American
Median household income ($) - Asian
Median household income ($) - Hispanic or Latino
Median household income ($) - American Indian and Alaska Native
Median household income ($) - Multirace
Median household income ($) - Other Race
Median household income for houses/condos with a mortgage ($)
Median household income for apartments without a mortgage ($)
Races - White alone (%)
Races - White alone (% change since 2000)
Races - Black alone (%)
Races - Black alone (% change since 2000)
Races - American Indian alone (%)
Races - American Indian alone (% change since 2000)
Races - Asian alone (%)
Races - Asian alone (% change since 2000)
Races - Hispanic (%)
Races - Hispanic (% change since 2000)
Races - Native Hawaiian and Other Pacific Islander alone (%)
Races - Native Hawaiian and Other Pacific Islander alone (% change since 2000)
Races - Two or more races (%)
Races - Two or more races (% change since 2000)
Races - Other race alone (%)
Races - Other race alone (% change since 2000)
Racial diversity
Unemployment (%)
Unemployment (% change since 2000)
Unemployment (%) - White
Unemployment (%) - Black or African American
Unemployment (%) - Asian
Unemployment (%) - Hispanic or Latino
Unemployment (%) - American Indian and Alaska Native
Unemployment (%) - Multirace
Unemployment (%) - Other Race
Population density (people per square mile)
Population - Males (%)
Population - Females (%)
Population - Males (%) - White
Population - Males (%) - Black or African American
Population - Males (%) - Asian
Population - Males (%) - Hispanic or Latino
Population - Males (%) - American Indian and Alaska Native
Population - Males (%) - Multirace
Population - Males (%) - Other Race
Population - Females (%) - White
Population - Females (%) - Black or African American
Population - Females (%) - Asian
Population - Females (%) - Hispanic or Latino
Population - Females (%) - American Indian and Alaska Native
Population - Females (%) - Multirace
Population - Females (%) - Other Race
Coronavirus confirmed cases (Apr 24, 2024)
Deaths caused by coronavirus (Apr 24, 2024)
Coronavirus confirmed cases (per 100k population) (Apr 24, 2024)
Deaths caused by coronavirus (per 100k population) (Apr 24, 2024)
Daily increase in number of cases (Apr 24, 2024)
Weekly increase in number of cases (Apr 24, 2024)
Cases doubled (in days) (Apr 24, 2024)
Hospitalized patients (Apr 18, 2022)
Negative test results (Apr 18, 2022)
Total test results (Apr 18, 2022)
COVID Vaccine doses distributed (per 100k population) (Sep 19, 2023)
COVID Vaccine doses administered (per 100k population) (Sep 19, 2023)
COVID Vaccine doses distributed (Sep 19, 2023)
COVID Vaccine doses administered (Sep 19, 2023)
Likely homosexual households (%)
Likely homosexual households (% change since 2000)
Likely homosexual households - Lesbian couples (%)
Likely homosexual households - Lesbian couples (% change since 2000)
Likely homosexual households - Gay men (%)
Likely homosexual households - Gay men (% change since 2000)
Cost of living index
Median gross rent ($)
Median contract rent ($)
Median monthly housing costs ($)
Median house or condo value ($)
Median house or condo value ($ change since 2000)
Mean house or condo value by units in structure - 1, detached ($)
Mean house or condo value by units in structure - 1, attached ($)
Mean house or condo value by units in structure - 2 ($)
Mean house or condo value by units in structure by units in structure - 3 or 4 ($)
Mean house or condo value by units in structure - 5 or more ($)
Mean house or condo value by units in structure - Boat, RV, van, etc. ($)
Mean house or condo value by units in structure - Mobile home ($)
Median house or condo value ($) - White
Median house or condo value ($) - Black or African American
Median house or condo value ($) - Asian
Median house or condo value ($) - Hispanic or Latino
Median house or condo value ($) - American Indian and Alaska Native
Median house or condo value ($) - Multirace
Median house or condo value ($) - Other Race
Median resident age
Resident age diversity
Median resident age - Males
Median resident age - Females
Median resident age - White
Median resident age - Black or African American
Median resident age - Asian
Median resident age - Hispanic or Latino
Median resident age - American Indian and Alaska Native
Median resident age - Multirace
Median resident age - Other Race
Median resident age - Males - White
Median resident age - Males - Black or African American
Median resident age - Males - Asian
Median resident age - Males - Hispanic or Latino
Median resident age - Males - American Indian and Alaska Native
Median resident age - Males - Multirace
Median resident age - Males - Other Race
Median resident age - Females - White
Median resident age - Females - Black or African American
Median resident age - Females - Asian
Median resident age - Females - Hispanic or Latino
Median resident age - Females - American Indian and Alaska Native
Median resident age - Females - Multirace
Median resident age - Females - Other Race
Commute - mean travel time to work (minutes)
Travel time to work - Less than 5 minutes (%)
Travel time to work - Less than 5 minutes (% change since 2000)
Travel time to work - 5 to 9 minutes (%)
Travel time to work - 5 to 9 minutes (% change since 2000)
Travel time to work - 10 to 19 minutes (%)
Travel time to work - 10 to 19 minutes (% change since 2000)
Travel time to work - 20 to 29 minutes (%)
Travel time to work - 20 to 29 minutes (% change since 2000)
Travel time to work - 30 to 39 minutes (%)
Travel time to work - 30 to 39 minutes (% change since 2000)
Travel time to work - 40 to 59 minutes (%)
Travel time to work - 40 to 59 minutes (% change since 2000)
Travel time to work - 60 to 89 minutes (%)
Travel time to work - 60 to 89 minutes (% change since 2000)
Travel time to work - 90 or more minutes (%)
Travel time to work - 90 or more minutes (% change since 2000)
Marital status - Never married (%)
Marital status - Now married (%)
Marital status - Separated (%)
Marital status - Widowed (%)
Marital status - Divorced (%)
Median family income ($)
Median family income (% change since 2000)
Median non-family income ($)
Median non-family income (% change since 2000)
Median per capita income ($)
Median per capita income (% change since 2000)
Median family income ($) - White
Median family income ($) - Black or African American
Median family income ($) - Asian
Median family income ($) - Hispanic or Latino
Median family income ($) - American Indian and Alaska Native
Median family income ($) - Multirace
Median family income ($) - Other Race
Median year house/condo built
Median year apartment built
Year house built - Built 2005 or later (%)
Year house built - Built 2000 to 2004 (%)
Year house built - Built 1990 to 1999 (%)
Year house built - Built 1980 to 1989 (%)
Year house built - Built 1970 to 1979 (%)
Year house built - Built 1960 to 1969 (%)
Year house built - Built 1950 to 1959 (%)
Year house built - Built 1940 to 1949 (%)
Year house built - Built 1939 or earlier (%)
Average household size
Household density (households per square mile)
Average household size - White
Average household size - Black or African American
Average household size - Asian
Average household size - Hispanic or Latino
Average household size - American Indian and Alaska Native
Average household size - Multirace
Average household size - Other Race
Occupied housing units (%)
Vacant housing units (%)
Owner occupied housing units (%)
Renter occupied housing units (%)
Vacancy status - For rent (%)
Vacancy status - For sale only (%)
Vacancy status - Rented or sold, not occupied (%)
Vacancy status - For seasonal, recreational, or occasional use (%)
Vacancy status - For migrant workers (%)
Vacancy status - Other vacant (%)
Residents with income below the poverty level (%)
Residents with income below 50% of the poverty level (%)
Children below poverty level (%)
Poor families by family type - Married-couple family (%)
Poor families by family type - Male, no wife present (%)
Poor families by family type - Female, no husband present (%)
Poverty status for native-born residents (%)
Poverty status for foreign-born residents (%)
Poverty among high school graduates not in families (%)
Poverty among people who did not graduate high school not in families (%)
Residents with income below the poverty level (%) - White
Residents with income below the poverty level (%) - Black or African American
Residents with income below the poverty level (%) - Asian
Residents with income below the poverty level (%) - Hispanic or Latino
Residents with income below the poverty level (%) - American Indian and Alaska Native
Residents with income below the poverty level (%) - Multirace
Residents with income below the poverty level (%) - Other Race
Air pollution - Air Quality Index (AQI)
Air pollution - CO
Air pollution - NO2
Air pollution - SO2
Air pollution - Ozone
Air pollution - PM10
Air pollution - PM25
Air pollution - Pb
Crime - Murders per 100,000 population
Crime - Rapes per 100,000 population
Crime - Robberies per 100,000 population
Crime - Assaults per 100,000 population
Crime - Burglaries per 100,000 population
Crime - Thefts per 100,000 population
Crime - Auto thefts per 100,000 population
Crime - Arson per 100,000 population
Crime - City-data.com crime index
Crime - Violent crime index
Crime - Property crime index
Crime - Murders per 100,000 population (5 year average)
Crime - Rapes per 100,000 population (5 year average)
Crime - Robberies per 100,000 population (5 year average)
Crime - Assaults per 100,000 population (5 year average)
Crime - Burglaries per 100,000 population (5 year average)
Crime - Thefts per 100,000 population (5 year average)
Crime - Auto thefts per 100,000 population (5 year average)
Crime - Arson per 100,000 population (5 year average)
Crime - City-data.com crime index (5 year average)
Crime - Violent crime index (5 year average)
Crime - Property crime index (5 year average)
1996 Presidential Elections Results (%) - Democratic Party (Clinton)
1996 Presidential Elections Results (%) - Republican Party (Dole)
1996 Presidential Elections Results (%) - Other
2000 Presidential Elections Results (%) - Democratic Party (Gore)
2000 Presidential Elections Results (%) - Republican Party (Bush)
2000 Presidential Elections Results (%) - Other
2004 Presidential Elections Results (%) - Democratic Party (Kerry)
2004 Presidential Elections Results (%) - Republican Party (Bush)
2004 Presidential Elections Results (%) - Other
2008 Presidential Elections Results (%) - Democratic Party (Obama)
2008 Presidential Elections Results (%) - Republican Party (McCain)
2008 Presidential Elections Results (%) - Other
2012 Presidential Elections Results (%) - Democratic Party (Obama)
2012 Presidential Elections Results (%) - Republican Party (Romney)
2012 Presidential Elections Results (%) - Other
2016 Presidential Elections Results (%) - Democratic Party (Clinton)
2016 Presidential Elections Results (%) - Republican Party (Trump)
2016 Presidential Elections Results (%) - Other
2020 Presidential Elections Results (%) - Democratic Party (Biden)
2020 Presidential Elections Results (%) - Republican Party (Trump)
2020 Presidential Elections Results (%) - Other
Ancestries Reported - Arab (%)
Ancestries Reported - Czech (%)
Ancestries Reported - Danish (%)
Ancestries Reported - Dutch (%)
Ancestries Reported - English (%)
Ancestries Reported - French (%)
Ancestries Reported - French Canadian (%)
Ancestries Reported - German (%)
Ancestries Reported - Greek (%)
Ancestries Reported - Hungarian (%)
Ancestries Reported - Irish (%)
Ancestries Reported - Italian (%)
Ancestries Reported - Lithuanian (%)
Ancestries Reported - Norwegian (%)
Ancestries Reported - Polish (%)
Ancestries Reported - Portuguese (%)
Ancestries Reported - Russian (%)
Ancestries Reported - Scotch-Irish (%)
Ancestries Reported - Scottish (%)
Ancestries Reported - Slovak (%)
Ancestries Reported - Subsaharan African (%)
Ancestries Reported - Swedish (%)
Ancestries Reported - Swiss (%)
Ancestries Reported - Ukrainian (%)
Ancestries Reported - United States (%)
Ancestries Reported - Welsh (%)
Ancestries Reported - West Indian (%)
Ancestries Reported - Other (%)
Educational Attainment - No schooling completed (%)
Educational Attainment - Less than high school (%)
Educational Attainment - High school or equivalent (%)
Educational Attainment - Less than 1 year of college (%)
Educational Attainment - 1 or more years of college (%)
Educational Attainment - Associate degree (%)
Educational Attainment - Bachelor's degree (%)
Educational Attainment - Master's degree (%)
Educational Attainment - Professional school degree (%)
Educational Attainment - Doctorate degree (%)
School Enrollment - Nursery, preschool (%)
School Enrollment - Kindergarten (%)
School Enrollment - Grade 1 to 4 (%)
School Enrollment - Grade 5 to 8 (%)
School Enrollment - Grade 9 to 12 (%)
School Enrollment - College undergrad (%)
School Enrollment - Graduate or professional (%)
School Enrollment - Not enrolled in school (%)
School enrollment - Public schools (%)
School enrollment - Private schools (%)
School enrollment - Not enrolled (%)
Median number of rooms in houses and condos
Median number of rooms in apartments
Housing units lacking complete plumbing facilities (%)
Housing units lacking complete kitchen facilities (%)
Density of houses
Urban houses (%)
Rural houses (%)
Households with people 60 years and over (%)
Households with people 65 years and over (%)
Households with people 75 years and over (%)
Households with one or more nonrelatives (%)
Households with no nonrelatives (%)
Population in households (%)
Family households (%)
Nonfamily households (%)
Population in families (%)
Family households with own children (%)
Median number of bedrooms in owner occupied houses
Mean number of bedrooms in owner occupied houses
Median number of bedrooms in renter occupied houses
Mean number of bedrooms in renter occupied houses
Median number of vehichles in owner occupied houses
Mean number of vehichles in owner occupied houses
Median number of vehichles in renter occupied houses
Mean number of vehichles in renter occupied houses
Mortgage status - with mortgage (%)
Mortgage status - with second mortgage (%)
Mortgage status - with home equity loan (%)
Mortgage status - with both second mortgage and home equity loan (%)
Mortgage status - without a mortgage (%)
Average family size
Average family size - White
Average family size - Black or African American
Average family size - Asian
Average family size - Hispanic or Latino
Average family size - American Indian and Alaska Native
Average family size - Multirace
Average family size - Other Race
Geographical mobility - Same house 1 year ago (%)
Geographical mobility - Moved within same county (%)
Geographical mobility - Moved from different county within same state (%)
Geographical mobility - Moved from different state (%)
Geographical mobility - Moved from abroad (%)
Place of birth - Born in state of residence (%)
Place of birth - Born in other state (%)
Place of birth - Native, outside of US (%)
Place of birth - Foreign born (%)
Housing units in structures - 1, detached (%)
Housing units in structures - 1, attached (%)
Housing units in structures - 2 (%)
Housing units in structures - 3 or 4 (%)
Housing units in structures - 5 to 9 (%)
Housing units in structures - 10 to 19 (%)
Housing units in structures - 20 to 49 (%)
Housing units in structures - 50 or more (%)
Housing units in structures - Mobile home (%)
Housing units in structures - Boat, RV, van, etc. (%)
House/condo owner moved in on average (years ago)
Renter moved in on average (years ago)
Year householder moved into unit - Moved in 1999 to March 2000 (%)
Year householder moved into unit - Moved in 1995 to 1998 (%)
Year householder moved into unit - Moved in 1990 to 1994 (%)
Year householder moved into unit - Moved in 1980 to 1989 (%)
Year householder moved into unit - Moved in 1970 to 1979 (%)
Year householder moved into unit - Moved in 1969 or earlier (%)
Means of transportation to work - Drove car alone (%)
Means of transportation to work - Carpooled (%)
Means of transportation to work - Public transportation (%)
Means of transportation to work - Bus or trolley bus (%)
Means of transportation to work - Streetcar or trolley car (%)
Means of transportation to work - Subway or elevated (%)
Means of transportation to work - Railroad (%)
Means of transportation to work - Ferryboat (%)
Means of transportation to work - Taxicab (%)
Means of transportation to work - Motorcycle (%)
Means of transportation to work - Bicycle (%)
Means of transportation to work - Walked (%)
Means of transportation to work - Other means (%)
Working at home (%)
Industry diversity
Most Common Industries - Agriculture, forestry, fishing and hunting, and mining (%)
Most Common Industries - Agriculture, forestry, fishing and hunting (%)
Most Common Industries - Mining, quarrying, and oil and gas extraction (%)
Most Common Industries - Construction (%)
Most Common Industries - Manufacturing (%)
Most Common Industries - Wholesale trade (%)
Most Common Industries - Retail trade (%)
Most Common Industries - Transportation and warehousing, and utilities (%)
Most Common Industries - Transportation and warehousing (%)
Most Common Industries - Utilities (%)
Most Common Industries - Information (%)
Most Common Industries - Finance and insurance, and real estate and rental and leasing (%)
Most Common Industries - Finance and insurance (%)
Most Common Industries - Real estate and rental and leasing (%)
Most Common Industries - Professional, scientific, and management, and administrative and waste management services (%)
Most Common Industries - Professional, scientific, and technical services (%)
Most Common Industries - Management of companies and enterprises (%)
Most Common Industries - Administrative and support and waste management services (%)
Most Common Industries - Educational services, and health care and social assistance (%)
Most Common Industries - Educational services (%)
Most Common Industries - Health care and social assistance (%)
Most Common Industries - Arts, entertainment, and recreation, and accommodation and food services (%)
Most Common Industries - Arts, entertainment, and recreation (%)
Most Common Industries - Accommodation and food services (%)
Most Common Industries - Other services, except public administration (%)
Most Common Industries - Public administration (%)
Occupation diversity
Most Common Occupations - Management, business, science, and arts occupations (%)
Most Common Occupations - Management, business, and financial occupations (%)
Most Common Occupations - Management occupations (%)
Most Common Occupations - Business and financial operations occupations (%)
Most Common Occupations - Computer, engineering, and science occupations (%)
Most Common Occupations - Computer and mathematical occupations (%)
Most Common Occupations - Architecture and engineering occupations (%)
Most Common Occupations - Life, physical, and social science occupations (%)
Most Common Occupations - Education, legal, community service, arts, and media occupations (%)
Most Common Occupations - Community and social service occupations (%)
Most Common Occupations - Legal occupations (%)
Most Common Occupations - Education, training, and library occupations (%)
Most Common Occupations - Arts, design, entertainment, sports, and media occupations (%)
Most Common Occupations - Healthcare practitioners and technical occupations (%)
Most Common Occupations - Health diagnosing and treating practitioners and other technical occupations (%)
Most Common Occupations - Health technologists and technicians (%)
Most Common Occupations - Service occupations (%)
Most Common Occupations - Healthcare support occupations (%)
Most Common Occupations - Protective service occupations (%)
Most Common Occupations - Fire fighting and prevention, and other protective service workers including supervisors (%)
Most Common Occupations - Law enforcement workers including supervisors (%)
Most Common Occupations - Food preparation and serving related occupations (%)
Most Common Occupations - Building and grounds cleaning and maintenance occupations (%)
Most Common Occupations - Personal care and service occupations (%)
Most Common Occupations - Sales and office occupations (%)
Most Common Occupations - Sales and related occupations (%)
Most Common Occupations - Office and administrative support occupations (%)
Most Common Occupations - Natural resources, construction, and maintenance occupations (%)
Most Common Occupations - Farming, fishing, and forestry occupations (%)
Most Common Occupations - Construction and extraction occupations (%)
Most Common Occupations - Installation, maintenance, and repair occupations (%)
Most Common Occupations - Production, transportation, and material moving occupations (%)
Most Common Occupations - Production occupations (%)
Most Common Occupations - Transportation occupations (%)
Most Common Occupations - Material moving occupations (%)
People in Group quarters - Institutionalized population (%)
People in Group quarters - Correctional institutions (%)
People in Group quarters - Federal prisons and detention centers (%)
People in Group quarters - Halfway houses (%)
People in Group quarters - Local jails and other confinement facilities (including police lockups) (%)
People in Group quarters - Military disciplinary barracks (%)
People in Group quarters - State prisons (%)
People in Group quarters - Other types of correctional institutions (%)
People in Group quarters - Nursing homes (%)
People in Group quarters - Hospitals/wards, hospices, and schools for the handicapped (%)
People in Group quarters - Hospitals/wards and hospices for chronically ill (%)
People in Group quarters - Hospices or homes for chronically ill (%)
People in Group quarters - Military hospitals or wards for chronically ill (%)
People in Group quarters - Other hospitals or wards for chronically ill (%)
People in Group quarters - Hospitals or wards for drug/alcohol abuse (%)
People in Group quarters - Mental (Psychiatric) hospitals or wards (%)
People in Group quarters - Schools, hospitals, or wards for the mentally retarded (%)
People in Group quarters - Schools, hospitals, or wards for the physically handicapped (%)
People in Group quarters - Institutions for the deaf (%)
People in Group quarters - Institutions for the blind (%)
People in Group quarters - Orthopedic wards and institutions for the physically handicapped (%)
People in Group quarters - Wards in general hospitals for patients who have no usual home elsewhere (%)
People in Group quarters - Wards in military hospitals for patients who have no usual home elsewhere (%)
People in Group quarters - Juvenile institutions (%)
People in Group quarters - Long-term care (%)
People in Group quarters - Homes for abused, dependent, and neglected children (%)
People in Group quarters - Residential treatment centers for emotionally disturbed children (%)
People in Group quarters - Training schools for juvenile delinquents (%)
People in Group quarters - Short-term care, detention or diagnostic centers for delinquent children (%)
People in Group quarters - Type of juvenile institution unknown (%)
People in Group quarters - Noninstitutionalized population (%)
People in Group quarters - College dormitories (includes college quarters off campus) (%)
People in Group quarters - Military quarters (%)
People in Group quarters - On base (%)
People in Group quarters - Barracks, unaccompanied personnel housing (UPH), (Enlisted/Officer), ;and similar group living quarters for military personnel (%)
People in Group quarters - Transient quarters for temporary residents (%)
People in Group quarters - Military ships (%)
People in Group quarters - Group homes (%)
People in Group quarters - Homes or halfway houses for drug/alcohol abuse (%)
People in Group quarters - Homes for the mentally ill (%)
People in Group quarters - Homes for the mentally retarded (%)
People in Group quarters - Homes for the physically handicapped (%)
People in Group quarters - Other group homes (%)
People in Group quarters - Religious group quarters (%)
People in Group quarters - Dormitories (%)
People in Group quarters - Agriculture workers' dormitories on farms (%)
People in Group quarters - Job Corps and vocational training facilities (%)
People in Group quarters - Other workers' dormitories (%)
People in Group quarters - Crews of maritime vessels (%)
People in Group quarters - Other nonhousehold living situations (%)
People in Group quarters - Other noninstitutional group quarters (%)
Residents speaking English at home (%)
Residents speaking English at home - Born in the United States (%)
Residents speaking English at home - Native, born elsewhere (%)
Residents speaking English at home - Foreign born (%)
Residents speaking Spanish at home (%)
Residents speaking Spanish at home - Born in the United States (%)
Residents speaking Spanish at home - Native, born elsewhere (%)
Residents speaking Spanish at home - Foreign born (%)
Residents speaking other language at home (%)
Residents speaking other language at home - Born in the United States (%)
Residents speaking other language at home - Native, born elsewhere (%)
Residents speaking other language at home - Foreign born (%)
Class of Workers - Employee of private company (%)
Class of Workers - Self-employed in own incorporated business (%)
Class of Workers - Private not-for-profit wage and salary workers (%)
Class of Workers - Local government workers (%)
Class of Workers - State government workers (%)
Class of Workers - Federal government workers (%)
Class of Workers - Self-employed workers in own not incorporated business and Unpaid family workers (%)
House heating fuel used in houses and condos - Utility gas (%)
House heating fuel used in houses and condos - Bottled, tank, or LP gas (%)
House heating fuel used in houses and condos - Electricity (%)
House heating fuel used in houses and condos - Fuel oil, kerosene, etc. (%)
House heating fuel used in houses and condos - Coal or coke (%)
House heating fuel used in houses and condos - Wood (%)
House heating fuel used in houses and condos - Solar energy (%)
House heating fuel used in houses and condos - Other fuel (%)
House heating fuel used in houses and condos - No fuel used (%)
House heating fuel used in apartments - Utility gas (%)
House heating fuel used in apartments - Bottled, tank, or LP gas (%)
House heating fuel used in apartments - Electricity (%)
House heating fuel used in apartments - Fuel oil, kerosene, etc. (%)
House heating fuel used in apartments - Coal or coke (%)
House heating fuel used in apartments - Wood (%)
House heating fuel used in apartments - Solar energy (%)
House heating fuel used in apartments - Other fuel (%)
House heating fuel used in apartments - No fuel used (%)
Armed forces status - In Armed Forces (%)
Armed forces status - Civilian (%)
Armed forces status - Civilian - Veteran (%)
Armed forces status - Civilian - Nonveteran (%)
Fatal accidents locations in years 2005-2021
Fatal accidents locations in 2005
Fatal accidents locations in 2006
Fatal accidents locations in 2007
Fatal accidents locations in 2008
Fatal accidents locations in 2009
Fatal accidents locations in 2010
Fatal accidents locations in 2011
Fatal accidents locations in 2012
Fatal accidents locations in 2013
Fatal accidents locations in 2014
Fatal accidents locations in 2015
Fatal accidents locations in 2016
Fatal accidents locations in 2017
Fatal accidents locations in 2018
Fatal accidents locations in 2019
Fatal accidents locations in 2020
Fatal accidents locations in 2021
Alcohol use - People drinking some alcohol every month (%)
Alcohol use - People not drinking at all (%)
Alcohol use - Average days/month drinking alcohol
Alcohol use - Average drinks/week
Alcohol use - Average days/year people drink much
Audiometry - Average condition of hearing (%)
Audiometry - People that can hear a whisper from across a quiet room (%)
Audiometry - People that can hear normal voice from across a quiet room (%)
Audiometry - Ears ringing, roaring, buzzing (%)
Audiometry - Had a job exposure to loud noise (%)
Audiometry - Had off-work exposure to loud noise (%)
Blood Pressure & Cholesterol - Has high blood pressure (%)
Blood Pressure & Cholesterol - Checking blood pressure at home (%)
Blood Pressure & Cholesterol - Frequently checking blood cholesterol (%)
Blood Pressure & Cholesterol - Has high cholesterol level (%)
Consumer Behavior - Money monthly spent on food at supermarket/grocery store
Consumer Behavior - Money monthly spent on food at other stores
Consumer Behavior - Money monthly spent on eating out
Consumer Behavior - Money monthly spent on carryout/delivered foods
Consumer Behavior - Income spent on food at supermarket/grocery store (%)
Consumer Behavior - Income spent on food at other stores (%)
Consumer Behavior - Income spent on eating out (%)
Consumer Behavior - Income spent on carryout/delivered foods (%)
Current Health Status - General health condition (%)
Current Health Status - Blood donors (%)
Current Health Status - Has blood ever tested for HIV virus (%)
Current Health Status - Left-handed people (%)
Dermatology - People using sunscreen (%)
Diabetes - Diabetics (%)
Diabetes - Had a blood test for high blood sugar (%)
Diabetes - People taking insulin (%)
Diet Behavior & Nutrition - Diet health (%)
Diet Behavior & Nutrition - Milk product consumption (# of products/month)
Diet Behavior & Nutrition - Meals not home prepared (#/week)
Diet Behavior & Nutrition - Meals from fast food or pizza place (#/week)
Diet Behavior & Nutrition - Ready-to-eat foods (#/month)
Diet Behavior & Nutrition - Frozen meals/pizza (#/month)
Drug Use - People that ever used marijuana or hashish (%)
Drug Use - Ever used hard drugs (%)
Drug Use - Ever used any form of cocaine (%)
Drug Use - Ever used heroin (%)
Drug Use - Ever used methamphetamine (%)
Health Insurance - People covered by health insurance (%)
Kidney Conditions-Urology - Avg. # of times urinating at night
Medical Conditions - People with asthma (%)
Medical Conditions - People with anemia (%)
Medical Conditions - People with psoriasis (%)
Medical Conditions - People with overweight (%)
Medical Conditions - Elderly people having difficulties in thinking or remembering (%)
Medical Conditions - People who ever received blood transfusion (%)
Medical Conditions - People having trouble seeing even with glass/contacts (%)
Medical Conditions - People with arthritis (%)
Medical Conditions - People with gout (%)
Medical Conditions - People with congestive heart failure (%)
Medical Conditions - People with coronary heart disease (%)
Medical Conditions - People with angina pectoris (%)
Medical Conditions - People who ever had heart attack (%)
Medical Conditions - People who ever had stroke (%)
Medical Conditions - People with emphysema (%)
Medical Conditions - People with thyroid problem (%)
Medical Conditions - People with chronic bronchitis (%)
Medical Conditions - People with any liver condition (%)
Medical Conditions - People who ever had cancer or malignancy (%)
Mental Health - People who have little interest in doing things (%)
Mental Health - People feeling down, depressed, or hopeless (%)
Mental Health - People who have trouble sleeping or sleeping too much (%)
Mental Health - People feeling tired or having little energy (%)
Mental Health - People with poor appetite or overeating (%)
Mental Health - People feeling bad about themself (%)
Mental Health - People who have trouble concentrating on things (%)
Mental Health - People moving or speaking slowly or too fast (%)
Mental Health - People having thoughts they would be better off dead (%)
Oral Health - Average years since last visit a dentist
Oral Health - People embarrassed because of mouth (%)
Oral Health - People with gum disease (%)
Oral Health - General health of teeth and gums (%)
Oral Health - Average days a week using dental floss/device
Oral Health - Average days a week using mouthwash for dental problem
Oral Health - Average number of teeth
Pesticide Use - Households using pesticides to control insects (%)
Pesticide Use - Households using pesticides to kill weeds (%)
Physical Activity - People doing vigorous-intensity work activities (%)
Physical Activity - People doing moderate-intensity work activities (%)
Physical Activity - People walking or bicycling (%)
Physical Activity - People doing vigorous-intensity recreational activities (%)
Physical Activity - People doing moderate-intensity recreational activities (%)
Physical Activity - Average hours a day doing sedentary activities
Physical Activity - Average hours a day watching TV or videos
Physical Activity - Average hours a day using computer
Physical Functioning - People having limitations keeping them from working (%)
Physical Functioning - People limited in amount of work they can do (%)
Physical Functioning - People that need special equipment to walk (%)
Physical Functioning - People experiencing confusion/memory problems (%)
Physical Functioning - People requiring special healthcare equipment (%)
Prescription Medications - Average number of prescription medicines taking
Preventive Aspirin Use - Adults 40+ taking low-dose aspirin (%)
Reproductive Health - Vaginal deliveries (%)
Reproductive Health - Cesarean deliveries (%)
Reproductive Health - Deliveries resulted in a live birth (%)
Reproductive Health - Pregnancies resulted in a delivery (%)
Reproductive Health - Women breastfeeding newborns (%)
Reproductive Health - Women that had a hysterectomy (%)
Reproductive Health - Women that had both ovaries removed (%)
Reproductive Health - Women that have ever taken birth control pills (%)
Reproductive Health - Women taking birth control pills (%)
Reproductive Health - Women that have ever used Depo-Provera or injectables (%)
Reproductive Health - Women that have ever used female hormones (%)
Sexual Behavior - People 18+ that ever had sex (vaginal, anal, or oral) (%)
Sexual Behavior - Males 18+ that ever had vaginal sex with a woman (%)
Sexual Behavior - Males 18+ that ever performed oral sex on a woman (%)
Sexual Behavior - Males 18+ that ever had anal sex with a woman (%)
Sexual Behavior - Males 18+ that ever had any sex with a man (%)
Sexual Behavior - Females 18+ that ever had vaginal sex with a man (%)
Sexual Behavior - Females 18+ that ever performed oral sex on a man (%)
Sexual Behavior - Females 18+ that ever had anal sex with a man (%)
Sexual Behavior - Females 18+ that ever had any kind of sex with a woman (%)
Sexual Behavior - Average age people first had sex
Sexual Behavior - Average number of female sex partners in lifetime (males 18+)
Sexual Behavior - Average number of female vaginal sex partners in lifetime (males 18+)
Sexual Behavior - Average age people first performed oral sex on a woman (18+)
Sexual Behavior - Average number of woman performed oral sex on in lifetime (18+)
Sexual Behavior - Average number of male sex partners in lifetime (males 18+)
Sexual Behavior - Average number of male anal sex partners in lifetime (males 18+)
Sexual Behavior - Average age people first performed oral sex on a man (18+)
Sexual Behavior - Average number of male oral sex partners in lifetime (18+)
Sexual Behavior - People using protection when performing oral sex (%)
Sexual Behavior - Average number of times people have vaginal or anal sex a year
Sexual Behavior - People having sex without condom (%)
Sexual Behavior - Average number of male sex partners in lifetime (females 18+)
Sexual Behavior - Average number of male vaginal sex partners in lifetime (females 18+)
Sexual Behavior - Average number of female sex partners in lifetime (females 18+)
Sexual Behavior - Circumcised males 18+ (%)
Sleep Disorders - Average hours sleeping at night
Sleep Disorders - People that has trouble sleeping (%)
Smoking-Cigarette Use - People smoking cigarettes (%)
Taste & Smell - People 40+ having problems with smell (%)
Taste & Smell - People 40+ having problems with taste (%)
Taste & Smell - People 40+ that ever had wisdom teeth removed (%)
Taste & Smell - People 40+ that ever had tonsils teeth removed (%)
Taste & Smell - People 40+ that ever had a loss of consciousness because of a head injury (%)
Taste & Smell - People 40+ that ever had a broken nose or other serious injury to face or skull (%)
Taste & Smell - People 40+ that ever had two or more sinus infections (%)
Weight - Average height (inches)
Weight - Average weight (pounds)
Weight - Average BMI
Weight - People that are obese (%)
Weight - People that ever were obese (%)
Weight - People trying to lose weight (%)
100%
urban population.
Estimated median house/condo value in 2022: $576,357
98023:
$576,357Washington:
$569,500
According to our research of Washington and other state lists, there were 26 registered sex offenders living in 98023 zip code as of April 24, 2024 . The ratio of all residents to sex offenders in zip code 98023 is 1,964 to 1.The ratio of registered sex offenders to all residents in this zip code is lower than the state average.
Median resident age: This zip code:
38.8 yearsWashington median age:
38.4 years
Average household size: This zip code:
2.8 peopleWashington:
2.5 people
Averages for the 2020 tax year for zip code 98023, filed in 2021:
Average Adjusted Gross Income (AGI) in 2020: $76,568 (Individual Income Tax Returns) Here:
$76,568State:
$99,264
Salary/wage: $62,170 (reported on 84.4% of returns )Here:
$62,170State:
$80,347
(% of AGI for various income ranges: 1166.4% for AGIs below $25k , 3568.7% for AGIs $25k-50k , 6482.5% for AGIs $50k-75k , 9520.7% for AGIs $75k-100k , 17908.1% for AGIs $100k-200k , 60258.0% for AGIs over 200k ) Taxable interest for individuals: $1,414 (reported on 26.5% of returns )This zip code:
$1,414Washington:
$2,077
(% of AGI for various income ranges: 12.2% for AGIs below $25k , 13.0% for AGIs $25k-50k , 21.5% for AGIs $50k-75k , 40.1% for AGIs $75k-100k , 92.6% for AGIs $100k-200k , 1097.5% for AGIs over 200k ) Ordinary dividends: $5,600 (reported on 16.4% of returns )(% of AGI for various income ranges: 17.7% for AGIs below $25k , 21.0% for AGIs $25k-50k , 56.4% for AGIs $50k-75k , 92.7% for AGIs $75k-100k , 245.6% for AGIs $100k-200k , 2856.2% for AGIs over 200k ) Net capital gain/loss in AGI: +$20,065 (reported on 15.6% of returns )Here:
+$20,065State:
+$40,092
(% of AGI for various income ranges: 8.9% for AGIs below $25k , 17.3% for AGIs $25k-50k , 44.6% for AGIs $50k-75k , 147.6% for AGIs $75k-100k , 449.1% for AGIs $100k-200k , 15367.0% for AGIs over 200k ) Profit/loss from business: +$14,549 (reported on 13.0% of returns )Here:
+$14,549State:
+$18,312
(% of AGI for various income ranges: 113.3% for AGIs below $25k , 147.8% for AGIs $25k-50k , 209.3% for AGIs $50k-75k , 342.5% for AGIs $75k-100k , 463.6% for AGIs $100k-200k , 2459.0% for AGIs over 200k ) Taxable individual retirement arrangement distribution: $27,525 (reported on 6.9% of returns )98023:
$27,525Washington:
$24,221
(% of AGI for various income ranges: 38.5% for AGIs below $25k , 53.5% for AGIs $25k-50k , 135.5% for AGIs $50k-75k , 274.4% for AGIs $75k-100k , 742.6% for AGIs $100k-200k , 3690.0% for AGIs over 200k ) Self-employed (Keogh) retirement plans: $22,914 (reported on 0.3% of returns )98023:
$22,914Washington:
$24,166
(% of AGI for various income ranges: 23.9% for AGIs $100k-200k , 254.0% for AGIs over 200k ) Total itemized deductions: $30,008 (reported on 11.1% of returns )Here:
$30,008State:
$39,068
(% of AGI for various income ranges: 50.7% for AGIs below $25k , 114.4% for AGIs $25k-50k , 381.6% for AGIs $50k-75k , 653.1% for AGIs $75k-100k , 1175.4% for AGIs $100k-200k , 5303.0% for AGIs over 200k ) Charity contributions: $7,989 (reported on 8.2% of returns )(% of AGI for various income ranges: 4.4% for AGIs below $25k , 12.7% for AGIs $25k-50k , 43.2% for AGIs $50k-75k , 82.2% for AGIs $75k-100k , 236.2% for AGIs $100k-200k , 1696.2% for AGIs over 200k ) Taxes paid: $7,400 (reported on 11.0% of returns )(% of AGI for various income ranges: 12.8% for AGIs below $25k , 32.7% for AGIs $25k-50k , 97.6% for AGIs $50k-75k , 163.2% for AGIs $75k-100k , 303.6% for AGIs $100k-200k , 1086.0% for AGIs over 200k ) Earned income credit: $2,101 (reported on 11.8% of returns )(% of AGI for various income ranges: 73.4% for AGIs below $25k , 53.3% for AGIs $25k-50k , 0.9% for AGIs $50k-75k ) Percentage of individuals using paid preparers for their 2020 taxes: 92.5%(% for various income ranges: 92.1% for AGIs below $25k , 93.4% for AGIs $25k-50k , 92.8% for AGIs $50k-75k , 91.0% for AGIs $75k-100k , 92.3% for AGIs $100k-200k , 92.6% for AGIs over 200k )
Averages for the 2012 tax year for zip code 98023, filed in 2013:
Average Adjusted Gross Income (AGI) in 2012: $58,903 (Individual Income Tax Returns) Here:
$58,903State:
$69,533
Salary/wage: $52,368 (reported on 86.5% of returns )Here:
$52,368State:
$57,267
(% of AGI for various income ranges: 76.7% for AGIs below $25k , 83.3% for AGIs $25k-50k , 81.8% for AGIs $50k-75k , 79.8% for AGIs $75k-100k , 79.4% for AGIs $100k-200k , 58.7% for AGIs over 200k ) Taxable interest for individuals: $1,160 (reported on 34.6% of returns )This zip code:
$1,160Washington:
$1,816
(% of AGI for various income ranges: 0.7% for AGIs below $25k , 0.4% for AGIs $25k-50k , 0.4% for AGIs $50k-75k , 0.4% for AGIs $75k-100k , 0.6% for AGIs $100k-200k , 1.6% for AGIs over 200k ) Ordinary dividends: $4,506 (reported on 18.2% of returns )(% of AGI for various income ranges: 2.6% for AGIs below $25k , 0.7% for AGIs $25k-50k , 0.8% for AGIs $50k-75k , 0.8% for AGIs $75k-100k , 1.0% for AGIs $100k-200k , 3.4% for AGIs over 200k ) Net capital gain/loss in AGI: +$7,616 (reported on 13.7% of returns )Here:
+$7,616State:
+$21,568
(% of AGI for various income ranges: 0.3% for AGIs $50k-75k , 0.2% for AGIs $75k-100k , 0.9% for AGIs $100k-200k , 8.8% for AGIs over 200k ) Profit/loss from business: +$14,112 (reported on 12.1% of returns )Here:
+$14,112State:
+$16,521
(% of AGI for various income ranges: 7.6% for AGIs below $25k , 3.0% for AGIs $25k-50k , 2.7% for AGIs $50k-75k , 1.9% for AGIs $75k-100k , 2.1% for AGIs $100k-200k , 3.3% for AGIs over 200k ) Taxable individual retirement arrangement distribution: $22,305 (reported on 8.5% of returns )98023:
$22,305Washington:
$18,648
(% of AGI for various income ranges: 2.3% for AGIs below $25k , 1.7% for AGIs $25k-50k , 2.0% for AGIs $50k-75k , 3.2% for AGIs $75k-100k , 3.5% for AGIs $100k-200k , 5.8% for AGIs over 200k ) Self-employment retirement plans: $21,667 (reported on 0.4% of returns )98023:
$21,667Washington:
$20,087
(% of AGI for various income ranges: 0.2% for AGIs below $25k , 0.2% for AGIs $100k-200k , 0.4% for AGIs over 200k ) Total itemized deductions: $21,569 (21% of AGI, reported on 34.0% of returns )Here:
$21,569State:
$23,872
Here:
21.0% of AGIState:
18.2% of AGI
(% of AGI for various income ranges: 8.7% for AGIs below $25k , 10.4% for AGIs $25k-50k , 14.0% for AGIs $50k-75k , 13.9% for AGIs $75k-100k , 14.0% for AGIs $100k-200k , 10.4% for AGIs over 200k ) Charity contributions: $3,972 (reported on 27.1% of returns )(% of AGI for various income ranges: 0.6% for AGIs below $25k , 0.9% for AGIs $25k-50k , 1.5% for AGIs $50k-75k , 1.9% for AGIs $75k-100k , 2.1% for AGIs $100k-200k , 2.9% for AGIs over 200k ) Taxes paid: $5,725 (reported on 33.4% of returns )(% of AGI for various income ranges: 1.8% for AGIs below $25k , 2.4% for AGIs $25k-50k , 3.4% for AGIs $50k-75k , 3.6% for AGIs $75k-100k , 3.9% for AGIs $100k-200k , 3.0% for AGIs over 200k ) Earned income credit: $2,286 (reported on 16.5% of returns )(% of AGI for various income ranges: 6.4% for AGIs below $25k , 1.1% for AGIs $25k-50k ) Percentage of individuals using paid preparers for their 2012 taxes: 42.7%(% for various income ranges: 38.8% for AGIs below $25k , 41.1% for AGIs $25k-50k , 46.3% for AGIs $50k-75k , 44.0% for AGIs $75k-100k , 46.4% for AGIs $100k-200k , 64.9% for AGIs over 200k )
Averages for the 2004 tax year for zip code 98023, filed in 2005:
Average Adjusted Gross Income (AGI) in 2004: $54,364 (Individual Income Tax Returns) Here:
$54,364State:
$54,331
Salary/wage: $47,899 (reported on 88.3% of returns )Here:
$47,899State:
$45,761
(% of AGI for various income ranges: 137.2% for AGIs below $10k , 81.1% for AGIs $10k-25k , 84.7% for AGIs $25k-50k , 84.8% for AGIs $50k-75k , 83.9% for AGIs $75k-100k , 67.3% for AGIs over 100k ) Taxable interest for individuals: $1,328 (reported on 42.3% of returns )This zip code:
$1,328Washington:
$2,110
(% of AGI for various income ranges: 5.8% for AGIs below $10k , 1.2% for AGIs $10k-25k , 1.0% for AGIs $25k-50k , 0.8% for AGIs $50k-75k , 0.8% for AGIs $75k-100k , 1.1% for AGIs over 100k ) Taxable dividends: $3,069 (reported on 24.0% of returns )(% of AGI for various income ranges: 4.5% for AGIs below $10k , 1.0% for AGIs $10k-25k , 0.9% for AGIs $25k-50k , 0.8% for AGIs $50k-75k , 1.0% for AGIs $75k-100k , 1.9% for AGIs over 100k ) Net capital gain/loss: +$14,791 (reported on 20.0% of returns )Here:
+$14,791State:
+$15,835
(% of AGI for various income ranges: -0.4% for AGIs below $10k , -0.1% for AGIs $10k-25k , 0.4% for AGIs $25k-50k , 0.6% for AGIs $50k-75k , 1.0% for AGIs $75k-100k , 12.6% for AGIs over 100k ) Profit/loss from business: +$12,633 (reported on 13.5% of returns )Here:
+$12,633State:
+$13,994
(% of AGI for various income ranges: 0.7% for AGIs below $10k , 5.9% for AGIs $10k-25k , 3.2% for AGIs $25k-50k , 1.9% for AGIs $50k-75k , 2.4% for AGIs $75k-100k , 3.6% for AGIs over 100k ) IRA payment deduction: $3,059 (reported on 2.3% of returns )98023:
$3,059Washington:
$3,001
(% of AGI for various income ranges: 0.2% for AGIs $10k-25k , 0.2% for AGIs $25k-50k , 0.2% for AGIs $50k-75k , 0.1% for AGIs $75k-100k , 0.1% for AGIs over 100k ) Self-employed pension: $12,913 (reported on 0.7% of returns )Here:
$12,913Washington:
$14,244
(% of AGI for various income ranges: 0.1% for AGIs $25k-50k , 0.0% for AGIs $50k-75k , 0.1% for AGIs $75k-100k , 0.3% for AGIs over 100k ) Total itemized deductions: $18,429 (21% of AGI, reported on 41.6% of returns )Here:
$18,429State:
$19,669
Here:
20.6% of AGIState:
20.7% of AGI
(% of AGI for various income ranges: 18.5% for AGIs below $10k , 11.6% for AGIs $10k-25k , 14.9% for AGIs $25k-50k , 18.0% for AGIs $50k-75k , 17.4% for AGIs $75k-100k , 11.0% for AGIs over 100k ) Charity contributions deductions: $2,900 (3% of AGI, reported on 36.1% of returns )Here:
3.1% of AGIState:
3.5% of AGI
(% of AGI for various income ranges: 0.9% for AGIs below $10k , 1.0% for AGIs $10k-25k , 1.5% for AGIs $25k-50k , 2.0% for AGIs $50k-75k , 2.3% for AGIs $75k-100k , 2.1% for AGIs over 100k ) Total tax: $8,569 (reported on 78.0% of returns )(% of AGI for various income ranges: 3.8% for AGIs below $10k , 4.2% for AGIs $10k-25k , 6.7% for AGIs $25k-50k , 8.6% for AGIs $50k-75k , 10.1% for AGIs $75k-100k , 18.6% for AGIs over 100k ) Earned income credit: $1,740 (reported on 12.9% of returns )Percentage of individuals using paid preparers for their 2004 taxes: 49.3%(% for various income ranges: 42.8% for AGIs below $10k , 53.0% for AGIs $10k-25k , 50.8% for AGIs $25k-50k , 48.2% for AGIs $50k-75k , 46.0% for AGIs $75k-100k , 53.1% for AGIs over 100k )
Estimated median household income in 2022: This zip code:
$99,122Washington:
$91,306
Nearest zip codes: 98422 ,
98003 ,
98421 ,
98354 ,
98424 ,
98198 .
Federal Way Zip Code Map
Percentage of family households: This zip code:
52.9%Washington:
45.0%
Percentage of households with unmarried partners: This zip code:
6.7%Washington:
48.7%
Likely homosexual households (counted as self-reported same-sex unmarried-partner households)
Lesbian couples: 0.1% of all households Gay men: 0.1% of all households
Household received Food Stamps/SNAP in the past 12 months: 2,396Household did not receive Food Stamps/SNAP in the past 12 months: 16,131
Women who had a birth in the past 12 months: 579 (326 now married , 237 unmarried) Women who did not have a birth in the past 12 months: 11,416 (4,811 now married , 6,613 unmarried)
Housing units in zip code 98023 with a mortgage: 8,314 (1,003
second mortgage , 73
home equity loan , 755
both second mortgage and home equity loan )
Houses without a mortgage: 241
Median monthly owner costs for units with a mortgage: $2,228
Median monthly owner costs for units without a mortgage: $762
Residents with income below the poverty level in 2022:
This zip code:
8.2%Whole state:
10.0%
Residents with income below 50% of the poverty level in 2022:
This zip code:
3.3%Whole state:
4.6%
Median number of rooms in houses and condos: Median number of rooms in apartments: Notable locations in this zip code not listed on our city pages
Click to draw/clear zip code borders Notable locations in zip code 98023: (A) , Federal Way Norman Center YMCA (B) , King County Fire Protection District 39 South King Fire and Rescue Station 68 (C) , King County Fire Protection District 39 South King Fire and Rescue Station 63 (D) , Federal Way Fire Department (E) , King County Fire Protection District 39 South King Fire and Rescue Station 62 Headquarters (F) . Display/hide their locations on the map
Churches in zip code 98023 include: (A) , Christ the King Bible Fellowship Church (B) , Federal Way Church of the Nazarene (C) , Evergreen Bible Chapel (D) , Northwest Foursquare Church (E) , Light of Christ Lutheran Church (F) , Grace Church (G) , Lifeway Church (H) , Wayside United Church of Christ (I) . Display/hide their locations on the map
Lakes and reservoirs: (A) , Lake Loreene (B) , Lake Jean (C) , Lake Lorene (D) , Lake Jeane (E) . Display/hide their locations on the map
Creek: (A) . Display/hide its location on the map
Park in zip code 98023: (1) . Display/hide its location on the map
Year house built (houses)
22 2020 or later942 2010 to 20191,767 2000 to 20092,870 1990 to 19995,569 1980 to 19894,153 1970 to 19792,627 1960 to 1969428 1950 to 195953 1940 to 1949395 1939 or earlier
Zip code 98023 household income distribution in 2022 676 Less than $10,000299 $10,000 to $14,999207 $15,000 to $19,999420 $20,000 to $24,999293 $25,000 to $29,999416 $30,000 to $34,999247 $35,000 to $39,999666 $40,000 to $44,999410 $45,000 to $49,9991,279 $50,000 to $59,9991,784 $60,000 to $74,9992,736 $75,000 to $99,9992,565 $100,000 to $124,9991,668 $125,000 to $149,9991,993 $150,000 to $199,9992,872 $200,000 or moreEstimate of home value of owner-occupied houses/condos in 2022 in zip code 98023 194 Less than $10,00045 $20,000 to $24,99912 $35,000 to $39,99923 $40,000 to $49,9997 $50,000 to $59,99915 $60,000 to $69,99964 $70,000 to $79,99923 $80,000 to $89,99918 $90,000 to $99,9997 $100,000 to $124,9998 $125,000 to $149,99994 $150,000 to $174,99919 $175,000 to $199,999177 $200,000 to $249,999249 $250,000 to $299,9991,585 $300,000 to $399,9993,106 $400,000 to $499,9994,877 $500,000 to $749,9991,203 $750,000 to $999,999442 $1,000,000 to $1,499,99927 $1,500,000 to $1,999,99949 $2,000,000 or moreRent paid by renters in 2022 in zip code 98023 19 Less than $10051 $200 to $249107 $350 to $39915 $400 to $44918 $550 to $5994 $700 to $74947 $800 to $899163 $900 to $999514 $1,000 to $1,2491,294 $1,250 to $1,4992,430 $1,500 to $1,9991,175 $2,000 to $2,499199 $2,500 to $2,999114 $3,000 to $3,4996 $3,500 or more271 No cash rent
Median gross rent in 2022: $1,850.
Median price asked for vacant for-sale houses and condos in 2022: $435,173.
Estimated median house (or condo) value in 2022 for: White Non-Hispanic householders: $579,646Black or African American householders: $527,340American Indian or Alaska Native householders: $904,670Asian householders: $627,018Native Hawaiian and other Pacific Islander householders: $532,274Some other race householders: $668,139Two or more races householders: $609,254Hispanic or Latino householders: $645,769Estimated median house or condo value in 2022: $576,357
98023:
$576,357Washington:
$569,500
Lower value quartile - upper value quartile: $459,466 - $746,345
Mean price in 2022: Detached houses: $622,924Here:
$622,924State:
$734,307
Townhouses or other attached units: $632,830Here:
$632,830State:
$657,697
In 3-to-4-unit structures: $211,834Here:
$211,834State:
$510,239
In 5-or-more-unit structures: $267,750Here:
$267,750State:
$503,183
Mobile homes: $657,241Here:
$657,241State:
$218,362
Housing units in structures:
One, detached: 12,687One, attached: 415Two: 1643 or 4: 2,0785 to 9: 1,41910 to 19: 1,28920 to 49: 25750 or more: 698Mobile homes: 298Unemployment : 4.4%
Means of transportation to work in zip code 98023 64.1% 16,518 Drove a car alone9.9% 2,547 Carpooled3.8% 972 Bus or trolley bus0.0% 4 Subway or elevated0.0% 10 Railroad0.2% 39 Motorcycle1.3% 341 Walked1.1% 275 Other means18.5% 4,753 Worked at homeTravel time to work (commute) in zip code 98023 205 Less than 5 minutes944 5 to 9 minutes1,684 10 to 14 minutes1,804 15 to 19 minutes2,331 20 to 24 minutes1,594 25 to 29 minutes4,013 30 to 34 minutes742 35 to 39 minutes1,168 40 to 44 minutes2,691 45 to 59 minutes2,825 60 to 89 minutes851 90 or more minutes
Neighborhoods in zip code 98023: Percentage of zip code residents living and working in this county: 85.5%
Household type by relationship:
Households: 51,420
Male householders: 9,566 (1,678 living alone ), Female householders: 8,950 (2,168 living alone )9,700 spouses (9,588 opposite-sex spouses ), 1,304 unmarried partners , (1,244 opposite-sex unmarried partners ), 15,036 children (14,232 natural , 244 adopted , 562 stepchildren ), 1,122 grandchildren , 1,139 brothers or sisters , 1,309 parents , 12 foster children , 1,204 other relatives , 1,748 non-relatives In group quarters: 244 (-1 institutionalized population )
Size of family households: 5,001 2-persons , 2,894 3-persons , 3,515 4-persons , 1,113 5-persons , 513 6-persons , 353 7-or-more-persons
Size of nonfamily households: 3,846 1-person , 856 2-persons , 193 3-persons , 42 4-persons , 20 5-persons , 8 6-persons
6,929 married couples with children. single-parent households (838 men , 1,459 women ).
66.6% of residents of 98023 zip code speak English at home. of residents speak Spanish at home (58% very well, 22% well, 17% not well, 4% not at all ).of residents speak other Indo-European language at home (67% very well, 20% well, 9% not well, 4% not at all ).of residents speak Asian or Pacific Island language at home (55% very well, 29% well, 16% not well, 1% not at all ).of residents speak other language at home (76% very well, 24% well ).
Foreign born population: 12,329 (24.0%)
(51.8%
of them are naturalized citizens )
This zip code:
24.0%Whole state:
15.3%
13% Japan 13% Malaysia 10% Honduras 6% Ethiopia 5% Serbia 5% Guatemala 4% Marshall Islands 7% American 5% European 4% German 4% Ukrainian 3% English 2% Irish 2% Norwegian
Year of entry for the foreign-born population
4,389 2010 or later 3,083 2000 to 2009 2,484 1990 to 1999 3,052 Before 1990
There are
102 Medical Specialists in Zip Code 98023 .
Facilities with environmental interests located in this zip code:
BEST CAMPUS DRY CLEANING (1907 SW CAMPUS DR in FEDERAL WAY, WA)
Conditionally Exempt Small Quantity Generators, less than 100 kg/month of hazardous waste (Resource Conservation and Recovery Act (tracking hazardous waste)) STATE MASTER (Washington State Department of Ecology's Facility/Site identification system) - HAZWASTE-WAD988474979, CESQG Business SIC classification: DRYCLEANING PLANTS, EXCEPT RUG CLEANINGOrganizations: HYUNG LEE (CONTACT/OPERATOR)
, KARAT ASSOC (HAZARDOUS WASTE LAND OWNER)
CHEVRON 200028 (34727 PACIFIC HWY S in FEDERAL WAY, WA)
(Resource Conservation and Recovery Act (tracking hazardous waste)) STATE MASTER (Washington State Department of Ecology's Facility/Site identification system) - TOXICS-97283, LEAKING STORAGE TANK, UNDERGROUND STORAGE TANK PROGRAM, HAZWASTE-WAD988486312, EPCRA, SQG, HAZARDOUS WASTE PROGRAM Business SIC classification: GROCERY STORES; GASOLINE SERVICE STATIONS; FUEL DEALERSOrganizations: JAMES POLLOM (CONTACT/OPERATOR)
, CHEVRON PRODUCTS CO (CONTACT/OWNER)
Alternative names: CHEVRON SS 200028
CHEVRON USA INC SS 99624 (3450 SW 320TH ST in FEDERAL WAY, WA)
(Resource Conservation and Recovery Act (tracking hazardous waste)) STATE MASTER (Washington State Department of Ecology's Facility/Site identification system) - TOXICS-5264, LEAKING STORAGE TANK, UNDERGROUND STORAGE TANK PROGRAM, HAZWASTE-WAD988485124, EPCRA Business SIC classification: GASOLINE SERVICE STATIONS; NONCLASSIFIABLE ESTABLISHMENTSOrganizations: CHEVRON PRODUCTS CO (CONTACT/OWNER)
Alternative names: CHEVRON 99624
CIRCLE K STORE 5484 BP OIL (33520 21ST AVENUE SOUTHWEST in FEDERAL WAY, WA)
Conditionally Exempt Small Quantity Generators, less than 100 kg/month of hazardous waste (Resource Conservation and Recovery Act (tracking hazardous waste)) STATE MASTER (Washington State Department of Ecology's Facility/Site identification system) - TOXICS-10148, LEAKING STORAGE TANK, UNDERGROUND STORAGE TANK PROGRAM, HAZWASTE-WAD988487021, EPCRA, HAZARDOUS WASTE PROGRAM Business SIC classification: GASOLINE SERVICE STATIONSOrganizations: KAYO OIL (CONTACT/OPERATOR)
, CONOCOPHILLIPS COMPANY (CONTACT/OWNER)
Alternative names: TOSCO FACILITY 05484
BRIGADOON ELEMENTARY SCHOOL (3601 SW 336TH ST in FEDERAL WAY, WA)
(Geographic Names Information System) (National Center for Education Statistics) - STATE ID-3700 Organizations: FEDERAL WAY SCHOOL DIST 210 (SCHOOL DISTRICT)
ADELAIDE ELEMENTARY SCHOOL (1635 SW 304TH ST in FEDERAL WAY, WA)
(National Center for Education Statistics) - STATE ID-3519 Organizations: FEDERAL WAY SCHOOL DIST 210 (SCHOOL DISTRICT)
BHP COATED STEEL CORP (31635 36TH AVE S.W. in FEDERAL WAY, WA)
(Integrated Compliance Information System) - ICIS-10-2000-0209, FORMAL ENFORCEMENT ACTION
327 PL 47TH AVE SW (327 PL & 47TH AVE SW in FEDERAL WAY, WA)
(Resource Conservation and Recovery Act (tracking hazardous waste)) Organizations: WA ECY (CONTACT/OWNER)
Housing units lacking complete plumbing facilities: 0.3%
52.8% Utility gas 43.5% Electricity 1.9% Bottled, tank, or LP gas 0.8% Wood 0.7% Fuel oil, kerosene, etc.
Population in 1990: 38,292. Population change in the 1990s: +9,280 (+24.2%).
Place of birth for U.S.-born residents:
This state: 24,340Northeast: 1,504Midwest: 2,887South: 3,036West: 6,724
48% of the 98023 zip code residents lived in the same house 5 years ago.
Out of people who lived in different houses, 57% lived in this county.
Out of people who lived in different counties, 50% lived in Washington.
88% of the 98023 zip code residents lived in the same house 1 year ago.
Out of people who lived in different houses, 58% moved from this county.
Out of people who lived in different houses, 24% moved from different county within same state.
Out of people who lived in different houses, 12% moved from different state.
Out of people who lived in different houses, 5% moved from abroad.
Private vs. public school enrollment:
Students in private schools in grades 1 to 8 (elementary and middle school): 665
Here:
14.8%Washington:
12.4%
Students in private schools in grades 9 to 12 (high school): 203
Students in private undergraduate colleges: 352
Here:
16.5%Washington:
16.5%
Occupation by median earnings in the past 12 months ($)
112,916 Computer and mathematical occupations 108,402 Architecture and engineering occupations 99,113 Law enforcement workers including supervisors 96,957 Health diagnosing and treating practitioners and other technical occupations 87,735 Management occupations 74,673 Business and financial operations occupations
Companies with federal contracts located in this zip code:
WRAY, RODNEY A (2209 SOUTHWEST 356 STREET in FEDERAL WAY, WA; small business)
$9,360 with Army for Chaplain Services. Signed on 2005-02-01. Completion date: 2009-01-31.
Top industries in this zip code by the number of employees in 2005:
Accommodation and Food Services: Limited-Service Restaurants (20-49 employees: 5 establishments, 10-19 employees: 3 establishments, 5-9 employees: 5 establishments, 1-4 employees: 9 establishments)Other Services (except Public Administration): Religious Organizations (50-99: 1, 20-49: 1, 10-19: 2, 5-9: 5, 1-4: 7)Health Care and Social Assistance: Offices of Dentists (10-19: 5, 5-9: 9, 1-4: 8)Accommodation and Food Services: Snack and Nonalcoholic Beverage Bars (20-49: 2, 10-19: 1, 5-9: 2)Other Services (except Public Administration): Drycleaning and Laundry Services (except Coin-Operated) (50-99: 1, 5-9: 2, 1-4: 4)Accommodation and Food Services: Full-Service Restaurants (20-49: 1, 10-19: 2, 5-9: 3, 1-4: 1)Other Services (except Public Administration): Beauty Salons (20-49: 1, 10-19: 1, 5-9: 4, 1-4: 3)
People in group quarters in 2010:
127 people in group homes intended for adults
41 people in workers' group living quarters and job corps centers
21 people in in-patient hospice facilities
2 people in residential treatment centers for adults
People in group quarters in 2000:
13 people in other noninstitutional group quarters
11 people in nursing homes
11 people in other nonhousehold living situations
2 people in other group homes
Fatal accident statistics in 2014:
Fatal accident count: 4Vehicles involved in fatal accidents: 6Fatal accidents caused by drunken drivers: 0Fatalities: 4Persons involved in fatal accidents: 6Pedestrians involved in fatal accidents: 2
Fatal accident statistics in 2012:
Fatal accident count: 2Vehicles involved in fatal accidents: 2Fatal accidents caused by drunken drivers: 0Fatalities: 2Persons involved in fatal accidents: 4Pedestrians involved in fatal accidents: 1
Home Mortgage Disclosure Act Aggregated Statistics For Year 2009(Based on 8 full and 8 partial tracts) A) FHA, FSA/RHS & VA B) Conventional C) Refinancings D) Home Improvement Loans E) Loans on Dwellings For 5+ Families F) Non-occupant Loans on G) Loans On Manufactured Number Average Value Number Average Value Number Average Value Number Average Value Number Average Value Number Average Value Number Average Value
LOANS ORIGINATED 292 $253,204 258 $214,355 2,099 $235,934 73 $203,745 2 $18,130,860 152 $219,257 8 $143,990 APPLICATIONS APPROVED, NOT ACCEPTED 19 $263,370 35 $204,677 239 $237,032 23 $24,446 2 $18,121,705 19 $207,253 3 $111,263 APPLICATIONS DENIED 49 $233,848 81 $239,255 625 $254,427 46 $84,357 0 $0 68 $210,624 7 $65,213 APPLICATIONS WITHDRAWN 42 $223,817 31 $261,537 453 $255,392 26 $82,245 2 $20,951,215 28 $278,806 1 $82,770 FILES CLOSED FOR INCOMPLETENESS 9 $271,512 10 $282,419 94 $277,551 2 $66,000 0 $0 14 $221,719 0 $0
Aggregated Statistics For Year 2008(Based on 8 full and 8 partial tracts) A) FHA, FSA/RHS & VA B) Conventional C) Refinancings D) Home Improvement Loans E) Loans on Dwellings For 5+ Families F) Non-occupant Loans on G) Loans On Manufactured Number Average Value Number Average Value Number Average Value Number Average Value Number Average Value Number Average Value Number Average Value
LOANS ORIGINATED 191 $283,612 395 $258,160 1,208 $249,664 99 $100,711 1 $1,752,390 116 $217,376 20 $153,025 APPLICATIONS APPROVED, NOT ACCEPTED 15 $247,763 88 $268,338 198 $242,363 34 $38,498 0 $0 23 $140,763 7 $82,976 APPLICATIONS DENIED 51 $247,955 125 $301,036 845 $267,589 129 $108,658 0 $0 62 $219,663 19 $116,875 APPLICATIONS WITHDRAWN 30 $262,721 54 $261,953 418 $257,083 27 $193,592 0 $0 46 $191,240 1 $297,610 FILES CLOSED FOR INCOMPLETENESS 8 $298,008 10 $268,516 98 $278,833 20 $143,430 0 $0 4 $235,520 0 $0
Aggregated Statistics For Year 2007(Based on 8 full and 8 partial tracts) A) FHA, FSA/RHS & VA B) Conventional C) Refinancings D) Home Improvement Loans E) Loans on Dwellings For 5+ Families F) Non-occupant Loans on G) Loans On Manufactured Number Average Value Number Average Value Number Average Value Number Average Value Number Average Value Number Average Value Number Average Value
LOANS ORIGINATED 43 $294,346 1,186 $235,168 1,868 $233,931 237 $131,262 12 $15,240,931 247 $211,892 14 $199,586 APPLICATIONS APPROVED, NOT ACCEPTED 2 $241,745 202 $251,165 346 $235,355 42 $72,763 0 $0 39 $202,570 11 $78,502 APPLICATIONS DENIED 11 $248,296 438 $250,451 1,193 $262,902 286 $130,856 0 $0 107 $279,856 33 $100,307 APPLICATIONS WITHDRAWN 8 $279,180 171 $224,242 495 $239,276 74 $165,231 0 $0 40 $218,846 3 $142,143 FILES CLOSED FOR INCOMPLETENESS 1 $444,190 23 $242,408 162 $271,221 15 $183,027 0 $0 2 $261,610 2 $161,165
Aggregated Statistics For Year 2006(Based on 8 full and 8 partial tracts) A) FHA, FSA/RHS & VA B) Conventional C) Refinancings D) Home Improvement Loans F) Non-occupant Loans on G) Loans On Manufactured Number Average Value Number Average Value Number Average Value Number Average Value Number Average Value Number Average Value
LOANS ORIGINATED 39 $260,944 2,043 $191,788 2,257 $210,185 244 $99,677 382 $177,522 35 $154,489 APPLICATIONS APPROVED, NOT ACCEPTED 3 $297,183 337 $188,790 398 $207,784 45 $106,916 59 $165,974 1 $63,970 APPLICATIONS DENIED 4 $309,592 682 $188,258 1,170 $209,290 314 $135,137 123 $191,264 47 $122,114 APPLICATIONS WITHDRAWN 6 $249,500 321 $175,764 715 $218,679 85 $144,721 62 $180,125 8 $129,309 FILES CLOSED FOR INCOMPLETENESS 0 $0 63 $189,341 190 $226,620 10 $69,478 18 $188,064 0 $0
Aggregated Statistics For Year 2005(Based on 8 full and 8 partial tracts) A) FHA, FSA/RHS & VA B) Conventional C) Refinancings D) Home Improvement Loans E) Loans on Dwellings For 5+ Families F) Non-occupant Loans on G) Loans On Manufactured Number Average Value Number Average Value Number Average Value Number Average Value Number Average Value Number Average Value Number Average Value
LOANS ORIGINATED 77 $207,990 2,351 $176,899 2,378 $193,505 246 $107,607 3 $15,796,733 343 $174,025 22 $141,387 APPLICATIONS APPROVED, NOT ACCEPTED 10 $220,284 288 $184,035 383 $201,293 32 $137,460 0 $0 44 $178,018 8 $149,048 APPLICATIONS DENIED 18 $177,856 613 $161,504 1,279 $195,629 144 $94,859 0 $0 109 $175,264 29 $133,972 APPLICATIONS WITHDRAWN 16 $205,248 318 $171,908 1,029 $210,202 67 $193,066 0 $0 68 $179,060 8 $126,051 FILES CLOSED FOR INCOMPLETENESS 4 $203,778 50 $168,131 150 $218,809 6 $84,667 0 $0 11 $195,434 0 $0
Aggregated Statistics For Year 2004(Based on 8 full and 8 partial tracts) A) FHA, FSA/RHS & VA B) Conventional C) Refinancings D) Home Improvement Loans E) Loans on Dwellings For 5+ Families F) Non-occupant Loans on G) Loans On Manufactured Number Average Value Number Average Value Number Average Value Number Average Value Number Average Value Number Average Value Number Average Value
LOANS ORIGINATED 175 $187,680 1,823 $163,183 2,492 $170,452 210 $89,014 1 $4,989,660 362 $141,687 22 $119,780 APPLICATIONS APPROVED, NOT ACCEPTED 18 $163,203 245 $151,539 447 $177,325 34 $82,606 0 $0 40 $148,339 2 $64,185 APPLICATIONS DENIED 47 $199,085 388 $153,234 1,180 $181,170 197 $75,520 0 $0 112 $143,787 13 $89,778 APPLICATIONS WITHDRAWN 29 $168,695 247 $164,647 987 $176,840 45 $69,530 0 $0 70 $130,635 12 $129,345 FILES CLOSED FOR INCOMPLETENESS 1 $215,000 37 $172,361 175 $217,540 13 $94,846 0 $0 10 $177,878 0 $0
Aggregated Statistics For Year 2003(Based on 8 full and 8 partial tracts) A) FHA, FSA/RHS & VA B) Conventional C) Refinancings D) Home Improvement Loans E) Loans on Dwellings For 5+ Families F) Non-occupant Loans on Number Average Value Number Average Value Number Average Value Number Average Value Number Average Value Number Average Value
LOANS ORIGINATED 224 $189,205 1,357 $169,233 5,740 $163,823 191 $39,911 4 $1,818,738 413 $128,939 APPLICATIONS APPROVED, NOT ACCEPTED 9 $178,818 158 $156,226 647 $166,686 53 $66,732 0 $0 45 $124,901 APPLICATIONS DENIED 24 $186,877 261 $135,828 1,314 $181,578 144 $37,141 0 $0 98 $128,268 APPLICATIONS WITHDRAWN 26 $177,775 162 $156,657 908 $174,128 30 $42,325 0 $0 61 $144,648 FILES CLOSED FOR INCOMPLETENESS 2 $190,695 47 $165,985 164 $169,009 13 $43,707 0 $0 14 $143,064
Aggregated Statistics For Year 2002(Based on 3 full and 6 partial tracts) A) FHA, FSA/RHS & VA B) Conventional C) Refinancings D) Home Improvement Loans E) Loans on Dwellings For 5+ Families F) Non-occupant Loans on Number Average Value Number Average Value Number Average Value Number Average Value Number Average Value Number Average Value
LOANS ORIGINATED 169 $174,741 644 $180,648 2,460 $162,499 79 $26,838 1 $833,190 147 $132,685 APPLICATIONS APPROVED, NOT ACCEPTED 6 $159,185 81 $204,417 274 $160,283 22 $37,261 0 $0 9 $179,187 APPLICATIONS DENIED 4 $174,810 90 $172,865 449 $162,184 61 $22,692 0 $0 22 $183,917 APPLICATIONS WITHDRAWN 16 $177,454 75 $148,612 400 $180,676 12 $36,350 0 $0 7 $150,226 FILES CLOSED FOR INCOMPLETENESS 2 $183,000 36 $154,595 164 $166,247 0 $0 0 $0 3 $120,413
Aggregated Statistics For Year 2001(Based on 3 full and 6 partial tracts) A) FHA, FSA/RHS & VA B) Conventional C) Refinancings D) Home Improvement Loans E) Loans on Dwellings For 5+ Families F) Non-occupant Loans on Number Average Value Number Average Value Number Average Value Number Average Value Number Average Value Number Average Value
LOANS ORIGINATED 182 $167,865 505 $164,275 1,846 $151,067 173 $30,949 1 $2,000,000 93 $122,403 APPLICATIONS APPROVED, NOT ACCEPTED 10 $162,022 70 $146,012 226 $135,788 29 $15,811 1 $840,890 17 $120,869 APPLICATIONS DENIED 9 $140,427 103 $122,778 517 $143,736 100 $25,735 0 $0 21 $123,626 APPLICATIONS WITHDRAWN 14 $145,269 57 $173,002 424 $154,392 34 $32,199 0 $0 19 $137,264 FILES CLOSED FOR INCOMPLETENESS 1 $82,770 14 $142,814 90 $145,031 9 $21,141 0 $0 3 $135,097
Aggregated Statistics For Year 2000(Based on 3 full and 6 partial tracts) A) FHA, FSA/RHS & VA B) Conventional C) Refinancings D) Home Improvement Loans E) Loans on Dwellings For 5+ Families F) Non-occupant Loans on Number Average Value Number Average Value Number Average Value Number Average Value Number Average Value Number Average Value
LOANS ORIGINATED 176 $156,496 624 $155,561 432 $125,632 185 $23,850 3 $1,242,757 45 $96,899 APPLICATIONS APPROVED, NOT ACCEPTED 8 $144,336 74 $130,930 96 $147,577 52 $38,369 0 $0 12 $157,717 APPLICATIONS DENIED 13 $155,392 104 $136,194 304 $122,565 94 $25,371 0 $0 24 $108,336 APPLICATIONS WITHDRAWN 9 $156,958 58 $147,431 138 $114,045 13 $79,618 0 $0 5 $202,876 FILES CLOSED FOR INCOMPLETENESS 2 $120,870 18 $155,244 50 $132,676 10 $37,667 0 $0 5 $56,008
Aggregated Statistics For Year 1999(Based on 1 full and 6 partial tracts) A) FHA, FSA/RHS & VA B) Conventional C) Refinancings D) Home Improvement Loans E) Loans on Dwellings For 5+ Families F) Non-occupant Loans on Number Average Value Number Average Value Number Average Value Number Average Value Number Average Value Number Average Value
LOANS ORIGINATED 211 $144,959 563 $141,299 773 $125,605 147 $26,330 5 $2,304,252 83 $99,332 APPLICATIONS APPROVED, NOT ACCEPTED 10 $146,613 82 $124,249 137 $127,309 42 $23,761 0 $0 12 $72,352 APPLICATIONS DENIED 19 $141,684 134 $115,759 283 $119,567 92 $22,758 0 $0 24 $104,045 APPLICATIONS WITHDRAWN 15 $140,251 74 $131,586 189 $119,425 24 $63,459 1 $121,000 15 $110,719 FILES CLOSED FOR INCOMPLETENESS 0 $0 20 $132,918 65 $125,552 0 $0 0 $0 0 $0
Private Mortgage Insurance Companies Aggregated Statistics For Year 2009(Based on 8 full and 8 partial tracts) A) Conventional B) Refinancings C) Non-occupant Loans on Number Average Value Number Average Value Number Average Value
LOANS ORIGINATED 35 $254,236 46 $289,273 2 $343,645 APPLICATIONS APPROVED, NOT ACCEPTED 16 $278,699 15 $281,257 0 $0 APPLICATIONS DENIED 14 $248,436 9 $305,596 0 $0 APPLICATIONS WITHDRAWN 0 $0 7 $359,611 0 $0 FILES CLOSED FOR INCOMPLETENESS 0 $0 3 $270,183 0 $0
Aggregated Statistics For Year 2008(Based on 8 full and 8 partial tracts) A) Conventional B) Refinancings C) Non-occupant Loans on D) Loans On Manufactured Number Average Value Number Average Value Number Average Value Number Average Value
LOANS ORIGINATED 167 $277,883 117 $282,380 5 $243,000 0 $0 APPLICATIONS APPROVED, NOT ACCEPTED 78 $284,518 65 $297,046 7 $321,574 2 $291,000 APPLICATIONS DENIED 10 $270,705 21 $253,164 8 $194,021 2 $240,355 APPLICATIONS WITHDRAWN 19 $301,273 8 $252,071 0 $0 0 $0 FILES CLOSED FOR INCOMPLETENESS 5 $251,748 0 $0 1 $341,490 0 $0
Aggregated Statistics For Year 2007(Based on 8 full and 8 partial tracts) A) Conventional B) Refinancings C) Non-occupant Loans on D) Loans On Manufactured Number Average Value Number Average Value Number Average Value Number Average Value
LOANS ORIGINATED 280 $266,164 134 $286,933 22 $280,402 3 $149,183 APPLICATIONS APPROVED, NOT ACCEPTED 34 $330,094 27 $306,400 1 $290,000 0 $0 APPLICATIONS DENIED 10 $303,693 1 $990,000 0 $0 0 $0 APPLICATIONS WITHDRAWN 10 $286,620 7 $284,127 1 $180,000 0 $0 FILES CLOSED FOR INCOMPLETENESS 5 $319,200 2 $312,860 0 $0 0 $0
Aggregated Statistics For Year 2006(Based on 8 full and 8 partial tracts) A) Conventional B) Refinancings C) Non-occupant Loans on D) Loans On Manufactured Number Average Value Number Average Value Number Average Value Number Average Value
LOANS ORIGINATED 106 $265,217 54 $274,152 12 $250,912 1 $223,360 APPLICATIONS APPROVED, NOT ACCEPTED 16 $170,472 33 $255,851 5 $86,800 0 $0 APPLICATIONS DENIED 1 $172,000 6 $303,000 4 $303,000 0 $0 APPLICATIONS WITHDRAWN 10 $179,463 7 $242,880 4 $221,232 0 $0 FILES CLOSED FOR INCOMPLETENESS 0 $0 0 $0 0 $0 0 $0
Aggregated Statistics For Year 2005(Based on 8 full and 8 partial tracts) A) Conventional B) Refinancings C) Non-occupant Loans on Number Average Value Number Average Value Number Average Value
LOANS ORIGINATED 99 $228,744 109 $218,344 11 $248,191 APPLICATIONS APPROVED, NOT ACCEPTED 11 $175,995 20 $217,062 7 $135,786 APPLICATIONS DENIED 6 $252,965 4 $191,840 4 $256,448 APPLICATIONS WITHDRAWN 10 $208,486 8 $217,356 1 $358,000 FILES CLOSED FOR INCOMPLETENESS 0 $0 0 $0 0 $0
Aggregated Statistics For Year 2004(Based on 8 full and 8 partial tracts) A) Conventional B) Refinancings C) Non-occupant Loans on D) Loans On Manufactured Number Average Value Number Average Value Number Average Value Number Average Value
LOANS ORIGINATED 193 $186,651 110 $193,901 25 $124,562 3 $193,423 APPLICATIONS APPROVED, NOT ACCEPTED 28 $164,209 30 $186,454 8 $125,844 0 $0 APPLICATIONS DENIED 1 $124,100 0 $0 0 $0 0 $0 APPLICATIONS WITHDRAWN 14 $181,282 13 $200,458 4 $152,220 0 $0 FILES CLOSED FOR INCOMPLETENESS 0 $0 4 $153,600 2 $128,200 0 $0
Aggregated Statistics For Year 2003(Based on 8 full and 8 partial tracts) A) Conventional B) Refinancings C) Non-occupant Loans on Number Average Value Number Average Value Number Average Value
LOANS ORIGINATED 271 $195,520 324 $190,834 13 $177,964 APPLICATIONS APPROVED, NOT ACCEPTED 27 $188,938 94 $195,520 5 $150,868 APPLICATIONS DENIED 12 $183,623 8 $231,989 2 $58,000 APPLICATIONS WITHDRAWN 10 $222,582 17 $207,864 2 $271,445 FILES CLOSED FOR INCOMPLETENESS 0 $0 2 $137,355 0 $0
Aggregated Statistics For Year 2002(Based on 3 full and 6 partial tracts) A) Conventional B) Refinancings C) Non-occupant Loans on Number Average Value Number Average Value Number Average Value
LOANS ORIGINATED 147 $187,091 156 $179,792 14 $139,956 APPLICATIONS APPROVED, NOT ACCEPTED 9 $177,421 45 $179,901 1 $87,640 APPLICATIONS DENIED 1 $241,350 12 $189,048 0 $0 APPLICATIONS WITHDRAWN 5 $143,576 10 $191,454 2 $136,440 FILES CLOSED FOR INCOMPLETENESS 0 $0 0 $0 0 $0
Aggregated Statistics For Year 2001(Based on 3 full and 6 partial tracts) A) Conventional B) Refinancings C) Non-occupant Loans on Number Average Value Number Average Value Number Average Value
LOANS ORIGINATED 122 $192,188 164 $172,572 2 $183,870 APPLICATIONS APPROVED, NOT ACCEPTED 7 $181,080 35 $177,331 2 $136,440 APPLICATIONS DENIED 4 $155,995 16 $168,763 0 $0 APPLICATIONS WITHDRAWN 4 $149,198 5 $143,012 0 $0 FILES CLOSED FOR INCOMPLETENESS 0 $0 0 $0 0 $0
Aggregated Statistics For Year 2000(Based on 3 full and 6 partial tracts) A) Conventional B) Refinancings C) Non-occupant Loans on Number Average Value Number Average Value Number Average Value
LOANS ORIGINATED 191 $171,351 45 $175,393 6 $121,777 APPLICATIONS APPROVED, NOT ACCEPTED 10 $186,006 5 $157,794 1 $188,720 APPLICATIONS DENIED 3 $145,990 5 $181,314 0 $0 APPLICATIONS WITHDRAWN 6 $166,623 0 $0 1 $46,250 FILES CLOSED FOR INCOMPLETENESS 0 $0 0 $0 0 $0
Aggregated Statistics For Year 1999(Based on 1 full and 6 partial tracts) A) Conventional B) Refinancings C) Non-occupant Loans on Number Average Value Number Average Value Number Average Value
LOANS ORIGINATED 189 $158,917 89 $147,755 7 $119,466 APPLICATIONS APPROVED, NOT ACCEPTED 11 $158,377 21 $158,893 0 $0 APPLICATIONS DENIED 16 $158,547 7 $145,966 0 $0 APPLICATIONS WITHDRAWN 7 $156,487 8 $146,144 2 $98,750 FILES CLOSED FOR INCOMPLETENESS 1 $164,110 1 $101,170 0 $0
2002 - 2018 National Fire Incident Reporting System (NFIRS) incidents See full 2006 National Fire Incident Reporting System statistics for zip code 98023, Washington
Most common first names in zip code 98023 among deceased individuals Name Count Lived (average)
John 75 75.5 years Robert 63 73.0 years James 47 73.5 years Mary 46 77.8 years William 36 72.6 years Richard 31 67.4 years Helen 29 81.9 years Dorothy 24 79.2 years Charles 24 76.4 years Donald 24 76.9 years
Most common last names in zip code 98023 among deceased individuals Last name Count Lived (average)
Smith 36 77.2 years Jones 20 68.8 years Kim 18 65.3 years Brown 18 73.8 years Johnson 16 72.4 years Anderson 14 71.3 years Miller 13 70.7 years Lee 13 81.1 years Wilson 11 80.7 years Thompson 11 72.7 years
Businesses in zip code 98023
Name Count Name Count
7-Eleven 1 Nike 4 Ace Hardware 2 Papa John's Pizza 1 AutoZone 1 Pizza Hut 1 Baskin-Robbins 1 Quiznos 1 Circle K 1 Rite Aid 1 Curves 1 Safeway 1 DHL 1 Starbucks 3 Dairy Queen 1 Subway 2 Domino's Pizza 1 Taco Bell 1 FedEx 1 U-Haul 1 GNC 1 UPS 1 H&R Block 2 Vons 1 IHOP 1 Walgreens 1 KFC 1 YMCA 1 Kroger 2


 Nearest zip codes: 98422, 98003, 98421, 98354, 98424, 98198.


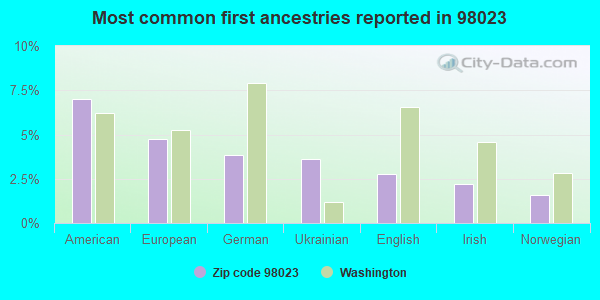
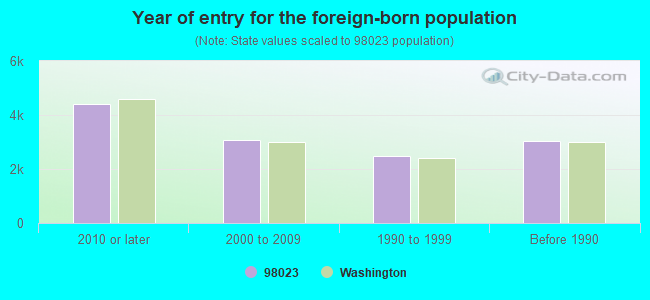
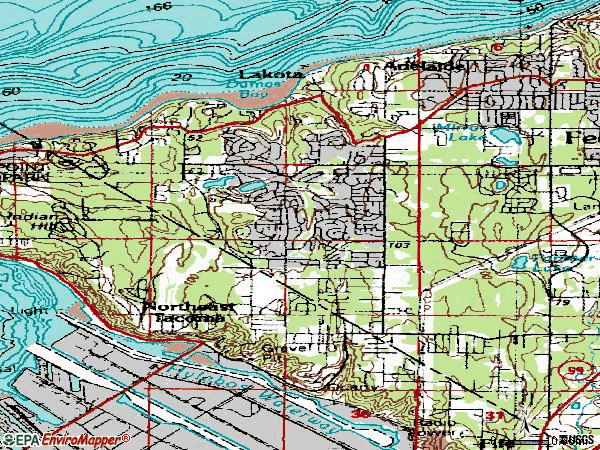

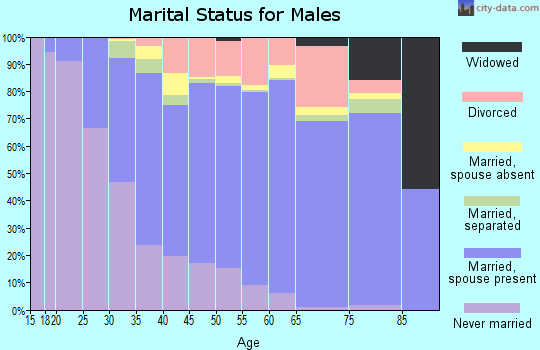
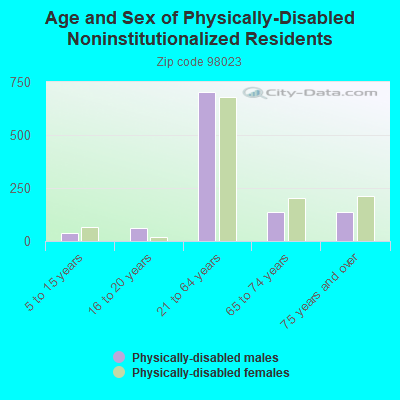
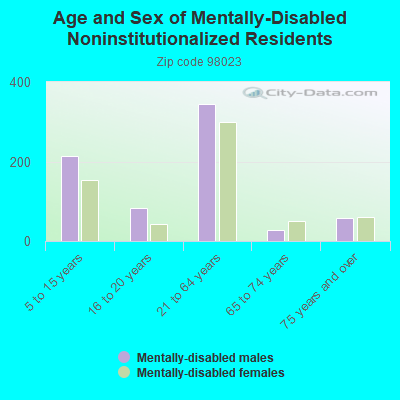
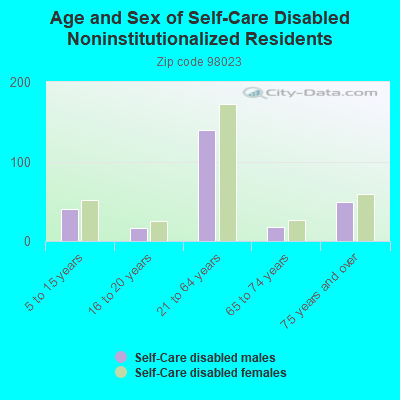
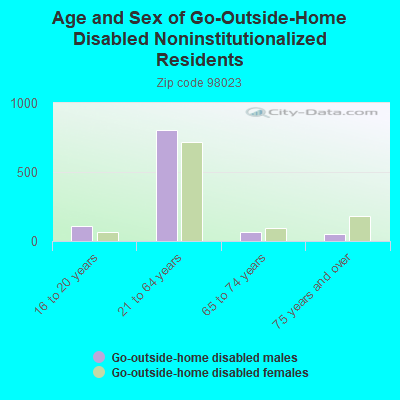
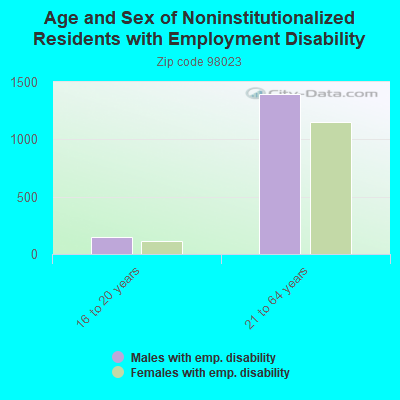
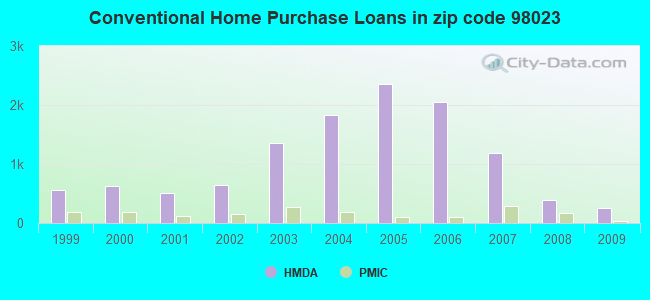
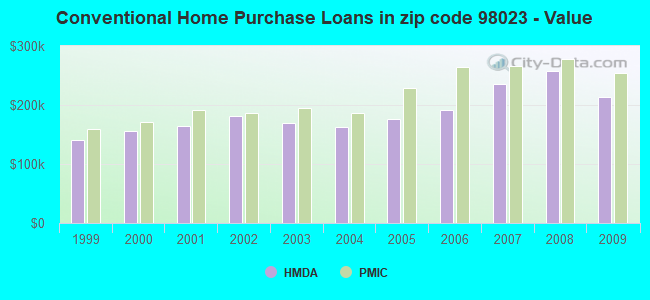
 Based on the data from the years 2002 - 2018 the average number of fire incidents per year is 109. The highest number of fire incidents - 153 took place in 2018, and the least - 54 in 2016. The data has an increasing trend.
 When looking into fire subcategories, the most reports belonged to: Structure Fires (44.9%), and Outside Fires (41.8%).