Estimated zip code population in 2022: 23,052
Zip code population in 2010: 18,784
Zip code population in 2000: 31,203
Houses and condos: 8,992
Renter-occupied apartments: 1,249
% of renters here:
14%State:
36%
March 2022 cost of living index in zip code 98053: 115.6
(more than average, U.S. average is 100)
Land area: 28.4
sq. mi.
Water area: 0.2
sq. mi.
Population density: 813 people per square mile (low).
OSM Map
General Map
Google Map
MSN Map
OSM Map
General Map
Google Map
MSN Map
OSM Map
General Map
Google Map
MSN Map
OSM Map
General Map
Google Map
MSN Map
Please wait while loading the map...
Real estate property taxes paid for housing units in 2022:
This zip code:
0.7% ($9,701)Washington:
0.8% ($4,283)
Median real estate property taxes paid for housing units with mortgages in 2022: $9,954 (0.7%)
Median real estate property taxes paid for housing units with no mortgage in 2022: $9,295 (0.8%)
Profiles of local businesses
Business Search - 14 Million verified businesses
Males: 11,243 Females: 11,809
For population 25 years and over in 98053:
High school or higher: 101.0%Bachelor's degree or higher: 75.0%Graduate or professional degree: 35.5%Unemployed: 3.9%Mean travel time to work (commute): 29.9 minutes
For population 15 years and over in 98053:
Never married: 17.5%Now married: 71.4%Separated: 0.6%Widowed: 4.2%Divorced: 6.3%
Zip code 98053 compared to state average:
Median household income above state average. Median house value significantly above state average. Black race population percentage significantly below state average. Hispanic race population percentage significantly below state average. Median age above state average. Foreign-born population percentage above state average. Renting percentage significantly below state average. Length of stay since moving in significantly above state average. Number of rooms per house above state average. House age significantly below state average. Percentage of population with a bachelor's degree or higher above state average. 14,795 64.2% White 5,966 25.9% Asian 1,077 4.7% Two or more races 855 3.7% Hispanic or Latino 211 0.9% Some other race 114 0.5% Black 31 0.1% American Indian
Data:
Median household income ($)
Median household income (% change since 2000)
Household income diversity
Ratio of average income to average house value (%)
Ratio of average income to average rent
Median household income ($) - White
Median household income ($) - Black or African American
Median household income ($) - Asian
Median household income ($) - Hispanic or Latino
Median household income ($) - American Indian and Alaska Native
Median household income ($) - Multirace
Median household income ($) - Other Race
Median household income for houses/condos with a mortgage ($)
Median household income for apartments without a mortgage ($)
Races - White alone (%)
Races - White alone (% change since 2000)
Races - Black alone (%)
Races - Black alone (% change since 2000)
Races - American Indian alone (%)
Races - American Indian alone (% change since 2000)
Races - Asian alone (%)
Races - Asian alone (% change since 2000)
Races - Hispanic (%)
Races - Hispanic (% change since 2000)
Races - Native Hawaiian and Other Pacific Islander alone (%)
Races - Native Hawaiian and Other Pacific Islander alone (% change since 2000)
Races - Two or more races (%)
Races - Two or more races (% change since 2000)
Races - Other race alone (%)
Races - Other race alone (% change since 2000)
Racial diversity
Unemployment (%)
Unemployment (% change since 2000)
Unemployment (%) - White
Unemployment (%) - Black or African American
Unemployment (%) - Asian
Unemployment (%) - Hispanic or Latino
Unemployment (%) - American Indian and Alaska Native
Unemployment (%) - Multirace
Unemployment (%) - Other Race
Population density (people per square mile)
Population - Males (%)
Population - Females (%)
Population - Males (%) - White
Population - Males (%) - Black or African American
Population - Males (%) - Asian
Population - Males (%) - Hispanic or Latino
Population - Males (%) - American Indian and Alaska Native
Population - Males (%) - Multirace
Population - Males (%) - Other Race
Population - Females (%) - White
Population - Females (%) - Black or African American
Population - Females (%) - Asian
Population - Females (%) - Hispanic or Latino
Population - Females (%) - American Indian and Alaska Native
Population - Females (%) - Multirace
Population - Females (%) - Other Race
Coronavirus confirmed cases (Apr 18, 2024)
Deaths caused by coronavirus (Apr 18, 2024)
Coronavirus confirmed cases (per 100k population) (Apr 18, 2024)
Deaths caused by coronavirus (per 100k population) (Apr 18, 2024)
Daily increase in number of cases (Apr 18, 2024)
Weekly increase in number of cases (Apr 18, 2024)
Cases doubled (in days) (Apr 18, 2024)
Hospitalized patients (Apr 18, 2022)
Negative test results (Apr 18, 2022)
Total test results (Apr 18, 2022)
COVID Vaccine doses distributed (per 100k population) (Sep 19, 2023)
COVID Vaccine doses administered (per 100k population) (Sep 19, 2023)
COVID Vaccine doses distributed (Sep 19, 2023)
COVID Vaccine doses administered (Sep 19, 2023)
Likely homosexual households (%)
Likely homosexual households (% change since 2000)
Likely homosexual households - Lesbian couples (%)
Likely homosexual households - Lesbian couples (% change since 2000)
Likely homosexual households - Gay men (%)
Likely homosexual households - Gay men (% change since 2000)
Cost of living index
Median gross rent ($)
Median contract rent ($)
Median monthly housing costs ($)
Median house or condo value ($)
Median house or condo value ($ change since 2000)
Mean house or condo value by units in structure - 1, detached ($)
Mean house or condo value by units in structure - 1, attached ($)
Mean house or condo value by units in structure - 2 ($)
Mean house or condo value by units in structure by units in structure - 3 or 4 ($)
Mean house or condo value by units in structure - 5 or more ($)
Mean house or condo value by units in structure - Boat, RV, van, etc. ($)
Mean house or condo value by units in structure - Mobile home ($)
Median house or condo value ($) - White
Median house or condo value ($) - Black or African American
Median house or condo value ($) - Asian
Median house or condo value ($) - Hispanic or Latino
Median house or condo value ($) - American Indian and Alaska Native
Median house or condo value ($) - Multirace
Median house or condo value ($) - Other Race
Median resident age
Resident age diversity
Median resident age - Males
Median resident age - Females
Median resident age - White
Median resident age - Black or African American
Median resident age - Asian
Median resident age - Hispanic or Latino
Median resident age - American Indian and Alaska Native
Median resident age - Multirace
Median resident age - Other Race
Median resident age - Males - White
Median resident age - Males - Black or African American
Median resident age - Males - Asian
Median resident age - Males - Hispanic or Latino
Median resident age - Males - American Indian and Alaska Native
Median resident age - Males - Multirace
Median resident age - Males - Other Race
Median resident age - Females - White
Median resident age - Females - Black or African American
Median resident age - Females - Asian
Median resident age - Females - Hispanic or Latino
Median resident age - Females - American Indian and Alaska Native
Median resident age - Females - Multirace
Median resident age - Females - Other Race
Commute - mean travel time to work (minutes)
Travel time to work - Less than 5 minutes (%)
Travel time to work - Less than 5 minutes (% change since 2000)
Travel time to work - 5 to 9 minutes (%)
Travel time to work - 5 to 9 minutes (% change since 2000)
Travel time to work - 10 to 19 minutes (%)
Travel time to work - 10 to 19 minutes (% change since 2000)
Travel time to work - 20 to 29 minutes (%)
Travel time to work - 20 to 29 minutes (% change since 2000)
Travel time to work - 30 to 39 minutes (%)
Travel time to work - 30 to 39 minutes (% change since 2000)
Travel time to work - 40 to 59 minutes (%)
Travel time to work - 40 to 59 minutes (% change since 2000)
Travel time to work - 60 to 89 minutes (%)
Travel time to work - 60 to 89 minutes (% change since 2000)
Travel time to work - 90 or more minutes (%)
Travel time to work - 90 or more minutes (% change since 2000)
Marital status - Never married (%)
Marital status - Now married (%)
Marital status - Separated (%)
Marital status - Widowed (%)
Marital status - Divorced (%)
Median family income ($)
Median family income (% change since 2000)
Median non-family income ($)
Median non-family income (% change since 2000)
Median per capita income ($)
Median per capita income (% change since 2000)
Median family income ($) - White
Median family income ($) - Black or African American
Median family income ($) - Asian
Median family income ($) - Hispanic or Latino
Median family income ($) - American Indian and Alaska Native
Median family income ($) - Multirace
Median family income ($) - Other Race
Median year house/condo built
Median year apartment built
Year house built - Built 2005 or later (%)
Year house built - Built 2000 to 2004 (%)
Year house built - Built 1990 to 1999 (%)
Year house built - Built 1980 to 1989 (%)
Year house built - Built 1970 to 1979 (%)
Year house built - Built 1960 to 1969 (%)
Year house built - Built 1950 to 1959 (%)
Year house built - Built 1940 to 1949 (%)
Year house built - Built 1939 or earlier (%)
Average household size
Household density (households per square mile)
Average household size - White
Average household size - Black or African American
Average household size - Asian
Average household size - Hispanic or Latino
Average household size - American Indian and Alaska Native
Average household size - Multirace
Average household size - Other Race
Occupied housing units (%)
Vacant housing units (%)
Owner occupied housing units (%)
Renter occupied housing units (%)
Vacancy status - For rent (%)
Vacancy status - For sale only (%)
Vacancy status - Rented or sold, not occupied (%)
Vacancy status - For seasonal, recreational, or occasional use (%)
Vacancy status - For migrant workers (%)
Vacancy status - Other vacant (%)
Residents with income below the poverty level (%)
Residents with income below 50% of the poverty level (%)
Children below poverty level (%)
Poor families by family type - Married-couple family (%)
Poor families by family type - Male, no wife present (%)
Poor families by family type - Female, no husband present (%)
Poverty status for native-born residents (%)
Poverty status for foreign-born residents (%)
Poverty among high school graduates not in families (%)
Poverty among people who did not graduate high school not in families (%)
Residents with income below the poverty level (%) - White
Residents with income below the poverty level (%) - Black or African American
Residents with income below the poverty level (%) - Asian
Residents with income below the poverty level (%) - Hispanic or Latino
Residents with income below the poverty level (%) - American Indian and Alaska Native
Residents with income below the poverty level (%) - Multirace
Residents with income below the poverty level (%) - Other Race
Air pollution - Air Quality Index (AQI)
Air pollution - CO
Air pollution - NO2
Air pollution - SO2
Air pollution - Ozone
Air pollution - PM10
Air pollution - PM25
Air pollution - Pb
Crime - Murders per 100,000 population
Crime - Rapes per 100,000 population
Crime - Robberies per 100,000 population
Crime - Assaults per 100,000 population
Crime - Burglaries per 100,000 population
Crime - Thefts per 100,000 population
Crime - Auto thefts per 100,000 population
Crime - Arson per 100,000 population
Crime - City-data.com crime index
Crime - Violent crime index
Crime - Property crime index
Crime - Murders per 100,000 population (5 year average)
Crime - Rapes per 100,000 population (5 year average)
Crime - Robberies per 100,000 population (5 year average)
Crime - Assaults per 100,000 population (5 year average)
Crime - Burglaries per 100,000 population (5 year average)
Crime - Thefts per 100,000 population (5 year average)
Crime - Auto thefts per 100,000 population (5 year average)
Crime - Arson per 100,000 population (5 year average)
Crime - City-data.com crime index (5 year average)
Crime - Violent crime index (5 year average)
Crime - Property crime index (5 year average)
1996 Presidential Elections Results (%) - Democratic Party (Clinton)
1996 Presidential Elections Results (%) - Republican Party (Dole)
1996 Presidential Elections Results (%) - Other
2000 Presidential Elections Results (%) - Democratic Party (Gore)
2000 Presidential Elections Results (%) - Republican Party (Bush)
2000 Presidential Elections Results (%) - Other
2004 Presidential Elections Results (%) - Democratic Party (Kerry)
2004 Presidential Elections Results (%) - Republican Party (Bush)
2004 Presidential Elections Results (%) - Other
2008 Presidential Elections Results (%) - Democratic Party (Obama)
2008 Presidential Elections Results (%) - Republican Party (McCain)
2008 Presidential Elections Results (%) - Other
2012 Presidential Elections Results (%) - Democratic Party (Obama)
2012 Presidential Elections Results (%) - Republican Party (Romney)
2012 Presidential Elections Results (%) - Other
2016 Presidential Elections Results (%) - Democratic Party (Clinton)
2016 Presidential Elections Results (%) - Republican Party (Trump)
2016 Presidential Elections Results (%) - Other
2020 Presidential Elections Results (%) - Democratic Party (Biden)
2020 Presidential Elections Results (%) - Republican Party (Trump)
2020 Presidential Elections Results (%) - Other
Ancestries Reported - Arab (%)
Ancestries Reported - Czech (%)
Ancestries Reported - Danish (%)
Ancestries Reported - Dutch (%)
Ancestries Reported - English (%)
Ancestries Reported - French (%)
Ancestries Reported - French Canadian (%)
Ancestries Reported - German (%)
Ancestries Reported - Greek (%)
Ancestries Reported - Hungarian (%)
Ancestries Reported - Irish (%)
Ancestries Reported - Italian (%)
Ancestries Reported - Lithuanian (%)
Ancestries Reported - Norwegian (%)
Ancestries Reported - Polish (%)
Ancestries Reported - Portuguese (%)
Ancestries Reported - Russian (%)
Ancestries Reported - Scotch-Irish (%)
Ancestries Reported - Scottish (%)
Ancestries Reported - Slovak (%)
Ancestries Reported - Subsaharan African (%)
Ancestries Reported - Swedish (%)
Ancestries Reported - Swiss (%)
Ancestries Reported - Ukrainian (%)
Ancestries Reported - United States (%)
Ancestries Reported - Welsh (%)
Ancestries Reported - West Indian (%)
Ancestries Reported - Other (%)
Educational Attainment - No schooling completed (%)
Educational Attainment - Less than high school (%)
Educational Attainment - High school or equivalent (%)
Educational Attainment - Less than 1 year of college (%)
Educational Attainment - 1 or more years of college (%)
Educational Attainment - Associate degree (%)
Educational Attainment - Bachelor's degree (%)
Educational Attainment - Master's degree (%)
Educational Attainment - Professional school degree (%)
Educational Attainment - Doctorate degree (%)
School Enrollment - Nursery, preschool (%)
School Enrollment - Kindergarten (%)
School Enrollment - Grade 1 to 4 (%)
School Enrollment - Grade 5 to 8 (%)
School Enrollment - Grade 9 to 12 (%)
School Enrollment - College undergrad (%)
School Enrollment - Graduate or professional (%)
School Enrollment - Not enrolled in school (%)
School enrollment - Public schools (%)
School enrollment - Private schools (%)
School enrollment - Not enrolled (%)
Median number of rooms in houses and condos
Median number of rooms in apartments
Housing units lacking complete plumbing facilities (%)
Housing units lacking complete kitchen facilities (%)
Density of houses
Urban houses (%)
Rural houses (%)
Households with people 60 years and over (%)
Households with people 65 years and over (%)
Households with people 75 years and over (%)
Households with one or more nonrelatives (%)
Households with no nonrelatives (%)
Population in households (%)
Family households (%)
Nonfamily households (%)
Population in families (%)
Family households with own children (%)
Median number of bedrooms in owner occupied houses
Mean number of bedrooms in owner occupied houses
Median number of bedrooms in renter occupied houses
Mean number of bedrooms in renter occupied houses
Median number of vehichles in owner occupied houses
Mean number of vehichles in owner occupied houses
Median number of vehichles in renter occupied houses
Mean number of vehichles in renter occupied houses
Mortgage status - with mortgage (%)
Mortgage status - with second mortgage (%)
Mortgage status - with home equity loan (%)
Mortgage status - with both second mortgage and home equity loan (%)
Mortgage status - without a mortgage (%)
Average family size
Average family size - White
Average family size - Black or African American
Average family size - Asian
Average family size - Hispanic or Latino
Average family size - American Indian and Alaska Native
Average family size - Multirace
Average family size - Other Race
Geographical mobility - Same house 1 year ago (%)
Geographical mobility - Moved within same county (%)
Geographical mobility - Moved from different county within same state (%)
Geographical mobility - Moved from different state (%)
Geographical mobility - Moved from abroad (%)
Place of birth - Born in state of residence (%)
Place of birth - Born in other state (%)
Place of birth - Native, outside of US (%)
Place of birth - Foreign born (%)
Housing units in structures - 1, detached (%)
Housing units in structures - 1, attached (%)
Housing units in structures - 2 (%)
Housing units in structures - 3 or 4 (%)
Housing units in structures - 5 to 9 (%)
Housing units in structures - 10 to 19 (%)
Housing units in structures - 20 to 49 (%)
Housing units in structures - 50 or more (%)
Housing units in structures - Mobile home (%)
Housing units in structures - Boat, RV, van, etc. (%)
House/condo owner moved in on average (years ago)
Renter moved in on average (years ago)
Year householder moved into unit - Moved in 1999 to March 2000 (%)
Year householder moved into unit - Moved in 1995 to 1998 (%)
Year householder moved into unit - Moved in 1990 to 1994 (%)
Year householder moved into unit - Moved in 1980 to 1989 (%)
Year householder moved into unit - Moved in 1970 to 1979 (%)
Year householder moved into unit - Moved in 1969 or earlier (%)
Means of transportation to work - Drove car alone (%)
Means of transportation to work - Carpooled (%)
Means of transportation to work - Public transportation (%)
Means of transportation to work - Bus or trolley bus (%)
Means of transportation to work - Streetcar or trolley car (%)
Means of transportation to work - Subway or elevated (%)
Means of transportation to work - Railroad (%)
Means of transportation to work - Ferryboat (%)
Means of transportation to work - Taxicab (%)
Means of transportation to work - Motorcycle (%)
Means of transportation to work - Bicycle (%)
Means of transportation to work - Walked (%)
Means of transportation to work - Other means (%)
Working at home (%)
Industry diversity
Most Common Industries - Agriculture, forestry, fishing and hunting, and mining (%)
Most Common Industries - Agriculture, forestry, fishing and hunting (%)
Most Common Industries - Mining, quarrying, and oil and gas extraction (%)
Most Common Industries - Construction (%)
Most Common Industries - Manufacturing (%)
Most Common Industries - Wholesale trade (%)
Most Common Industries - Retail trade (%)
Most Common Industries - Transportation and warehousing, and utilities (%)
Most Common Industries - Transportation and warehousing (%)
Most Common Industries - Utilities (%)
Most Common Industries - Information (%)
Most Common Industries - Finance and insurance, and real estate and rental and leasing (%)
Most Common Industries - Finance and insurance (%)
Most Common Industries - Real estate and rental and leasing (%)
Most Common Industries - Professional, scientific, and management, and administrative and waste management services (%)
Most Common Industries - Professional, scientific, and technical services (%)
Most Common Industries - Management of companies and enterprises (%)
Most Common Industries - Administrative and support and waste management services (%)
Most Common Industries - Educational services, and health care and social assistance (%)
Most Common Industries - Educational services (%)
Most Common Industries - Health care and social assistance (%)
Most Common Industries - Arts, entertainment, and recreation, and accommodation and food services (%)
Most Common Industries - Arts, entertainment, and recreation (%)
Most Common Industries - Accommodation and food services (%)
Most Common Industries - Other services, except public administration (%)
Most Common Industries - Public administration (%)
Occupation diversity
Most Common Occupations - Management, business, science, and arts occupations (%)
Most Common Occupations - Management, business, and financial occupations (%)
Most Common Occupations - Management occupations (%)
Most Common Occupations - Business and financial operations occupations (%)
Most Common Occupations - Computer, engineering, and science occupations (%)
Most Common Occupations - Computer and mathematical occupations (%)
Most Common Occupations - Architecture and engineering occupations (%)
Most Common Occupations - Life, physical, and social science occupations (%)
Most Common Occupations - Education, legal, community service, arts, and media occupations (%)
Most Common Occupations - Community and social service occupations (%)
Most Common Occupations - Legal occupations (%)
Most Common Occupations - Education, training, and library occupations (%)
Most Common Occupations - Arts, design, entertainment, sports, and media occupations (%)
Most Common Occupations - Healthcare practitioners and technical occupations (%)
Most Common Occupations - Health diagnosing and treating practitioners and other technical occupations (%)
Most Common Occupations - Health technologists and technicians (%)
Most Common Occupations - Service occupations (%)
Most Common Occupations - Healthcare support occupations (%)
Most Common Occupations - Protective service occupations (%)
Most Common Occupations - Fire fighting and prevention, and other protective service workers including supervisors (%)
Most Common Occupations - Law enforcement workers including supervisors (%)
Most Common Occupations - Food preparation and serving related occupations (%)
Most Common Occupations - Building and grounds cleaning and maintenance occupations (%)
Most Common Occupations - Personal care and service occupations (%)
Most Common Occupations - Sales and office occupations (%)
Most Common Occupations - Sales and related occupations (%)
Most Common Occupations - Office and administrative support occupations (%)
Most Common Occupations - Natural resources, construction, and maintenance occupations (%)
Most Common Occupations - Farming, fishing, and forestry occupations (%)
Most Common Occupations - Construction and extraction occupations (%)
Most Common Occupations - Installation, maintenance, and repair occupations (%)
Most Common Occupations - Production, transportation, and material moving occupations (%)
Most Common Occupations - Production occupations (%)
Most Common Occupations - Transportation occupations (%)
Most Common Occupations - Material moving occupations (%)
People in Group quarters - Institutionalized population (%)
People in Group quarters - Correctional institutions (%)
People in Group quarters - Federal prisons and detention centers (%)
People in Group quarters - Halfway houses (%)
People in Group quarters - Local jails and other confinement facilities (including police lockups) (%)
People in Group quarters - Military disciplinary barracks (%)
People in Group quarters - State prisons (%)
People in Group quarters - Other types of correctional institutions (%)
People in Group quarters - Nursing homes (%)
People in Group quarters - Hospitals/wards, hospices, and schools for the handicapped (%)
People in Group quarters - Hospitals/wards and hospices for chronically ill (%)
People in Group quarters - Hospices or homes for chronically ill (%)
People in Group quarters - Military hospitals or wards for chronically ill (%)
People in Group quarters - Other hospitals or wards for chronically ill (%)
People in Group quarters - Hospitals or wards for drug/alcohol abuse (%)
People in Group quarters - Mental (Psychiatric) hospitals or wards (%)
People in Group quarters - Schools, hospitals, or wards for the mentally retarded (%)
People in Group quarters - Schools, hospitals, or wards for the physically handicapped (%)
People in Group quarters - Institutions for the deaf (%)
People in Group quarters - Institutions for the blind (%)
People in Group quarters - Orthopedic wards and institutions for the physically handicapped (%)
People in Group quarters - Wards in general hospitals for patients who have no usual home elsewhere (%)
People in Group quarters - Wards in military hospitals for patients who have no usual home elsewhere (%)
People in Group quarters - Juvenile institutions (%)
People in Group quarters - Long-term care (%)
People in Group quarters - Homes for abused, dependent, and neglected children (%)
People in Group quarters - Residential treatment centers for emotionally disturbed children (%)
People in Group quarters - Training schools for juvenile delinquents (%)
People in Group quarters - Short-term care, detention or diagnostic centers for delinquent children (%)
People in Group quarters - Type of juvenile institution unknown (%)
People in Group quarters - Noninstitutionalized population (%)
People in Group quarters - College dormitories (includes college quarters off campus) (%)
People in Group quarters - Military quarters (%)
People in Group quarters - On base (%)
People in Group quarters - Barracks, unaccompanied personnel housing (UPH), (Enlisted/Officer), ;and similar group living quarters for military personnel (%)
People in Group quarters - Transient quarters for temporary residents (%)
People in Group quarters - Military ships (%)
People in Group quarters - Group homes (%)
People in Group quarters - Homes or halfway houses for drug/alcohol abuse (%)
People in Group quarters - Homes for the mentally ill (%)
People in Group quarters - Homes for the mentally retarded (%)
People in Group quarters - Homes for the physically handicapped (%)
People in Group quarters - Other group homes (%)
People in Group quarters - Religious group quarters (%)
People in Group quarters - Dormitories (%)
People in Group quarters - Agriculture workers' dormitories on farms (%)
People in Group quarters - Job Corps and vocational training facilities (%)
People in Group quarters - Other workers' dormitories (%)
People in Group quarters - Crews of maritime vessels (%)
People in Group quarters - Other nonhousehold living situations (%)
People in Group quarters - Other noninstitutional group quarters (%)
Residents speaking English at home (%)
Residents speaking English at home - Born in the United States (%)
Residents speaking English at home - Native, born elsewhere (%)
Residents speaking English at home - Foreign born (%)
Residents speaking Spanish at home (%)
Residents speaking Spanish at home - Born in the United States (%)
Residents speaking Spanish at home - Native, born elsewhere (%)
Residents speaking Spanish at home - Foreign born (%)
Residents speaking other language at home (%)
Residents speaking other language at home - Born in the United States (%)
Residents speaking other language at home - Native, born elsewhere (%)
Residents speaking other language at home - Foreign born (%)
Class of Workers - Employee of private company (%)
Class of Workers - Self-employed in own incorporated business (%)
Class of Workers - Private not-for-profit wage and salary workers (%)
Class of Workers - Local government workers (%)
Class of Workers - State government workers (%)
Class of Workers - Federal government workers (%)
Class of Workers - Self-employed workers in own not incorporated business and Unpaid family workers (%)
House heating fuel used in houses and condos - Utility gas (%)
House heating fuel used in houses and condos - Bottled, tank, or LP gas (%)
House heating fuel used in houses and condos - Electricity (%)
House heating fuel used in houses and condos - Fuel oil, kerosene, etc. (%)
House heating fuel used in houses and condos - Coal or coke (%)
House heating fuel used in houses and condos - Wood (%)
House heating fuel used in houses and condos - Solar energy (%)
House heating fuel used in houses and condos - Other fuel (%)
House heating fuel used in houses and condos - No fuel used (%)
House heating fuel used in apartments - Utility gas (%)
House heating fuel used in apartments - Bottled, tank, or LP gas (%)
House heating fuel used in apartments - Electricity (%)
House heating fuel used in apartments - Fuel oil, kerosene, etc. (%)
House heating fuel used in apartments - Coal or coke (%)
House heating fuel used in apartments - Wood (%)
House heating fuel used in apartments - Solar energy (%)
House heating fuel used in apartments - Other fuel (%)
House heating fuel used in apartments - No fuel used (%)
Armed forces status - In Armed Forces (%)
Armed forces status - Civilian (%)
Armed forces status - Civilian - Veteran (%)
Armed forces status - Civilian - Nonveteran (%)
Fatal accidents locations in years 2005-2021
Fatal accidents locations in 2005
Fatal accidents locations in 2006
Fatal accidents locations in 2007
Fatal accidents locations in 2008
Fatal accidents locations in 2009
Fatal accidents locations in 2010
Fatal accidents locations in 2011
Fatal accidents locations in 2012
Fatal accidents locations in 2013
Fatal accidents locations in 2014
Fatal accidents locations in 2015
Fatal accidents locations in 2016
Fatal accidents locations in 2017
Fatal accidents locations in 2018
Fatal accidents locations in 2019
Fatal accidents locations in 2020
Fatal accidents locations in 2021
Alcohol use - People drinking some alcohol every month (%)
Alcohol use - People not drinking at all (%)
Alcohol use - Average days/month drinking alcohol
Alcohol use - Average drinks/week
Alcohol use - Average days/year people drink much
Audiometry - Average condition of hearing (%)
Audiometry - People that can hear a whisper from across a quiet room (%)
Audiometry - People that can hear normal voice from across a quiet room (%)
Audiometry - Ears ringing, roaring, buzzing (%)
Audiometry - Had a job exposure to loud noise (%)
Audiometry - Had off-work exposure to loud noise (%)
Blood Pressure & Cholesterol - Has high blood pressure (%)
Blood Pressure & Cholesterol - Checking blood pressure at home (%)
Blood Pressure & Cholesterol - Frequently checking blood cholesterol (%)
Blood Pressure & Cholesterol - Has high cholesterol level (%)
Consumer Behavior - Money monthly spent on food at supermarket/grocery store
Consumer Behavior - Money monthly spent on food at other stores
Consumer Behavior - Money monthly spent on eating out
Consumer Behavior - Money monthly spent on carryout/delivered foods
Consumer Behavior - Income spent on food at supermarket/grocery store (%)
Consumer Behavior - Income spent on food at other stores (%)
Consumer Behavior - Income spent on eating out (%)
Consumer Behavior - Income spent on carryout/delivered foods (%)
Current Health Status - General health condition (%)
Current Health Status - Blood donors (%)
Current Health Status - Has blood ever tested for HIV virus (%)
Current Health Status - Left-handed people (%)
Dermatology - People using sunscreen (%)
Diabetes - Diabetics (%)
Diabetes - Had a blood test for high blood sugar (%)
Diabetes - People taking insulin (%)
Diet Behavior & Nutrition - Diet health (%)
Diet Behavior & Nutrition - Milk product consumption (# of products/month)
Diet Behavior & Nutrition - Meals not home prepared (#/week)
Diet Behavior & Nutrition - Meals from fast food or pizza place (#/week)
Diet Behavior & Nutrition - Ready-to-eat foods (#/month)
Diet Behavior & Nutrition - Frozen meals/pizza (#/month)
Drug Use - People that ever used marijuana or hashish (%)
Drug Use - Ever used hard drugs (%)
Drug Use - Ever used any form of cocaine (%)
Drug Use - Ever used heroin (%)
Drug Use - Ever used methamphetamine (%)
Health Insurance - People covered by health insurance (%)
Kidney Conditions-Urology - Avg. # of times urinating at night
Medical Conditions - People with asthma (%)
Medical Conditions - People with anemia (%)
Medical Conditions - People with psoriasis (%)
Medical Conditions - People with overweight (%)
Medical Conditions - Elderly people having difficulties in thinking or remembering (%)
Medical Conditions - People who ever received blood transfusion (%)
Medical Conditions - People having trouble seeing even with glass/contacts (%)
Medical Conditions - People with arthritis (%)
Medical Conditions - People with gout (%)
Medical Conditions - People with congestive heart failure (%)
Medical Conditions - People with coronary heart disease (%)
Medical Conditions - People with angina pectoris (%)
Medical Conditions - People who ever had heart attack (%)
Medical Conditions - People who ever had stroke (%)
Medical Conditions - People with emphysema (%)
Medical Conditions - People with thyroid problem (%)
Medical Conditions - People with chronic bronchitis (%)
Medical Conditions - People with any liver condition (%)
Medical Conditions - People who ever had cancer or malignancy (%)
Mental Health - People who have little interest in doing things (%)
Mental Health - People feeling down, depressed, or hopeless (%)
Mental Health - People who have trouble sleeping or sleeping too much (%)
Mental Health - People feeling tired or having little energy (%)
Mental Health - People with poor appetite or overeating (%)
Mental Health - People feeling bad about themself (%)
Mental Health - People who have trouble concentrating on things (%)
Mental Health - People moving or speaking slowly or too fast (%)
Mental Health - People having thoughts they would be better off dead (%)
Oral Health - Average years since last visit a dentist
Oral Health - People embarrassed because of mouth (%)
Oral Health - People with gum disease (%)
Oral Health - General health of teeth and gums (%)
Oral Health - Average days a week using dental floss/device
Oral Health - Average days a week using mouthwash for dental problem
Oral Health - Average number of teeth
Pesticide Use - Households using pesticides to control insects (%)
Pesticide Use - Households using pesticides to kill weeds (%)
Physical Activity - People doing vigorous-intensity work activities (%)
Physical Activity - People doing moderate-intensity work activities (%)
Physical Activity - People walking or bicycling (%)
Physical Activity - People doing vigorous-intensity recreational activities (%)
Physical Activity - People doing moderate-intensity recreational activities (%)
Physical Activity - Average hours a day doing sedentary activities
Physical Activity - Average hours a day watching TV or videos
Physical Activity - Average hours a day using computer
Physical Functioning - People having limitations keeping them from working (%)
Physical Functioning - People limited in amount of work they can do (%)
Physical Functioning - People that need special equipment to walk (%)
Physical Functioning - People experiencing confusion/memory problems (%)
Physical Functioning - People requiring special healthcare equipment (%)
Prescription Medications - Average number of prescription medicines taking
Preventive Aspirin Use - Adults 40+ taking low-dose aspirin (%)
Reproductive Health - Vaginal deliveries (%)
Reproductive Health - Cesarean deliveries (%)
Reproductive Health - Deliveries resulted in a live birth (%)
Reproductive Health - Pregnancies resulted in a delivery (%)
Reproductive Health - Women breastfeeding newborns (%)
Reproductive Health - Women that had a hysterectomy (%)
Reproductive Health - Women that had both ovaries removed (%)
Reproductive Health - Women that have ever taken birth control pills (%)
Reproductive Health - Women taking birth control pills (%)
Reproductive Health - Women that have ever used Depo-Provera or injectables (%)
Reproductive Health - Women that have ever used female hormones (%)
Sexual Behavior - People 18+ that ever had sex (vaginal, anal, or oral) (%)
Sexual Behavior - Males 18+ that ever had vaginal sex with a woman (%)
Sexual Behavior - Males 18+ that ever performed oral sex on a woman (%)
Sexual Behavior - Males 18+ that ever had anal sex with a woman (%)
Sexual Behavior - Males 18+ that ever had any sex with a man (%)
Sexual Behavior - Females 18+ that ever had vaginal sex with a man (%)
Sexual Behavior - Females 18+ that ever performed oral sex on a man (%)
Sexual Behavior - Females 18+ that ever had anal sex with a man (%)
Sexual Behavior - Females 18+ that ever had any kind of sex with a woman (%)
Sexual Behavior - Average age people first had sex
Sexual Behavior - Average number of female sex partners in lifetime (males 18+)
Sexual Behavior - Average number of female vaginal sex partners in lifetime (males 18+)
Sexual Behavior - Average age people first performed oral sex on a woman (18+)
Sexual Behavior - Average number of woman performed oral sex on in lifetime (18+)
Sexual Behavior - Average number of male sex partners in lifetime (males 18+)
Sexual Behavior - Average number of male anal sex partners in lifetime (males 18+)
Sexual Behavior - Average age people first performed oral sex on a man (18+)
Sexual Behavior - Average number of male oral sex partners in lifetime (18+)
Sexual Behavior - People using protection when performing oral sex (%)
Sexual Behavior - Average number of times people have vaginal or anal sex a year
Sexual Behavior - People having sex without condom (%)
Sexual Behavior - Average number of male sex partners in lifetime (females 18+)
Sexual Behavior - Average number of male vaginal sex partners in lifetime (females 18+)
Sexual Behavior - Average number of female sex partners in lifetime (females 18+)
Sexual Behavior - Circumcised males 18+ (%)
Sleep Disorders - Average hours sleeping at night
Sleep Disorders - People that has trouble sleeping (%)
Smoking-Cigarette Use - People smoking cigarettes (%)
Taste & Smell - People 40+ having problems with smell (%)
Taste & Smell - People 40+ having problems with taste (%)
Taste & Smell - People 40+ that ever had wisdom teeth removed (%)
Taste & Smell - People 40+ that ever had tonsils teeth removed (%)
Taste & Smell - People 40+ that ever had a loss of consciousness because of a head injury (%)
Taste & Smell - People 40+ that ever had a broken nose or other serious injury to face or skull (%)
Taste & Smell - People 40+ that ever had two or more sinus infections (%)
Weight - Average height (inches)
Weight - Average weight (pounds)
Weight - Average BMI
Weight - People that are obese (%)
Weight - People that ever were obese (%)
Weight - People trying to lose weight (%)
Urban population: 21,807
Rural population: 1,244
Estimated median house/condo value in 2022: $1,301,646
98053:
$1,301,646Washington:
$569,500
According to our research of Washington and other state lists, there were 2 registered sex offenders living in 98053 zip code as of April 18, 2024 . The ratio of all residents to sex offenders in zip code 98053 is 11,061 to 1.The ratio of registered sex offenders to all residents in this zip code is much lower than the state average.
Median resident age: This zip code:
44.6 yearsWashington median age:
38.4 years
Average household size: This zip code:
2.6 peopleWashington:
2.5 people
Averages for the 2020 tax year for zip code 98053, filed in 2021:
Average Adjusted Gross Income (AGI) in 2020: $248,665 (Individual Income Tax Returns) Here:
$248,665State:
$99,264
Salary/wage: $224,816 (reported on 75.3% of returns )Here:
$224,816State:
$80,347
(% of AGI for various income ranges: 1067.5% for AGIs below $25k , 3046.2% for AGIs $25k-50k , 5279.3% for AGIs $50k-75k , 7513.0% for AGIs $75k-100k , 16368.0% for AGIs $100k-200k , 138175.8% for AGIs over 200k ) Taxable interest for individuals: $2,855 (reported on 62.8% of returns )This zip code:
$2,855Washington:
$2,077
(% of AGI for various income ranges: 53.0% for AGIs below $25k , 79.6% for AGIs $25k-50k , 138.5% for AGIs $50k-75k , 186.4% for AGIs $75k-100k , 310.3% for AGIs $100k-200k , 1159.3% for AGIs over 200k ) Ordinary dividends: $13,772 (reported on 57.7% of returns )Here:
$13,772State:
$10,013
(% of AGI for various income ranges: 113.1% for AGIs below $25k , 236.4% for AGIs $25k-50k , 389.3% for AGIs $50k-75k , 640.9% for AGIs $75k-100k , 1043.2% for AGIs $100k-200k , 5881.8% for AGIs over 200k ) Net capital gain/loss in AGI: +$64,983 (reported on 54.8% of returns )Here:
+$64,983State:
+$40,092
(% of AGI for various income ranges: 53.8% for AGIs below $25k , 215.0% for AGIs $25k-50k , 308.5% for AGIs $50k-75k , 644.1% for AGIs $75k-100k , 1336.5% for AGIs $100k-200k , 32466.4% for AGIs over 200k ) Profit/loss from business: +$23,825 (reported on 14.9% of returns )Here:
+$23,825State:
+$18,312
(% of AGI for various income ranges: 77.1% for AGIs below $25k , 188.0% for AGIs $25k-50k , 312.0% for AGIs $50k-75k , 540.9% for AGIs $75k-100k , 744.2% for AGIs $100k-200k , 2087.3% for AGIs over 200k ) Taxable individual retirement arrangement distribution: $33,619 (reported on 16.1% of returns )98053:
$33,619Washington:
$24,221
(% of AGI for various income ranges: 113.0% for AGIs below $25k , 299.9% for AGIs $25k-50k , 659.3% for AGIs $50k-75k , 1214.5% for AGIs $75k-100k , 1993.2% for AGIs $100k-200k , 2068.4% for AGIs over 200k ) Self-employed (Keogh) retirement plans: $23,827 (reported on 1.5% of returns )98053:
$23,827Washington:
$24,166
(% of AGI for various income ranges: 72.4% for AGIs $100k-200k , 273.4% for AGIs over 200k ) Total itemized deductions: $40,796 (reported on 30.2% of returns )Here:
$40,796State:
$39,068
(% of AGI for various income ranges: 254.4% for AGIs below $25k , 560.0% for AGIs $25k-50k , 835.9% for AGIs $50k-75k , 1279.3% for AGIs $75k-100k , 2017.2% for AGIs $100k-200k , 8270.7% for AGIs over 200k ) Charity contributions: $11,908 (reported on 25.3% of returns )Here:
$11,908State:
$15,331
(% of AGI for various income ranges: 11.9% for AGIs below $25k , 45.0% for AGIs $25k-50k , 103.6% for AGIs $50k-75k , 155.7% for AGIs $75k-100k , 326.4% for AGIs $100k-200k , 2419.8% for AGIs over 200k ) Taxes paid: $9,319 (reported on 30.1% of returns )(% of AGI for various income ranges: 55.4% for AGIs below $25k , 132.1% for AGIs $25k-50k , 236.9% for AGIs $50k-75k , 378.4% for AGIs $75k-100k , 545.3% for AGIs $100k-200k , 1734.5% for AGIs over 200k ) Earned income credit: $1,611 (reported on 2.8% of returns )(% of AGI for various income ranges: 25.6% for AGIs below $25k , 24.3% for AGIs $25k-50k ) Percentage of individuals using paid preparers for their 2020 taxes: 92.0%(% for various income ranges: 89.5% for AGIs below $25k , 89.9% for AGIs $25k-50k , 92.6% for AGIs $50k-75k , 90.8% for AGIs $75k-100k , 90.7% for AGIs $100k-200k , 94.8% for AGIs over 200k )
Averages for the 2012 tax year for zip code 98053, filed in 2013:
Average Adjusted Gross Income (AGI) in 2012: $152,248 (Individual Income Tax Returns) Here:
$152,248State:
$69,533
Salary/wage: $135,723 (reported on 79.0% of returns )Here:
$135,723State:
$57,267
(% of AGI for various income ranges: 68.6% for AGIs below $25k , 65.3% for AGIs $25k-50k , 60.6% for AGIs $50k-75k , 57.1% for AGIs $75k-100k , 76.8% for AGIs $100k-200k , 69.9% for AGIs over 200k ) Taxable interest for individuals: $2,768 (reported on 61.9% of returns )This zip code:
$2,768Washington:
$1,816
(% of AGI for various income ranges: 2.8% for AGIs below $25k , 1.3% for AGIs $25k-50k , 1.9% for AGIs $50k-75k , 1.8% for AGIs $75k-100k , 0.7% for AGIs $100k-200k , 1.2% for AGIs over 200k ) Ordinary dividends: $12,081 (reported on 52.9% of returns )(% of AGI for various income ranges: 7.8% for AGIs below $25k , 4.2% for AGIs $25k-50k , 3.8% for AGIs $50k-75k , 3.5% for AGIs $75k-100k , 2.3% for AGIs $100k-200k , 5.0% for AGIs over 200k ) Net capital gain/loss in AGI: +$23,143 (reported on 47.6% of returns )Here:
+$23,143State:
+$21,568
(% of AGI for various income ranges: 0.3% for AGIs below $25k , 0.9% for AGIs $25k-50k , 1.5% for AGIs $50k-75k , 1.7% for AGIs $75k-100k , 1.7% for AGIs $100k-200k , 10.9% for AGIs over 200k ) Profit/loss from business: +$26,050 (reported on 16.4% of returns )Here:
+$26,050State:
+$16,521
(% of AGI for various income ranges: 5.3% for AGIs below $25k , 4.5% for AGIs $25k-50k , 4.7% for AGIs $50k-75k , 3.5% for AGIs $75k-100k , 3.0% for AGIs $100k-200k , 2.4% for AGIs over 200k ) Taxable individual retirement arrangement distribution: $30,753 (reported on 17.2% of returns )98053:
$30,753Washington:
$18,648
(% of AGI for various income ranges: 6.4% for AGIs below $25k , 6.5% for AGIs $25k-50k , 5.9% for AGIs $50k-75k , 8.2% for AGIs $75k-100k , 4.8% for AGIs $100k-200k , 2.1% for AGIs over 200k ) Self-employment retirement plans: $18,119 (reported on 1.7% of returns )98053:
$18,119Washington:
$20,087
(% of AGI for various income ranges: 0.5% for AGIs $50k-75k , 0.2% for AGIs $100k-200k , 0.2% for AGIs over 200k ) Total itemized deductions: $30,994 (14% of AGI, reported on 60.5% of returns )Here:
$30,994State:
$23,872
Here:
14.5% of AGIState:
18.2% of AGI
(% of AGI for various income ranges: 25.0% for AGIs below $25k , 20.1% for AGIs $25k-50k , 20.8% for AGIs $50k-75k , 20.5% for AGIs $75k-100k , 15.3% for AGIs $100k-200k , 9.1% for AGIs over 200k ) Charity contributions: $5,159 (reported on 51.6% of returns )(% of AGI for various income ranges: 1.6% for AGIs below $25k , 1.6% for AGIs $25k-50k , 1.9% for AGIs $50k-75k , 2.0% for AGIs $75k-100k , 1.7% for AGIs $100k-200k , 1.7% for AGIs over 200k ) Taxes paid: $10,062 (reported on 60.1% of returns )98053:
$10,062State:
$6,400
(% of AGI for various income ranges: 6.3% for AGIs below $25k , 5.9% for AGIs $25k-50k , 6.6% for AGIs $50k-75k , 6.3% for AGIs $75k-100k , 4.9% for AGIs $100k-200k , 3.1% for AGIs over 200k ) Earned income credit: $1,379 (reported on 3.6% of returns )(% of AGI for various income ranges: 1.7% for AGIs below $25k , 0.2% for AGIs $25k-50k ) Percentage of individuals using paid preparers for their 2012 taxes: 44.4%(% for various income ranges: 34.8% for AGIs below $25k , 42.2% for AGIs $25k-50k , 46.7% for AGIs $50k-75k , 48.2% for AGIs $75k-100k , 43.6% for AGIs $100k-200k , 53.3% for AGIs over 200k )
Averages for the 2004 tax year for zip code 98053, filed in 2005:
Average Adjusted Gross Income (AGI) in 2004: $134,859 (Individual Income Tax Returns) Here:
$134,859State:
$54,331
Salary/wage: $105,647 (reported on 83.8% of returns )Here:
$105,647State:
$45,761
(% of AGI for various income ranges: 312.1% for AGIs below $10k , 71.7% for AGIs $10k-25k , 72.5% for AGIs $25k-50k , 74.2% for AGIs $50k-75k , 82.4% for AGIs $75k-100k , 62.6% for AGIs over 100k ) Taxable interest for individuals: $2,960 (reported on 68.2% of returns )This zip code:
$2,960Washington:
$2,110
(% of AGI for various income ranges: 26.8% for AGIs below $10k , 2.6% for AGIs $10k-25k , 2.1% for AGIs $25k-50k , 2.0% for AGIs $50k-75k , 1.2% for AGIs $75k-100k , 1.4% for AGIs over 100k ) Taxable dividends: $12,955 (reported on 55.0% of returns )(% of AGI for various income ranges: 40.6% for AGIs below $10k , 3.9% for AGIs $10k-25k , 4.0% for AGIs $25k-50k , 2.6% for AGIs $50k-75k , 2.6% for AGIs $75k-100k , 5.8% for AGIs over 100k ) Net capital gain/loss: +$18,948 (reported on 47.8% of returns )Here:
+$18,948State:
+$15,835
(% of AGI for various income ranges: -1.8% for AGIs below $10k , 1.7% for AGIs $10k-25k , 1.4% for AGIs $25k-50k , 1.1% for AGIs $50k-75k , 1.5% for AGIs $75k-100k , 7.9% for AGIs over 100k ) Profit/loss from business: +$25,481 (reported on 17.2% of returns )Here:
+$25,481State:
+$13,994
(% of AGI for various income ranges: 22.6% for AGIs below $10k , 9.1% for AGIs $10k-25k , 8.0% for AGIs $25k-50k , 5.0% for AGIs $50k-75k , 2.0% for AGIs $75k-100k , 2.9% for AGIs over 100k ) IRA payment deduction: $3,490 (reported on 3.4% of returns )98053:
$3,490Washington:
$3,001
(% of AGI for various income ranges: 0.4% for AGIs $10k-25k , 0.4% for AGIs $25k-50k , 0.3% for AGIs $50k-75k , 0.1% for AGIs $75k-100k , 0.1% for AGIs over 100k ) Self-employed pension: $16,079 (reported on 1.8% of returns )Here:
$16,079Washington:
$14,244
(% of AGI for various income ranges: 0.2% for AGIs $25k-50k , 0.3% for AGIs $50k-75k , 0.2% for AGIs $75k-100k , 0.2% for AGIs over 100k ) Total itemized deductions: $33,192 (19% of AGI, reported on 62.2% of returns )Here:
$33,192State:
$19,669
Here:
18.8% of AGIState:
20.7% of AGI
(% of AGI for various income ranges: 95.9% for AGIs below $10k , 25.4% for AGIs $10k-25k , 22.1% for AGIs $25k-50k , 22.6% for AGIs $50k-75k , 20.4% for AGIs $75k-100k , 13.7% for AGIs over 100k ) Charity contributions deductions: $4,676 (3% of AGI, reported on 55.5% of returns )Here:
2.9% of AGIState:
3.5% of AGI
(% of AGI for various income ranges: 3.4% for AGIs below $10k , 1.9% for AGIs $10k-25k , 1.9% for AGIs $25k-50k , 2.2% for AGIs $50k-75k , 2.2% for AGIs $75k-100k , 1.9% for AGIs over 100k ) Total tax: $27,275 (reported on 86.7% of returns )98053:
$27,275State:
$9,065
(% of AGI for various income ranges: 12.8% for AGIs below $10k , 5.5% for AGIs $10k-25k , 8.1% for AGIs $25k-50k , 9.3% for AGIs $50k-75k , 10.3% for AGIs $75k-100k , 19.4% for AGIs over 100k ) Earned income credit: $1,210 (reported on 2.8% of returns )Percentage of individuals using paid preparers for their 2004 taxes: 46.4%(% for various income ranges: 36.9% for AGIs below $10k , 40.9% for AGIs $10k-25k , 45.2% for AGIs $25k-50k , 52.5% for AGIs $50k-75k , 41.0% for AGIs $75k-100k , 52.1% for AGIs over 100k )
Estimated median household income in 2022: This zip code:
$173,688Washington:
$91,306
Nearest zip codes: 98074 ,
98075 ,
98077 ,
98008 ,
98052 ,
98029 .
Union Hill Novelty Hill Zip Code Map
Percentage of family households: This zip code:
53.7%Washington:
45.0%
Percentage of households with unmarried partners: This zip code:
4.0%Washington:
48.7%
Likely homosexual households (counted as self-reported same-sex unmarried-partner households)
Lesbian couples: 0.2% of all households Gay men: 0.5% of all households
Household received Food Stamps/SNAP in the past 12 months: 178Household did not receive Food Stamps/SNAP in the past 12 months: 8,556
Women who had a birth in the past 12 months: 140 (124 now married , 17 unmarried) Women who did not have a birth in the past 12 months: 4,639 (3,167 now married , 1,439 unmarried)
Housing units in zip code 98053 with a mortgage: 4,856 (665
second mortgage , 20
home equity loan , 571
both second mortgage and home equity loan )
Houses without a mortgage: 62
Median monthly owner costs for units with a mortgage: $3,671
Median monthly owner costs for units without a mortgage: $1,126
Residents with income below the poverty level in 2022:
This zip code:
4.7%Whole state:
10.0%
Residents with income below 50% of the poverty level in 2022:
This zip code:
0.4%Whole state:
4.6%
Median number of rooms in houses and condos: Median number of rooms in apartments: Notable locations in this zip code not listed on our city pages
Click to draw/clear zip code borders Notable locations in zip code 98053: (A) , King County Fire Protection District 34 Redmond Fire Department Station 18 (B) , King County Fire Protection District 34 Redmond Fire Department Station 14 (C) , King County Fire Protection District 34 Redmond Fire Department Station 13 (D) , Vincent Community Club (E) . Display/hide their locations on the map
Churches in zip code 98053 include: (A) , Union Hill Church (B) , Timberlake Christian Fellowship Church (C) . Display/hide their locations on the map
Lakes and reservoirs: (A) , Ames Lake Pothole (B) , Peterson Pond (C) , Redmond Reservoir (D) . Display/hide their locations on the map
Parks in zip code 98053 include: (1) , Farrel McWhirter Park (2) . Display/hide their locations on the map
Year house built (houses)
0 2020 or later1,199 2010 to 20193,892 2000 to 20091,330 1990 to 19991,321 1980 to 1989783 1970 to 1979188 1960 to 1969102 1950 to 195919 1940 to 1949132 1939 or earlier
Zip code 98053 household income distribution in 2022 215 Less than $10,000147 $10,000 to $14,99917 $15,000 to $19,99940 $20,000 to $24,999164 $25,000 to $29,999181 $30,000 to $34,99989 $35,000 to $39,999193 $40,000 to $44,999154 $45,000 to $49,999216 $50,000 to $59,999266 $60,000 to $74,999730 $75,000 to $99,999510 $100,000 to $124,999648 $125,000 to $149,9991,222 $150,000 to $199,9994,115 $200,000 or moreEstimate of home value of owner-occupied houses/condos in 2022 in zip code 98053 60 Less than $10,0009 $70,000 to $79,99910 $80,000 to $89,99910 $90,000 to $99,99919 $100,000 to $124,99912 $150,000 to $174,9995 $200,000 to $249,9995 $250,000 to $299,99913 $300,000 to $399,999303 $400,000 to $499,9991,268 $500,000 to $749,9992,021 $750,000 to $999,9993,374 $1,000,000 to $1,499,9991,791 $1,500,000 to $1,999,999904 $2,000,000 or moreRent paid by renters in 2022 in zip code 98053 7 $800 to $89922 $1,250 to $1,499522 $1,500 to $1,999148 $2,000 to $2,499171 $2,500 to $2,999342 $3,000 to $3,49983 $3,500 or more74 No cash rent
Median gross rent in 2022: $2,569.
Median price asked for vacant for-sale houses and condos in 2022: $548,549.
Estimated median house (or condo) value in 2022 for: White Non-Hispanic householders: $1,309,864Black or African American householders: $1,297,909American Indian or Alaska Native householders: $1,321,820Asian householders: $1,259,054Some other race householders: $1,583,344Two or more races householders: $1,179,102Hispanic or Latino householders: $1,155,565Estimated median house or condo value in 2022: $1,301,646
98053:
$1,301,646Washington:
$569,500
Lower value quartile - upper value quartile: $963,772 - $1,672,289
Mean price in 2022: Detached houses: $1,294,933Here:
$1,294,933State:
$734,307
Townhouses or other attached units: $883,037Here:
$883,037State:
$657,697
In 5-or-more-unit structures: $673,434Here:
$673,434State:
$503,183
Mobile homes: $104,563Here:
$104,563State:
$218,362
Housing units in structures:
One, detached: 7,138One, attached: 927Two: 193 or 4: 965 to 9: 7810 to 19: 16120 to 49: 14250 or more: 300Mobile homes: 133Unemployment : 3.9%
Means of transportation to work in zip code 98053 50.8% 4,979 Drove a car alone5.9% 574 Carpooled2.1% 202 Bus or trolley bus0.1% 6 Motorcycle0.4% 41 Bicycle0.4% 40 Walked0.6% 56 Other means47.5% 4,663 Worked at homeTravel time to work (commute) in zip code 98053 52 Less than 5 minutes307 5 to 9 minutes403 10 to 14 minutes653 15 to 19 minutes819 20 to 24 minutes466 25 to 29 minutes1,249 30 to 34 minutes318 35 to 39 minutes437 40 to 44 minutes601 45 to 59 minutes382 60 to 89 minutes221 90 or more minutes
Neighborhoods in zip code 98053: Percentage of zip code residents living and working in this county: 98.8%
Household type by relationship:
Households: 23,052
Male householders: 5,495 (731 living alone ), Female householders: 3,214 (1,001 living alone )6,256 spouses (6,224 opposite-sex spouses ), 309 unmarried partners , (263 opposite-sex unmarried partners ), 6,901 children (6,837 natural , 62 adopted , 0 stepchildren ), 57 grandchildren , 9 brothers or sisters , 353 parents , 0 foster children , 125 other relatives , 254 non-relatives In group quarters: 19 (-1 institutionalized population )
Size of family households: 2,911 2-persons , 1,339 3-persons , 1,800 4-persons , 365 5-persons , 85 6-persons , 144 7-or-more-persons
Size of nonfamily households: 1,732 1-person , 234 2-persons , 40 3-persons , 2 6-persons
5,177 married couples with children. single-parent households (335 men , 119 women ).
70.3% of residents of 98053 zip code speak English at home. of residents speak Spanish at home (86% very well, 3% well, 8% not well, 3% not at all ).of residents speak other Indo-European language at home (90% very well, 8% well, 2% not well ).of residents speak Asian or Pacific Island language at home (81% very well, 16% well, 3% not well ).of residents speak other language at home (54% very well, 21% well, 25% not well ).
Foreign born population: 6,778 (29.4%)
(39.8%
of them are naturalized citizens )
This zip code:
29.4%Whole state:
15.3%
46% Bhutan 5% Israel 4% Sweden 3% Japan 3% Romania 3% Bolivia 2% Taiwan 9% English 7% European 5% German 4% American 3% Jordanian 3% Norwegian 2% Irish
Year of entry for the foreign-born population
4,156 2010 or later 1,667 2000 to 2009 781 1990 to 1999 842 Before 1990
Facilities with environmental interests located in this zip code:
BP SITE 03122 (721 228TH AVE NE in REDMOND, WA)
Conditionally Exempt Small Quantity Generators, less than 100 kg/month of hazardous waste (Resource Conservation and Recovery Act (tracking hazardous waste)) STATE MASTER (Washington State Department of Ecology's Facility/Site identification system) - TOXICS-9504, LEAKING STORAGE TANK, UNDERGROUND STORAGE TANK PROGRAM, HAZWASTE-WAD988488714, EPCRA, CESQG Business SIC classification: GASOLINE SERVICE STATIONSOrganizations: BP SS (CONTACT/ HAZARDOUS WASTE)
, LYNN CHUN (CONTACT/OPERATOR)
, TOSCO NORTHWEST CO (CONTACT/OWNER)
Alternative names: EXXON CO USA REDMOND
BP SERVICE STATION 11059 (740 228TH AVENUE NORTHEAST in REDMOND, WA)
Conditionally Exempt Small Quantity Generators, less than 100 kg/month of hazardous waste (Resource Conservation and Recovery Act (tracking hazardous waste)) STATE MASTER (Washington State Department of Ecology's Facility/Site identification system) - HAZWASTE-WAD988487112, HAZARDOUS WASTE PROGRAM, TOXICS-10163, UNDERGROUND STORAGE TANK PROGRAM, HAZWASTE-WAD988487112, EPCRA Business SIC classification: GASOLINE SERVICE STATIONSOrganizations: ROGER TESKE (CONTACT/OPERATOR)
, CONOCOPHILLIPS COMPANY (CONTACT/OWNER)
Alternative names: TOSCO 1105930123
ALCOTT ELEMENTARY (4213 228TH AVE NE in REDMOND, WA)
(National Center for Education Statistics) - STATE ID-4256 Organizations: LAKE WASHINGTON SCH DIST 414 (SCHOOL DISTRICT)
DUSTCOATING INC (2773 152ND AVE NE in REDMOND, SD)
AIR SYNTHETIC MINOR (AIRS/AFS) Business SIC classification: HEAVY CONSTRUCTION
Housing units lacking complete plumbing facilities: 0.9%
Housing units lacking complete kitchen facilities: 0.6%
69.8% Utility gas 24.4% Electricity 3.0% Bottled, tank, or LP gas 1.5% Wood 0.8% No fuel used
Population in 1990: 22,112. Population change in the 1990s: +9,091 (+41.1%).
Place of birth for U.S.-born residents:
This state: 8,093Northeast: 1,077Midwest: 2,049South: 1,175West: 3,631
52% of the 98053 zip code residents lived in the same house 5 years ago.
Out of people who lived in different houses, 59% lived in this county.
Out of people who lived in different counties, 50% lived in Washington.
90% of the 98053 zip code residents lived in the same house 1 year ago.
Out of people who lived in different houses, 52% moved from this county.
Out of people who lived in different houses, 5% moved from different county within same state.
Out of people who lived in different houses, 19% moved from different state.
Out of people who lived in different houses, 28% moved from abroad.
Private vs. public school enrollment:
Students in private schools in grades 1 to 8 (elementary and middle school): 335
Here:
12.5%Washington:
12.4%
Students in private schools in grades 9 to 12 (high school): 223
Here:
18.5%Washington:
9.2%
Students in private undergraduate colleges: 52
Here:
14.2%Washington:
16.5%
Occupation by median earnings in the past 12 months ($)
222,857 Computer and mathematical occupations 178,803 Management occupations 174,573 Architecture and engineering occupations 134,271 Installation, maintenance, and repair occupations 128,722 Law enforcement workers including supervisors 118,769 Sales and related occupations
Companies with federal contracts located in this zip code:
FIELDS, RICHARD PHD (23316 NE REDMOND FALL CITY in REDMOND, WA)
$145,881 with Air Force for Other Education and Training Services. Signed on 2005-08-19. Completion date: 2006-08-22.
WATSON ASPHALT PAVING CO INC (19220 NE 80TH ST in REDMOND, WA; small business)
$7,850 with U.S. Army Corps of Engineers - civil program financing only for Mineral Construction Materials, Bulk. Signed on 2003-08-20. Completion date: 2003-08-29.
Top industries in this zip code by the number of employees in 2005:
Educational Services: Elementary and Secondary Schools (100-249 employees: 2 establishments)Administrative and Support and Waste Management and Remediation Services: Landscaping Services (50-99: 1, 20-49: 2, 10-19: 4, 5-9: 3, 1-4: 11)Construction: Roofing Contractors (100-249: 1, 10-19: 1, 1-4: 4)Professional, Scientific, and Technical Services: Computer Systems Design Services (100-249: 1, 5-9: 1, 1-4: 5)Professional, Scientific, and Technical Services: Landscape Architectural Services (50-99: 1, 20-49: 1)Construction: Painting and Wall Covering Contractors (20-49: 1, 10-19: 2, 5-9: 4, 1-4: 3)Construction: Site Preparation Contractors (20-49: 1, 10-19: 2, 1-4: 6)Accommodation and Food Services: Full-Service Restaurants (20-49: 2)Construction: New Single-Family Housing Construction (except Operative Builders) (5-9: 3, 1-4: 22)
People in group quarters in 2010:
7 people in nursing facilities/skilled-nursing facilities
Fatal accident statistics in 2014:
Fatal accident count: 2Vehicles involved in fatal accidents: 4Fatal accidents caused by drunken drivers: 1Fatalities: 3Persons involved in fatal accidents: 5Pedestrians involved in fatal accidents: 1
Fatal accident statistics in 2013:
Fatal accident count: 1Vehicles involved in fatal accidents: 1Fatal accidents caused by drunken drivers: 0Fatalities: 1Persons involved in fatal accidents: 2Pedestrians involved in fatal accidents: 1
Home Mortgage Disclosure Act Aggregated Statistics For Year 2009(Based on 4 full and 10 partial tracts) A) FHA, FSA/RHS & VA B) Conventional C) Refinancings D) Home Improvement Loans E) Loans on Dwellings For 5+ Families F) Non-occupant Loans on G) Loans On Manufactured Number Average Value Number Average Value Number Average Value Number Average Value Number Average Value Number Average Value Number Average Value
LOANS ORIGINATED 224 $379,111 633 $404,132 4,159 $340,169 90 $278,521 2 $31,825,955 93 $304,501 19 $216,087 APPLICATIONS APPROVED, NOT ACCEPTED 29 $368,086 91 $381,476 385 $362,175 7 $152,499 0 $0 12 $331,945 1 $209,570 APPLICATIONS DENIED 31 $364,865 98 $476,436 628 $405,952 26 $216,581 0 $0 29 $410,681 4 $266,470 APPLICATIONS WITHDRAWN 20 $414,630 63 $436,392 718 $387,633 21 $234,946 1 $443,870 39 $281,296 2 $277,480 FILES CLOSED FOR INCOMPLETENESS 6 $396,377 17 $310,183 127 $374,148 5 $152,778 0 $0 9 $321,054 0 $0
Aggregated Statistics For Year 2008(Based on 4 full and 10 partial tracts) A) FHA, FSA/RHS & VA B) Conventional C) Refinancings D) Home Improvement Loans F) Non-occupant Loans on G) Loans On Manufactured Number Average Value Number Average Value Number Average Value Number Average Value Number Average Value Number Average Value
LOANS ORIGINATED 74 $444,040 770 $427,780 1,439 $373,195 72 $231,449 52 $341,445 22 $234,715 APPLICATIONS APPROVED, NOT ACCEPTED 7 $479,260 137 $431,673 241 $401,914 24 $94,693 10 $304,872 4 $223,738 APPLICATIONS DENIED 15 $407,496 131 $475,121 394 $440,623 45 $137,090 19 $484,698 11 $154,075 APPLICATIONS WITHDRAWN 13 $386,261 95 $484,319 316 $385,896 16 $215,579 12 $248,674 6 $239,412 FILES CLOSED FOR INCOMPLETENESS 1 $286,670 23 $567,600 68 $400,960 7 $215,636 3 $182,683 1 $433,620
Aggregated Statistics For Year 2007(Based on 4 full and 10 partial tracts) A) FHA, FSA/RHS & VA B) Conventional C) Refinancings D) Home Improvement Loans F) Non-occupant Loans on G) Loans On Manufactured Number Average Value Number Average Value Number Average Value Number Average Value Number Average Value Number Average Value
LOANS ORIGINATED 12 $333,265 1,402 $399,581 1,518 $376,342 134 $194,211 114 $335,269 27 $210,440 APPLICATIONS APPROVED, NOT ACCEPTED 1 $249,210 254 $371,858 239 $389,499 31 $162,230 19 $365,988 3 $146,787 APPLICATIONS DENIED 0 $0 193 $401,827 397 $426,326 63 $189,273 28 $352,543 13 $159,467 APPLICATIONS WITHDRAWN 1 $454,270 114 $369,610 284 $397,661 22 $274,810 15 $372,257 1 $293,170 FILES CLOSED FOR INCOMPLETENESS 0 $0 31 $481,547 67 $420,720 12 $220,276 6 $502,123 0 $0
Aggregated Statistics For Year 2006(Based on 4 full and 10 partial tracts) A) FHA, FSA/RHS & VA B) Conventional C) Refinancings D) Home Improvement Loans E) Loans on Dwellings For 5+ Families F) Non-occupant Loans on G) Loans On Manufactured Number Average Value Number Average Value Number Average Value Number Average Value Number Average Value Number Average Value Number Average Value
LOANS ORIGINATED 4 $288,810 1,982 $353,185 1,550 $348,859 175 $195,972 1 $48,940 164 $309,535 16 $186,746 APPLICATIONS APPROVED, NOT ACCEPTED 2 $250,765 243 $359,154 231 $325,906 23 $271,725 0 $0 18 $262,444 7 $193,999 APPLICATIONS DENIED 1 $144,430 276 $356,442 426 $399,794 55 $187,576 0 $0 43 $331,787 11 $160,921 APPLICATIONS WITHDRAWN 1 $248,000 179 $336,743 332 $342,167 24 $140,075 0 $0 20 $246,179 4 $247,018 FILES CLOSED FOR INCOMPLETENESS 0 $0 38 $331,927 63 $403,737 13 $151,467 0 $0 0 $0 2 $146,935
Aggregated Statistics For Year 2005(Based on 4 full and 10 partial tracts) A) FHA, FSA/RHS & VA B) Conventional C) Refinancings D) Home Improvement Loans F) Non-occupant Loans on G) Loans On Manufactured Number Average Value Number Average Value Number Average Value Number Average Value Number Average Value Number Average Value
LOANS ORIGINATED 12 $240,858 2,179 $343,716 1,917 $328,805 124 $164,152 129 $268,874 28 $213,544 APPLICATIONS APPROVED, NOT ACCEPTED 0 $0 264 $348,994 268 $316,878 23 $172,599 17 $339,174 5 $226,902 APPLICATIONS DENIED 2 $252,795 231 $327,985 502 $309,182 57 $132,146 26 $244,853 14 $238,288 APPLICATIONS WITHDRAWN 0 $0 203 $358,323 377 $331,591 39 $150,775 29 $247,693 2 $84,885 FILES CLOSED FOR INCOMPLETENESS 0 $0 43 $283,559 189 $347,876 10 $120,724 2 $189,840 2 $255,235
Aggregated Statistics For Year 2004(Based on 4 full and 10 partial tracts) A) FHA, FSA/RHS & VA B) Conventional C) Refinancings D) Home Improvement Loans F) Non-occupant Loans on G) Loans On Manufactured Number Average Value Number Average Value Number Average Value Number Average Value Number Average Value Number Average Value
LOANS ORIGINATED 26 $239,532 2,305 $302,449 2,246 $300,826 109 $155,114 128 $248,214 26 $147,922 APPLICATIONS APPROVED, NOT ACCEPTED 3 $185,553 227 $309,255 231 $287,557 18 $75,771 20 $288,512 3 $189,213 APPLICATIONS DENIED 4 $190,865 207 $296,871 500 $310,300 51 $132,013 26 $257,001 10 $154,388 APPLICATIONS WITHDRAWN 1 $193,890 193 $279,268 408 $303,713 28 $175,987 15 $325,062 3 $159,217 FILES CLOSED FOR INCOMPLETENESS 2 $227,750 39 $255,395 235 $311,551 6 $154,870 5 $265,968 1 $209,570
Aggregated Statistics For Year 2003(Based on 4 full and 10 partial tracts) A) FHA, FSA/RHS & VA B) Conventional C) Refinancings D) Home Improvement Loans E) Loans on Dwellings For 5+ Families F) Non-occupant Loans on Number Average Value Number Average Value Number Average Value Number Average Value Number Average Value Number Average Value
LOANS ORIGINATED 39 $222,863 2,419 $281,922 6,325 $264,835 81 $85,285 1 $17,000,000 127 $221,082 APPLICATIONS APPROVED, NOT ACCEPTED 2 $219,710 204 $272,530 655 $256,153 17 $136,633 0 $0 14 $225,336 APPLICATIONS DENIED 7 $209,036 190 $282,345 773 $283,213 34 $49,018 0 $0 25 $246,700 APPLICATIONS WITHDRAWN 5 $195,424 171 $275,296 545 $296,674 13 $66,991 0 $0 18 $237,154 FILES CLOSED FOR INCOMPLETENESS 1 $237,000 29 $261,178 125 $271,704 1 $72,640 0 $0 2 $76,665
Aggregated Statistics For Year 2002(Based on 2 partial tracts) A) FHA, FSA/RHS & VA B) Conventional C) Refinancings D) Home Improvement Loans F) Non-occupant Loans on Number Average Value Number Average Value Number Average Value Number Average Value Number Average Value
LOANS ORIGINATED 4 $213,825 119 $274,414 407 $276,471 7 $64,721 9 $214,146 APPLICATIONS APPROVED, NOT ACCEPTED 0 $0 8 $225,931 39 $339,399 1 $185,550 1 $346,050 APPLICATIONS DENIED 0 $0 16 $319,554 46 $256,629 5 $149,526 2 $216,025 APPLICATIONS WITHDRAWN 1 $153,050 5 $375,982 37 $272,216 1 $50,790 1 $302,030 FILES CLOSED FOR INCOMPLETENESS 0 $0 3 $185,100 10 $241,490 1 $40,630 0 $0
Aggregated Statistics For Year 2001(Based on 2 partial tracts) A) FHA, FSA/RHS & VA B) Conventional C) Refinancings D) Home Improvement Loans F) Non-occupant Loans on Number Average Value Number Average Value Number Average Value Number Average Value Number Average Value
LOANS ORIGINATED 4 $185,722 108 $258,170 273 $266,856 11 $72,953 9 $190,218 APPLICATIONS APPROVED, NOT ACCEPTED 0 $0 7 $285,004 25 $264,568 1 $189,620 1 $130,020 APPLICATIONS DENIED 1 $98,190 18 $248,081 30 $281,512 5 $97,652 1 $130,020 APPLICATIONS WITHDRAWN 0 $0 10 $247,991 28 $225,725 1 $27,090 1 $260,040 FILES CLOSED FOR INCOMPLETENESS 0 $0 1 $671,780 7 $324,863 1 $60,950 0 $0
Aggregated Statistics For Year 2000(Based on 2 partial tracts) A) FHA, FSA/RHS & VA B) Conventional C) Refinancings D) Home Improvement Loans E) Loans on Dwellings For 5+ Families F) Non-occupant Loans on Number Average Value Number Average Value Number Average Value Number Average Value Number Average Value Number Average Value
LOANS ORIGINATED 4 $192,495 135 $257,456 55 $224,055 20 $38,668 1 $10,699,760 7 $225,604 APPLICATIONS APPROVED, NOT ACCEPTED 1 $236,340 18 $280,248 14 $243,356 4 $25,395 0 $0 1 $88,040 APPLICATIONS DENIED 0 $0 17 $266,697 14 $215,156 7 $33,280 0 $0 1 $363,660 APPLICATIONS WITHDRAWN 0 $0 16 $236,342 9 $238,826 1 $680 0 $0 0 $0 FILES CLOSED FOR INCOMPLETENESS 0 $0 4 $345,032 7 $187,779 0 $0 0 $0 0 $0
Aggregated Statistics For Year 1999(Based on 4 partial tracts) A) FHA, FSA/RHS & VA B) Conventional C) Refinancings D) Home Improvement Loans E) Loans on Dwellings For 5+ Families F) Non-occupant Loans on Number Average Value Number Average Value Number Average Value Number Average Value Number Average Value Number Average Value
LOANS ORIGINATED 16 $183,725 854 $250,341 803 $215,631 141 $37,947 0 $0 43 $168,091 APPLICATIONS APPROVED, NOT ACCEPTED 1 $160,110 78 $273,895 97 $219,905 22 $26,577 0 $0 1 $180,530 APPLICATIONS DENIED 1 $121,970 78 $216,960 137 $229,233 30 $43,236 1 $100,810 9 $161,642 APPLICATIONS WITHDRAWN 3 $244,373 89 $267,924 117 $198,892 10 $78,088 0 $0 3 $202,640 FILES CLOSED FOR INCOMPLETENESS 0 $0 12 $252,676 47 $230,430 4 $28,518 0 $0 4 $187,982
Private Mortgage Insurance Companies Aggregated Statistics For Year 2009(Based on 4 full and 10 partial tracts) A) Conventional B) Refinancings D) Loans On Manufactured Number Average Value Number Average Value Number Average Value
LOANS ORIGINATED 83 $375,310 28 $383,004 0 $0 APPLICATIONS APPROVED, NOT ACCEPTED 22 $368,933 20 $359,928 0 $0 APPLICATIONS DENIED 7 $303,971 17 $389,518 1 $185,550 APPLICATIONS WITHDRAWN 4 $321,085 10 $387,013 0 $0 FILES CLOSED FOR INCOMPLETENESS 1 $274,260 1 $417,000 0 $0
Aggregated Statistics For Year 2008(Based on 4 full and 10 partial tracts) A) Conventional B) Refinancings C) Non-occupant Loans on Number Average Value Number Average Value Number Average Value
LOANS ORIGINATED 116 $402,733 36 $394,999 1 $119,140 APPLICATIONS APPROVED, NOT ACCEPTED 33 $415,668 16 $373,726 3 $343,433 APPLICATIONS DENIED 7 $422,387 6 $547,497 0 $0 APPLICATIONS WITHDRAWN 6 $426,335 2 $364,590 3 $393,327 FILES CLOSED FOR INCOMPLETENESS 1 $347,840 1 $250,560 1 $250,560
Aggregated Statistics For Year 2007(Based on 4 full and 10 partial tracts) A) Conventional B) Refinancings C) Non-occupant Loans on D) Loans On Manufactured Number Average Value Number Average Value Number Average Value Number Average Value
LOANS ORIGINATED 63 $397,257 18 $395,964 4 $396,840 3 $277,277 APPLICATIONS APPROVED, NOT ACCEPTED 6 $395,003 3 $418,890 0 $0 0 $0 APPLICATIONS DENIED 3 $336,583 0 $0 0 $0 2 $278,670 APPLICATIONS WITHDRAWN 4 $432,318 0 $0 1 $495,670 0 $0 FILES CLOSED FOR INCOMPLETENESS 5 $558,380 2 $346,620 0 $0 0 $0
Aggregated Statistics For Year 2006(Based on 4 full and 10 partial tracts) A) Conventional B) Refinancings C) Non-occupant Loans on D) Loans On Manufactured Number Average Value Number Average Value Number Average Value Number Average Value
LOANS ORIGINATED 51 $348,009 16 $387,469 3 $218,673 1 $155,080 APPLICATIONS APPROVED, NOT ACCEPTED 5 $328,962 9 $379,111 0 $0 0 $0 APPLICATIONS DENIED 4 $561,735 3 $401,443 0 $0 0 $0 APPLICATIONS WITHDRAWN 7 $434,826 1 $684,920 2 $265,705 0 $0 FILES CLOSED FOR INCOMPLETENESS 4 $560,458 0 $0 0 $0 0 $0
Aggregated Statistics For Year 2005(Based on 4 full and 10 partial tracts) A) Conventional B) Refinancings C) Non-occupant Loans on D) Loans On Manufactured Number Average Value Number Average Value Number Average Value Number Average Value
LOANS ORIGINATED 49 $355,239 19 $344,990 1 $223,000 1 $355,920 APPLICATIONS APPROVED, NOT ACCEPTED 8 $428,030 6 $358,783 0 $0 0 $0 APPLICATIONS DENIED 0 $0 0 $0 0 $0 0 $0 APPLICATIONS WITHDRAWN 9 $453,466 3 $568,857 1 $184,340 0 $0 FILES CLOSED FOR INCOMPLETENESS 1 $492,260 0 $0 0 $0 0 $0
Aggregated Statistics For Year 2004(Based on 4 full and 10 partial tracts) A) Conventional B) Refinancings C) Non-occupant Loans on D) Loans On Manufactured Number Average Value Number Average Value Number Average Value Number Average Value
LOANS ORIGINATED 89 $318,845 50 $275,375 5 $267,462 3 $231,707 APPLICATIONS APPROVED, NOT ACCEPTED 29 $301,215 23 $296,172 1 $300,000 0 $0 APPLICATIONS DENIED 0 $0 1 $312,000 0 $0 0 $0 APPLICATIONS WITHDRAWN 7 $255,776 8 $232,195 0 $0 1 $211,000 FILES CLOSED FOR INCOMPLETENESS 1 $140,860 1 $352,140 0 $0 0 $0
Aggregated Statistics For Year 2003(Based on 4 full and 10 partial tracts) A) Conventional B) Refinancings C) Non-occupant Loans on Number Average Value Number Average Value Number Average Value
LOANS ORIGINATED 182 $279,127 148 $273,054 5 $208,872 APPLICATIONS APPROVED, NOT ACCEPTED 23 $287,047 64 $300,326 0 $0 APPLICATIONS DENIED 4 $285,355 1 $392,220 0 $0 APPLICATIONS WITHDRAWN 9 $238,868 6 $282,460 3 $253,103 FILES CLOSED FOR INCOMPLETENESS 0 $0 0 $0 0 $0
Aggregated Statistics For Year 2002(Based on 2 partial tracts) A) Conventional B) Refinancings C) Non-occupant Loans on Number Average Value Number Average Value Number Average Value
LOANS ORIGINATED 15 $260,722 15 $281,715 1 $141,530 APPLICATIONS APPROVED, NOT ACCEPTED 1 $341,310 1 $402,930 0 $0 APPLICATIONS DENIED 0 $0 0 $0 0 $0 APPLICATIONS WITHDRAWN 1 $333,860 1 $326,410 0 $0 FILES CLOSED FOR INCOMPLETENESS 0 $0 0 $0 0 $0
Aggregated Statistics For Year 2001(Based on 2 partial tracts) A) Conventional B) Refinancings Number Average Value Number Average Value
LOANS ORIGINATED 17 $269,286 9 $239,804 APPLICATIONS APPROVED, NOT ACCEPTED 3 $241,987 1 $247,860 APPLICATIONS DENIED 1 $420,540 0 $0 APPLICATIONS WITHDRAWN 1 $177,430 0 $0 FILES CLOSED FOR INCOMPLETENESS 0 $0 0 $0
Aggregated Statistics For Year 2000(Based on 2 partial tracts) A) Conventional B) Refinancings C) Non-occupant Loans on Number Average Value Number Average Value Number Average Value
LOANS ORIGINATED 19 $225,971 2 $316,930 1 $120,540 APPLICATIONS APPROVED, NOT ACCEPTED 5 $306,636 0 $0 0 $0 APPLICATIONS DENIED 0 $0 1 $627,090 0 $0 APPLICATIONS WITHDRAWN 1 $121,900 0 $0 0 $0 FILES CLOSED FOR INCOMPLETENESS 0 $0 0 $0 0 $0
Aggregated Statistics For Year 1999(Based on 4 partial tracts) A) Conventional B) Refinancings C) Non-occupant Loans on Number Average Value Number Average Value Number Average Value
LOANS ORIGINATED 145 $260,890 18 $224,850 1 $140,780 APPLICATIONS APPROVED, NOT ACCEPTED 17 $238,565 7 $250,367 1 $100,810 APPLICATIONS DENIED 6 $260,638 3 $228,503 0 $0 APPLICATIONS WITHDRAWN 6 $279,707 1 $150,770 0 $0 FILES CLOSED FOR INCOMPLETENESS 1 $411,370 0 $0 0 $0
2003 - 2018 National Fire Incident Reporting System (NFIRS) incidents See full 2006 National Fire Incident Reporting System statistics for zip code 98053, Washington
Most common first names in zip code 98053 among deceased individuals Name Count Lived (average)
William 35 74.9 years John 20 80.9 years Mary 19 84.7 years James 18 69.1 years Robert 16 79.8 years Dorothy 16 79.7 years Helen 13 84.8 years Jack 12 70.8 years Charles 12 76.8 years Donald 11 74.5 years
Most common last names in zip code 98053 among deceased individuals Last name Count Lived (average)
Nelson 10 81.6 years Brown 8 79.6 years Jackson 7 81.9 years Smith 7 75.4 years Henderson 6 75.6 years Anderson 5 67.6 years Taylor 5 78.8 years Davis 4 76.0 years Jones 4 75.2 years Edwards 4 79.0 years
Businesses in zip code 98053
Name Count Name Count
Albertsons 1 Quiznos 1 FedEx 1 Starbucks 2 Kroger 1 Subway 1 Lane Furniture 1 U-Haul 2 McDonald's 1 UPS 2 Nike 1

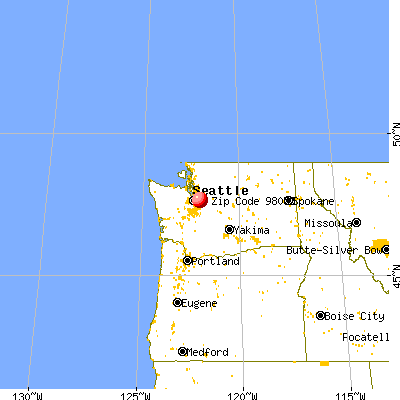


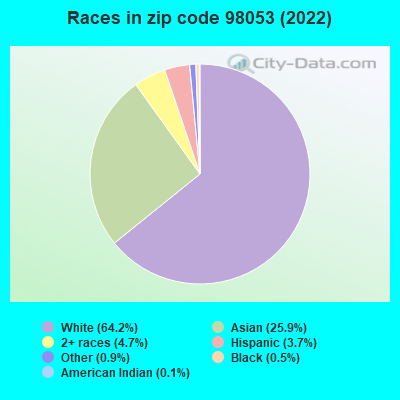


 Nearest zip codes: 98074, 98075, 98077, 98008, 98052, 98029.
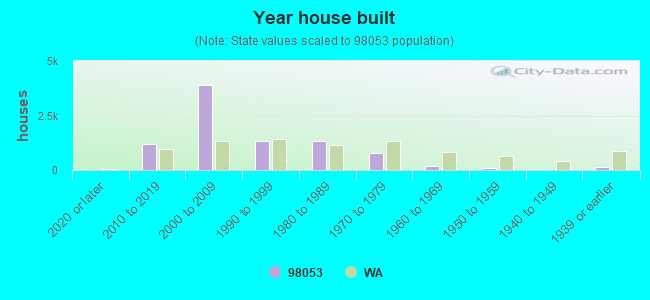

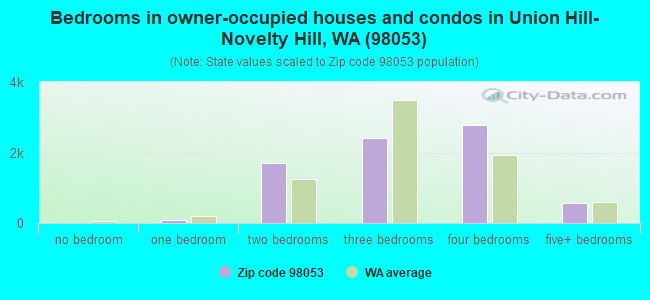
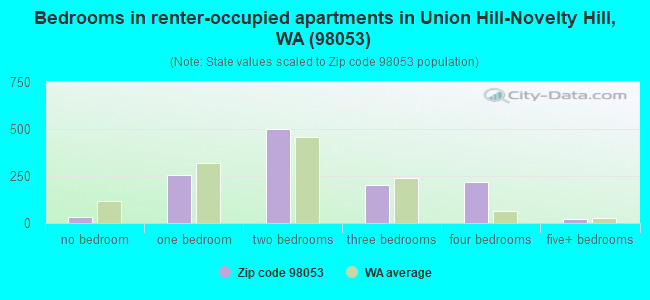
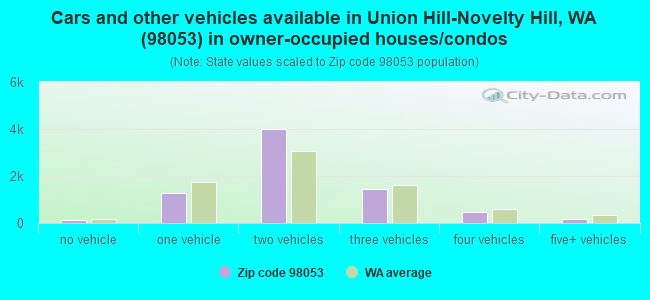
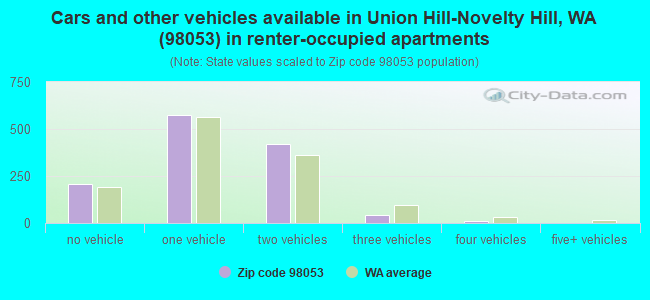


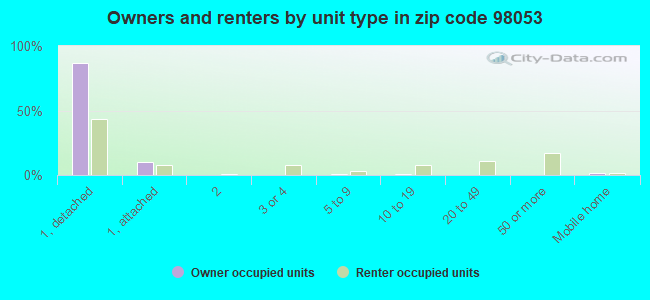
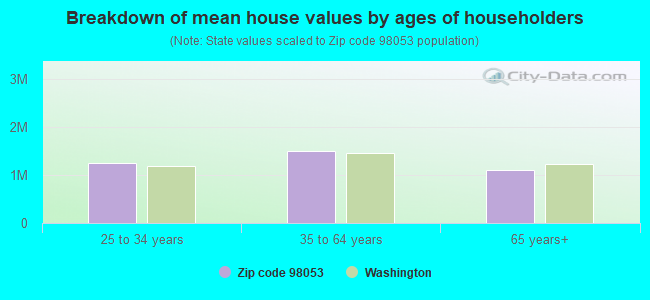


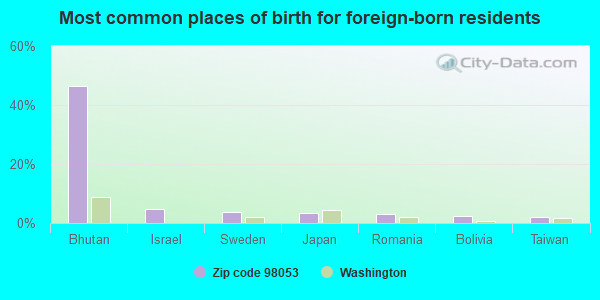
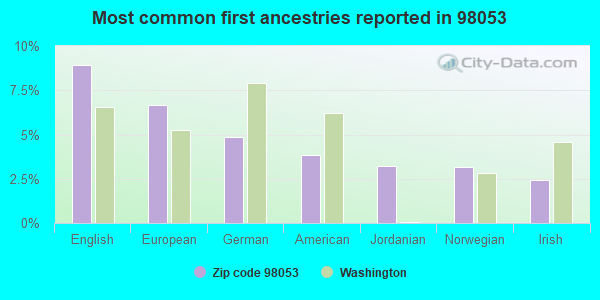
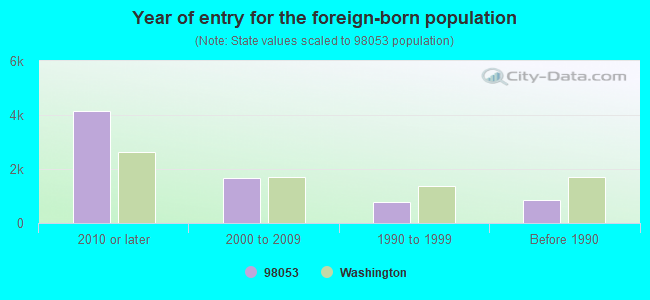


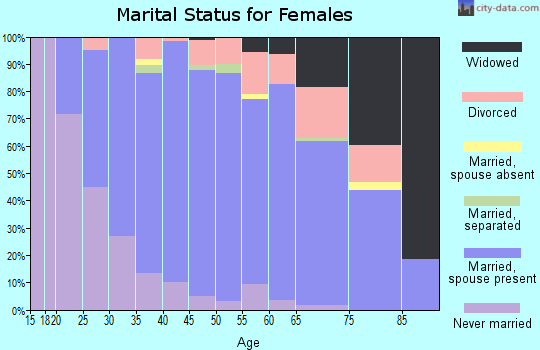
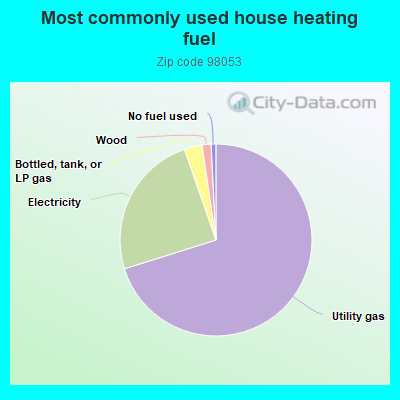
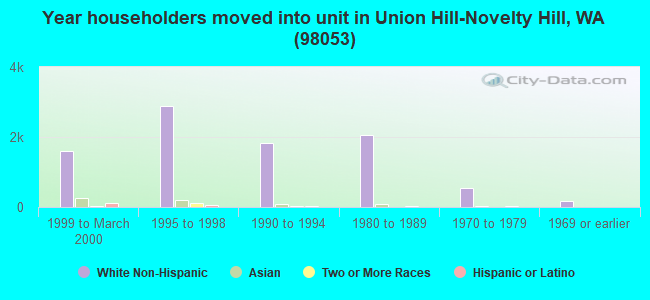
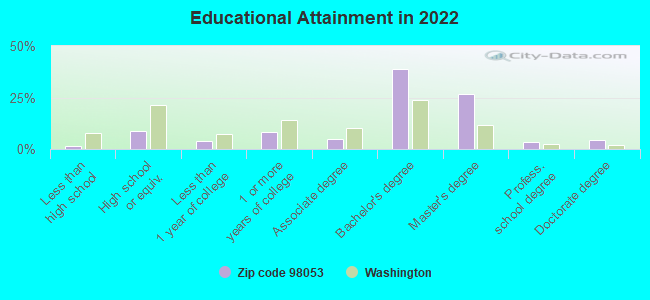
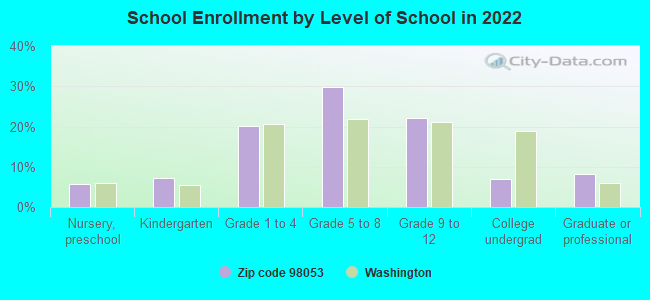
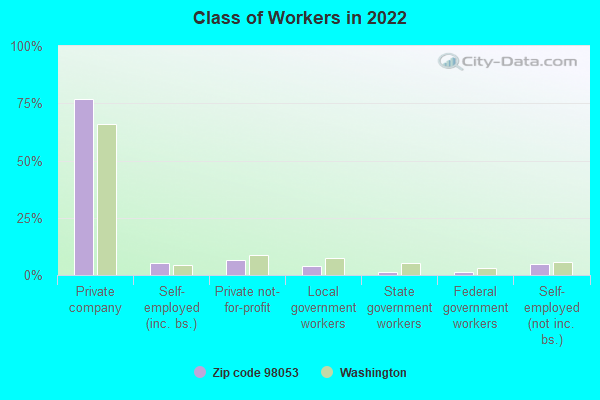
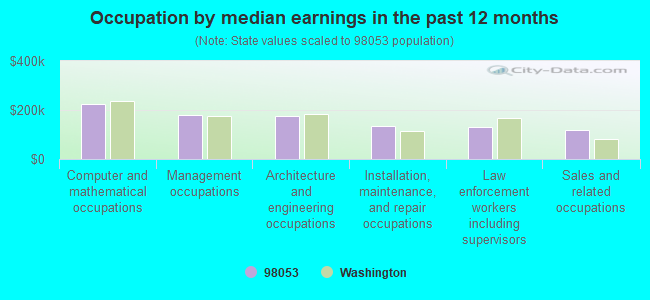
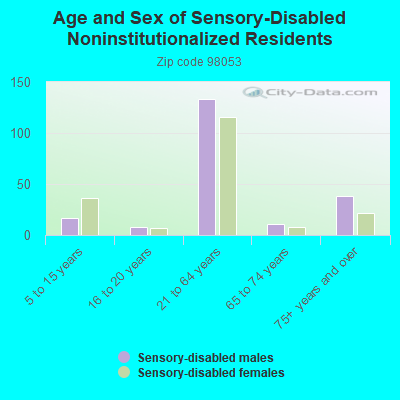
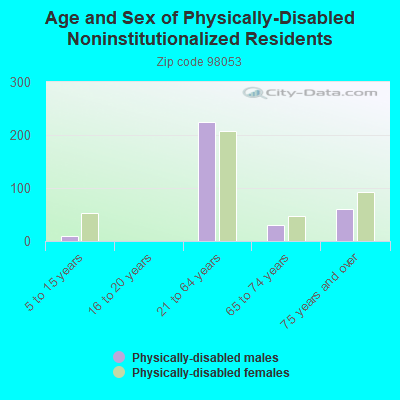
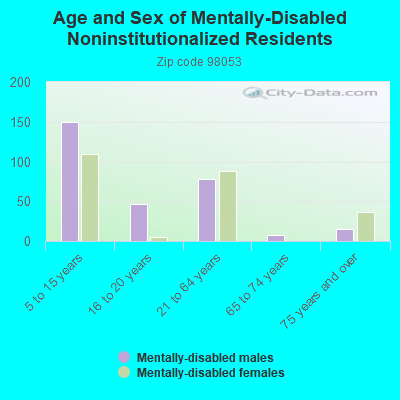
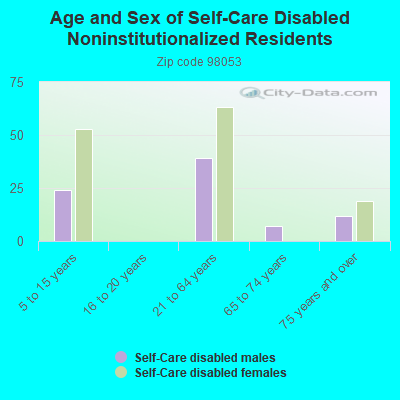
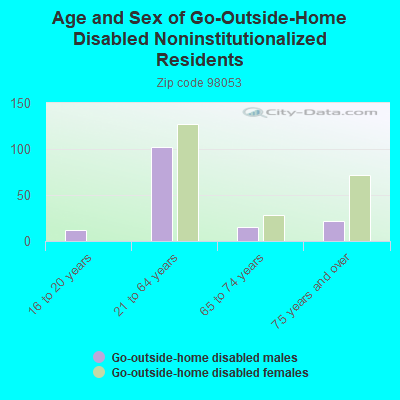
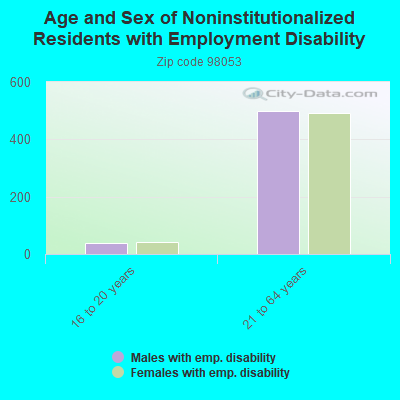
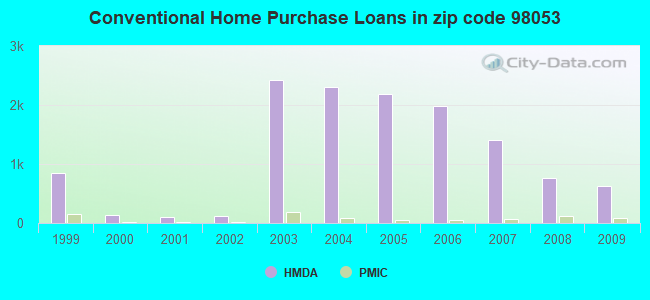
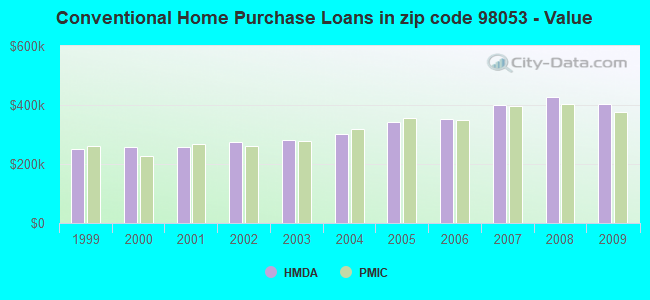
 According to the data from the years 2003 - 2018 the average number of fires per year is 39. The highest number of fire incidents - 55 took place in 2012, and the least - 19 in 2003. The data has an increasing trend.
 When looking into fire subcategories, the most incidents belonged to: Structure Fires (47.4%), and Outside Fires (32.5%).