Estimated zip code population in 2022: 24,993 Zip code population in 2010: 23,025 Zip code population in 2000: 20,308
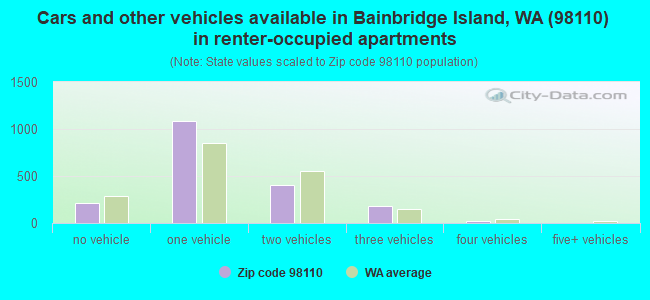
Houses and condos: 10,960 Renter-occupied apartments: 1,891
% of renters here:
19%
State:
36%
March 2022 cost of living index in zip code 98110: 111.4 (more than average, U.S. average is 100)
Land area: 27.6 sq. mi. Water area: 11.4 sq. mi.
Population density: 905 people per square mile
(low).
OSM Map
General Map
Google Map
MSN Map
OSM Map
General Map
Google Map
MSN Map
OSM Map
General Map
Google Map
MSN Map
OSM Map
General Map
Google Map
MSN Map
Please wait while loading the map...
Real estate property taxes paid for housing units in 2022:
This zip code:
0.7% ($7,935)
Washington:
0.8% ($4,283)
Median real estate property taxes paid for housing units with mortgages in 2022: $7,834 (0.6%) Median real estate property taxes paid for housing units with no mortgage in 2022: $8,168 (0.8%)
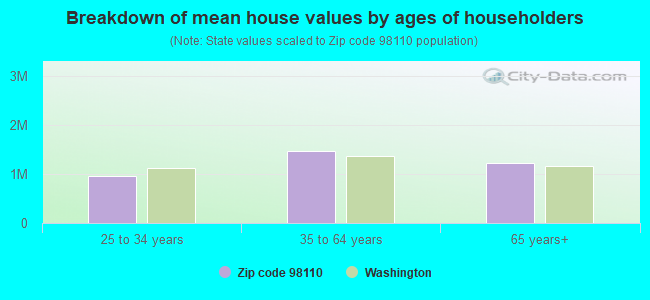
Estimated median house/condo value in 2022: $1,185,436
98110:
$1,185,436
Washington:
$569,500
According to our research of Washington and other state lists, there were 3 registered sex offenders living in 98110 zip code as of April 17, 2024. The ratio of all residents to sex offenders in zip code 98110 is 7,971 to 1. The ratio of registered sex offenders to all residents in this zip code is much lower than the state average.
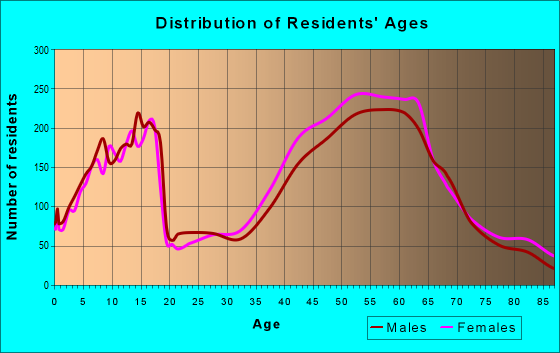
Median resident age:
This zip code:
50.0 years
Washington median age:
38.4 years
Average household size:
This zip code:
2.4 people
Washington:
2.5 people
Averages for the 2020 tax year for zip code 98110, filed in 2021:
Average Adjusted Gross Income (AGI) in 2020: $231,189 (Individual Income Tax Returns)
Here:
$231,189
State:
$99,264
Salary/wage: $160,708 (reported on 68.4% of returns)
Here:
$160,708
State:
$80,347
(% of AGI for various income ranges: 1059.6% for AGIs below $25k, 2981.2% for AGIs $25k-50k, 5161.0% for AGIs $50k-75k, 8052.8% for AGIs $75k-100k, 16547.5% for AGIs $100k-200k, 106810.6% for AGIs over 200k)
Taxable interest for individuals: $4,606 (reported on 59.0% of returns)
This zip code:
$4,606
Washington:
$2,077
(% of AGI for various income ranges: 60.8% for AGIs below $25k, 85.9% for AGIs $25k-50k, 198.0% for AGIs $50k-75k, 195.2% for AGIs $75k-100k, 359.6% for AGIs $100k-200k, 2604.7% for AGIs over 200k)
Ordinary dividends: $29,580 (reported on 52.6% of returns)
Here:
$29,580
State:
$10,013
(% of AGI for various income ranges: 160.7% for AGIs below $25k, 319.9% for AGIs $25k-50k, 634.7% for AGIs $50k-75k, 1002.0% for AGIs $75k-100k, 1361.5% for AGIs $100k-200k, 16777.1% for AGIs over 200k)
Net capital gain/loss in AGI: +$104,420 (reported on 50.7% of returns)
Here:
+$104,420
State:
+$40,092
(% of AGI for various income ranges: 124.7% for AGIs below $25k, 207.1% for AGIs $25k-50k, 511.1% for AGIs $50k-75k, 860.0% for AGIs $75k-100k, 1703.6% for AGIs $100k-200k, 65537.2% for AGIs over 200k)
Profit/loss from business: +$42,169 (reported on 23.3% of returns)
Here:
+$42,169
State:
+$18,312
(% of AGI for various income ranges: 196.6% for AGIs below $25k, 463.2% for AGIs $25k-50k, 664.7% for AGIs $50k-75k, 903.3% for AGIs $75k-100k, 1710.4% for AGIs $100k-200k, 8604.7% for AGIs over 200k)
Taxable individual retirement arrangement distribution: $40,298 (reported on 17.9% of returns)
98110:
$40,298
Washington:
$24,221
(% of AGI for various income ranges: 104.1% for AGIs below $25k, 264.7% for AGIs $25k-50k, 686.4% for AGIs $50k-75k, 1159.4% for AGIs $75k-100k, 1932.6% for AGIs $100k-200k, 5045.8% for AGIs over 200k)
Self-employed (Keogh) retirement plans: $29,302 (reported on 3.7% of returns)
98110:
$29,302
Washington:
$24,166
(% of AGI for various income ranges: 26.8% for AGIs $25k-50k, 60.7% for AGIs $75k-100k, 185.8% for AGIs $100k-200k, 1088.4% for AGIs over 200k)
Total itemized deductions: $48,745 (reported on 28.7% of returns)
Here:
$48,745
State:
$39,068
(% of AGI for various income ranges: 258.6% for AGIs below $25k, 525.8% for AGIs $25k-50k, 996.1% for AGIs $50k-75k, 1476.9% for AGIs $75k-100k, 2342.4% for AGIs $100k-200k, 12461.9% for AGIs over 200k)
Charity contributions: $21,373 (reported on 24.5% of returns)
Here:
$21,373
State:
$15,331
(% of AGI for various income ranges: 9.6% for AGIs below $25k, 40.5% for AGIs $25k-50k, 112.4% for AGIs $50k-75k, 228.5% for AGIs $75k-100k, 433.2% for AGIs $100k-200k, 5946.4% for AGIs over 200k)
Taxes paid: $9,027 (reported on 28.5% of returns)
98110:
$9,027
State:
$7,774
(% of AGI for various income ranges: 47.8% for AGIs below $25k, 103.9% for AGIs $25k-50k, 213.7% for AGIs $50k-75k, 368.5% for AGIs $75k-100k, 579.3% for AGIs $100k-200k, 1987.3% for AGIs over 200k)
Earned income credit: $1,364 (reported on 3.6% of returns)
Here:
$1,364
State:
$2,020
(% of AGI for various income ranges: 28.9% for AGIs below $25k, 23.8% for AGIs $25k-50k)
Percentage of individuals using paid preparers for their 2020 taxes: 90.9%
Here:
91%
State:
93%
(% for various income ranges: 86.9% for AGIs below $25k, 87.5% for AGIs $25k-50k, 89.8% for AGIs $50k-75k, 87.7% for AGIs $75k-100k, 92.7% for AGIs $100k-200k, 95.1% for AGIs over 200k)
Averages for the 2012 tax year for zip code 98110, filed in 2013:
Average Adjusted Gross Income (AGI) in 2012: $137,851 (Individual Income Tax Returns)
Here:
$137,851
State:
$69,533
Salary/wage: $96,479 (reported on 71.9% of returns)
Here:
$96,479
State:
$57,267
(% of AGI for various income ranges: 62.9% for AGIs below $25k, 61.1% for AGIs $25k-50k, 57.6% for AGIs $50k-75k, 58.6% for AGIs $75k-100k, 63.4% for AGIs $100k-200k, 42.6% for AGIs over 200k)
Taxable interest for individuals: $3,622 (reported on 56.6% of returns)
This zip code:
$3,622
Washington:
$1,816
(% of AGI for various income ranges: 3.3% for AGIs below $25k, 1.9% for AGIs $25k-50k, 1.6% for AGIs $50k-75k, 1.2% for AGIs $75k-100k, 1.3% for AGIs $100k-200k, 1.5% for AGIs over 200k)
Ordinary dividends: $19,475 (reported on 46.8% of returns)
Here:
$19,475
State:
$8,163
(% of AGI for various income ranges: 8.3% for AGIs below $25k, 4.9% for AGIs $25k-50k, 4.9% for AGIs $50k-75k, 4.4% for AGIs $75k-100k, 3.7% for AGIs $100k-200k, 8.2% for AGIs over 200k)
Net capital gain/loss in AGI: +$50,043 (reported on 42.6% of returns)
Here:
+$50,043
State:
+$21,568
(% of AGI for various income ranges: 1.9% for AGIs below $25k, 0.8% for AGIs $25k-50k, 2.1% for AGIs $50k-75k, 2.3% for AGIs $75k-100k, 3.5% for AGIs $100k-200k, 24.1% for AGIs over 200k)
Profit/loss from business: +$33,194 (reported on 24.0% of returns)
Here:
+$33,194
State:
+$16,521
(% of AGI for various income ranges: 14.2% for AGIs below $25k, 9.7% for AGIs $25k-50k, 8.4% for AGIs $50k-75k, 5.8% for AGIs $75k-100k, 6.3% for AGIs $100k-200k, 4.8% for AGIs over 200k)
Taxable individual retirement arrangement distribution: $31,534 (reported on 17.7% of returns)
98110:
$31,534
Washington:
$18,648
(% of AGI for various income ranges: 5.3% for AGIs below $25k, 5.1% for AGIs $25k-50k, 4.8% for AGIs $50k-75k, 6.8% for AGIs $75k-100k, 5.5% for AGIs $100k-200k, 3.0% for AGIs over 200k)
Self-employment retirement plans: $22,800 (reported on 3.5% of returns)
98110:
$22,800
Washington:
$20,087
(% of AGI for various income ranges: 0.8% for AGIs $50k-75k, 0.6% for AGIs $100k-200k, 0.6% for AGIs over 200k)
Total itemized deductions: $34,576 (16% of AGI, reported on 53.2% of returns)
Here:
$34,576
State:
$23,872
Here:
15.8% of AGI
State:
18.2% of AGI
(% of AGI for various income ranges: 26.7% for AGIs below $25k, 18.4% for AGIs $25k-50k, 19.6% for AGIs $50k-75k, 17.5% for AGIs $75k-100k, 16.7% for AGIs $100k-200k, 10.3% for AGIs over 200k)
Charity contributions: $7,317 (reported on 47.3% of returns)
Here:
$7,317
State:
$4,465
(% of AGI for various income ranges: 1.3% for AGIs below $25k, 1.5% for AGIs $25k-50k, 1.9% for AGIs $50k-75k, 1.7% for AGIs $75k-100k, 2.0% for AGIs $100k-200k, 2.9% for AGIs over 200k)
Taxes paid: $10,455 (reported on 52.7% of returns)
98110:
$10,455
State:
$6,400
(% of AGI for various income ranges: 6.1% for AGIs below $25k, 4.9% for AGIs $25k-50k, 5.3% for AGIs $50k-75k, 5.1% for AGIs $75k-100k, 5.2% for AGIs $100k-200k, 3.2% for AGIs over 200k)
Earned income credit: $1,452 (reported on 5.7% of returns)
Here:
$1,452
State:
$2,073
(% of AGI for various income ranges: 2.3% for AGIs below $25k, 0.3% for AGIs $25k-50k)
Percentage of individuals using paid preparers for their 2012 taxes: 47.2%
Here:
47%
State:
43%
(% for various income ranges: 33.7% for AGIs below $25k, 40.5% for AGIs $25k-50k, 46.9% for AGIs $50k-75k, 48.7% for AGIs $75k-100k, 50.6% for AGIs $100k-200k, 71.6% for AGIs over 200k)
Averages for the 2004 tax year for zip code 98110, filed in 2005:
Average Adjusted Gross Income (AGI) in 2004: $110,004 (Individual Income Tax Returns)
Here:
$110,004
State:
$54,331
Salary/wage: $76,165 (reported on 73.1% of returns)
Here:
$76,165
State:
$45,761
(% of AGI for various income ranges: 54.0% for AGIs $10k-25k, 62.5% for AGIs $25k-50k, 63.7% for AGIs $50k-75k, 66.0% for AGIs $75k-100k, 45.9% for AGIs over 100k)
Taxable interest for individuals: $3,850 (reported on 68.2% of returns)
This zip code:
$3,850
Washington:
$2,110
(% of AGI for various income ranges: 6.1% for AGIs $10k-25k, 3.2% for AGIs $25k-50k, 2.9% for AGIs $50k-75k, 2.4% for AGIs $75k-100k, 2.0% for AGIs over 100k)
Taxable dividends: $12,256 (reported on 53.0% of returns)
Here:
$12,256
State:
$5,879
(% of AGI for various income ranges: 8.2% for AGIs $10k-25k, 4.5% for AGIs $25k-50k, 4.8% for AGIs $50k-75k, 3.5% for AGIs $75k-100k, 6.1% for AGIs over 100k)
Net capital gain/loss: +$38,656 (reported on 47.2% of returns)
Here:
+$38,656
State:
+$15,835
(% of AGI for various income ranges: 1.4% for AGIs $10k-25k, 2.2% for AGIs $25k-50k, 2.9% for AGIs $50k-75k, 3.7% for AGIs $75k-100k, 20.4% for AGIs over 100k)
Profit/loss from business: +$26,477 (reported on 24.8% of returns)
Here:
+$26,477
State:
+$13,994
(% of AGI for various income ranges: 12.3% for AGIs $10k-25k, 10.0% for AGIs $25k-50k, 7.7% for AGIs $50k-75k, 7.0% for AGIs $75k-100k, 5.2% for AGIs over 100k)
IRA payment deduction: $3,494 (reported on 5.1% of returns)
98110:
$3,494
Washington:
$3,001
(% of AGI for various income ranges: 0.5% for AGIs $10k-25k, 0.6% for AGIs $25k-50k, 0.4% for AGIs $50k-75k, 0.3% for AGIs $75k-100k, 0.1% for AGIs over 100k)
Self-employed pension: $16,865 (reported on 4.3% of returns)
Here:
$16,865
Washington:
$14,244
(% of AGI for various income ranges: 0.4% for AGIs $25k-50k, 0.4% for AGIs $50k-75k, 0.6% for AGIs $75k-100k, 0.7% for AGIs over 100k)
Total itemized deductions: $27,302 (17% of AGI, reported on 56.0% of returns)
Here:
$27,302
State:
$19,669
Here:
16.8% of AGI
State:
20.7% of AGI
(% of AGI for various income ranges: 26.4% for AGIs $10k-25k, 22.8% for AGIs $25k-50k, 23.2% for AGIs $50k-75k, 21.2% for AGIs $75k-100k, 11.0% for AGIs over 100k)
Charity contributions deductions: $5,708 (3% of AGI, reported on 51.1% of returns)
Here:
$5,708
State:
$3,569
Here:
3.3% of AGI
State:
3.5% of AGI
(% of AGI for various income ranges: 2.1% for AGIs $10k-25k, 2.0% for AGIs $25k-50k, 2.2% for AGIs $50k-75k, 2.4% for AGIs $75k-100k, 2.8% for AGIs over 100k)
Total tax: $23,569 (reported on 83.5% of returns)
98110:
$23,569
State:
$9,065
(% of AGI for various income ranges: 5.5% for AGIs $10k-25k, 8.0% for AGIs $25k-50k, 9.2% for AGIs $50k-75k, 10.5% for AGIs $75k-100k, 20.3% for AGIs over 100k)
Earned income credit: $1,165 (reported on 4.7% of returns)
Here:
$1,165
State:
$1,607
Percentage of individuals using paid preparers for their 2004 taxes: 51.4%
Here:
51%
State:
49%
(% for various income ranges: 43.8% for AGIs below $10k, 46.1% for AGIs $10k-25k, 49.1% for AGIs $25k-50k, 50.8% for AGIs $50k-75k, 49.9% for AGIs $75k-100k, 60.7% for AGIs over 100k)
Likely homosexual households (counted as self-reported same-sex unmarried-partner households)
Lesbian couples: 0.1% of all households
Gay men: 0.6% of all households
Household received Food Stamps/SNAP in the past 12 months: 241 Household did not receive Food Stamps/SNAP in the past 12 months: 9,922
Women who had a birth in the past 12 months: 275 (235 now married, 42 unmarried) Women who did not have a birth in the past 12 months: 4,264 (2,005 now married, 2,255 unmarried)
Housing units in zip code 98110 with a mortgage: 5,019 (682 second mortgage, 25 home equity loan, 602 both second mortgage and home equity loan) Houses without a mortgage: 70
Median monthly owner costs for units with a mortgage: $3,275 Median monthly owner costs for units without a mortgage: $1,212
Residents with income below the poverty level in 2022:
This zip code:
3.0%
Whole state:
10.0%
Residents with income below 50% of the poverty level in 2022:
This zip code:
1.1%
Whole state:
4.6%
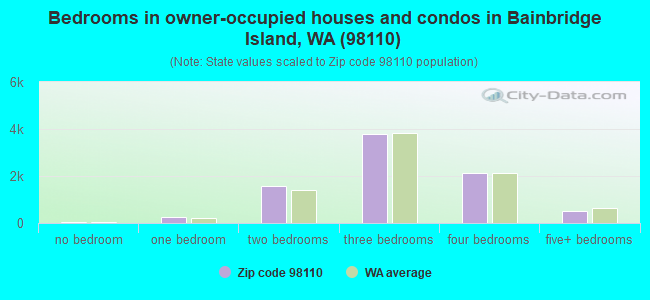
Median number of rooms in houses and condos:
Here:
7.0
State:
6.5
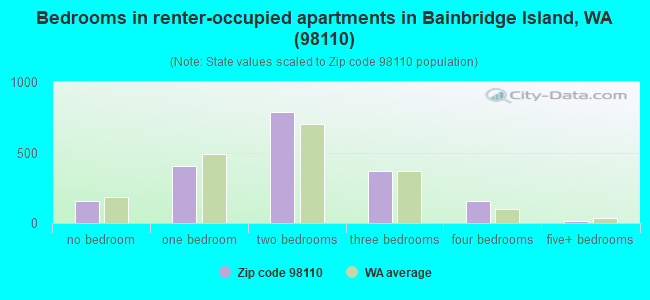
Median number of rooms in apartments:
Here:
4.0
State:
3.9
Notable locations in this zip code not listed on our city pages
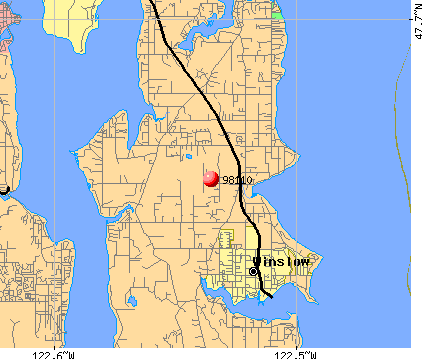
Notable locations in zip code 98110: Point Monroe Light (A), Wing Point Golf and Country Club (B), Island Center (C), Bainbridge Isle Ferry Landing (D), Pleasant Beach (E), Eagle Harbor Marina (F), Harbour Marina (G), Eagledale Moorings (H), Queen City Yacht Club Outstation (I), Bainbridge Marina (J), Winslow Wharf Marina (K), The Chandlery at Winslow Wharf (L), Port Madison Yacht Club (M), Seattle Yacht Club Port Madison Outstation (N), Bainbridge Island City Sewage Treatment Plant (O), Point Monroe Light (P), Bainbridge Island Fire Department Station 23 (Q), Bainbridge Island Fire Department Station 22 (R), Bainbridge Island Ambulance Association (S), Battle Point Light (T). Display/hide their locations on the map
Churches in zip code 98110 include: Madison Church (A), Bethany Lutheran Church (B), Eagle Harbor Congregational Church (C), Grace Church (D), Island Church (E), Life Staff Ministries (F), Saint Cecilia Catholic Church (G), Bainbridge Bible Chapel (H), Bainbridge First Baptist Church (I). Display/hide their locations on the map
Parks in zip code 98110 include: Manitou Park (1), Fay-Bainbridge State Park (2), Battle Point Park (3), Fort Ward State Park (4). Display/hide their locations on the map
3,857 married couples with children.
943 single-parent households (397 men, 546 women).
94.4% of residents of 98110 zip code speak English at home.
1.4% of residents speak Spanish at home (91% very well, 6% well, 3% not well).
3.1% of residents speak other Indo-European language at home (96% very well, 4% well).
1.1% of residents speak Asian or Pacific Island language at home (77% very well, 17% well, 6% not well).
0.2% of residents speak other language at home (100% very well).
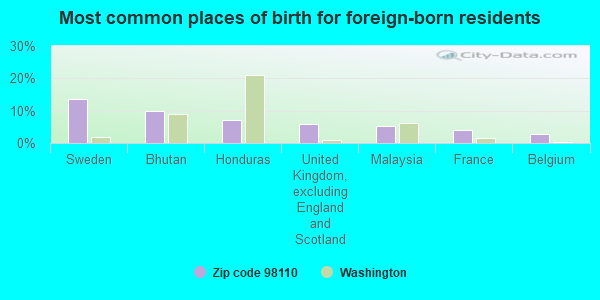
Foreign born population: 1,892 (7.6%) (66.2% of them are naturalized citizens)
This zip code:
7.6%
Whole state:
15.3%
14%Sweden
10%Bhutan
7%Honduras
6%United Kingdom, excluding England and Scotland
5%Malaysia
4%France
3%Belgium
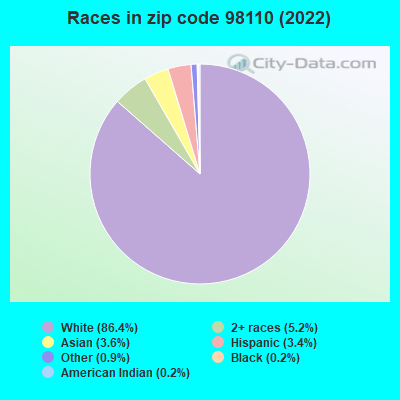
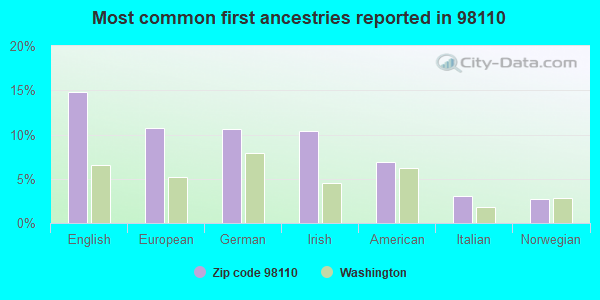
15%English
11%European
11%German
10%Irish
7%American
3%Italian
3%Norwegian
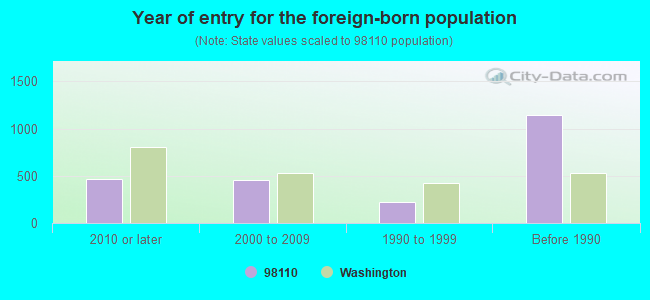
Year of entry for the foreign-born population
4632010 or later
4532000 to 2009
2201990 to 1999
1,143Before 1990
Facilities with environmental interests located in this zip code:
AQUABIOTICS CORP (10750 ARROW PT DR in BAINBRIDGE ISLAND, WA)
COMPLIANCE ACTIVITY (Tracking inspections of insecticide, fungicide, and rodenticide, and toxic substances) (Resource Conservation and Recovery Act (tracking hazardous waste)) STATE MASTER (Washington State Department of Ecology's Facility/Site identification system) - HAZWASTE-WA0000230276, HAZARDOUS WASTE PROGRAM Business SIC classification: PESTICIDES AND AGRICULTURAL CHEMICALS Organizations: NICK ROMEO (CONTACT/OPERATOR)
Alternative names: AQUABIOTICS CORPORTION
CAICOS CORP (528 WINSLOW WAY W in BAINBRIDGE ISLAND, WA)
(Resource Conservation and Recovery Act (tracking hazardous waste)) STATE MASTER (Washington State Department of Ecology's Facility/Site identification system) - SPILLS-, FORMAL ENFORCEMENT ACTION Business SIC classification: NONCLASSIFIABLE ESTABLISHMENTS
ALYEA ISLAND CENTER (8800 FLETCHER BAY RD NE in BAINBRIDGE ISLAND, WA)
(Resource Conservation and Recovery Act (tracking hazardous waste)) STATE MASTER (Washington State Department of Ecology's Facility/Site identification system) - HAZWASTE-WAH000008078, HAZARDOUS WASTE PROGRAM Business SIC classification: GASOLINE SERVICE STATIONS Organizations: JAY ALYEA (CONTACT/OPERATOR)
ARCO 5754 PSI 5754 (406 HIGH SCHOOL RD in BAINBRIDGE ISLAND, WA)
(Resource Conservation and Recovery Act (tracking hazardous waste)) STATE MASTER (Washington State Department of Ecology's Facility/Site identification system) - HAZWASTE-WAH000007377, CESQG Business SIC classification: GASOLINE SERVICE STATIONS
CHEVRON USA INC SS 200425 (1220 HILDEBRAND LANE NE in BAINBRIDGE ISLAND, WA)
(Resource Conservation and Recovery Act (tracking hazardous waste)) STATE MASTER (Washington State Department of Ecology's Facility/Site identification system) - HAZWASTE-WAD988492682, HAZARDOUS WASTE PROGRAM, TOXICS-100295, LEAKING STORAGE TANK, UNDERGROUND STORAGE TANK PROGRAM, HAZWASTE-WAD988492682, EPCRA, TOXICS-NW1319, VOLUNTARY CLEAN UP PROGRAM Business SIC classification: MISCELLANEOUS FOOD STORES; GASOLINE SERVICE STATIONS; LIQUEFIED PETROLEUM GAS (BOTTLED GAS) DEALERS Organizations: KATHY NORRIS (CONTACT/OPERATOR)
, CHEVRON PRODUCTS COMPANY (CONTACT/OWNER)
BLUE SKY WOODWORKS INC (8040 DAY RD W BLDG 3 in BAINBRIDGE ISLAND, WA)
Conditionally Exempt Small Quantity Generators, less than 100 kg/month of hazardous waste (Resource Conservation and Recovery Act (tracking hazardous waste)) - notification STATE MASTER (Washington State Department of Ecology's Facility/Site identification system) - HAZWASTE-WAD988503314, CESQG Business SIC classification: WOOD OFFICE AND STORE FIXTURES, PARTITIONS, SHELVING, AND LOCKERS; FURNITURE AND FIXTURES Organizations: DAN HORNICK (CONTACT/OPERATOR)
CAPTAIN JOHNSTON BLAKELY ELEMENTARY SCH (4704 BLAKELY AVE NE in BAINBRIDGE ISLAND, WA)
COMPLIANCE ACTIVITY (Tracking inspections of insecticide, fungicide, and rodenticide, and toxic substances) (National Center for Education Statistics) - STATE ID-3552 Organizations: BAINBRIDGE ISLAND SCH DIST 303 (SCHOOL DISTRICT)
CAPT. CHARLES WILKES ELEM SCHOOL (12781 MADISON AVE NE in BAINBRIDGE ISL, WA)
(National Center for Education Statistics) - STATE ID-3043 Organizations: BAINBRIDGE ISLAND SCH DIST 303 (SCHOOL DISTRICT)
CARDEN COUNTRY SCHOOL (6974 ISLAND CENTER ROAD NE in BAINBRIDGE ISLAND, WA)
(Integrated Compliance Information System) - ICIS-10-1999-0232, FORMAL ENFORCEMENT ACTION COMPLIANCE ACTIVITY (Tracking inspections of insecticide, fungicide, and rodenticide, and toxic substances) Business SIC classification: ELEMENTARY AND SECONDARY SCHOOLS Alternative names: BAINBRIDGE CARDEN SCH, HARVEY (CARDEN COUNTRY SCHOOL)
AMERICAN GOLD SEAFOODS ORCHARD (RICH PASSAGE NW OF BEANS PT in BAINBRIDGE ISLAND, WA)
National Pollutant Discharge Elimination System NON-MAJOR (Tracking pollutant discharge elimination systems) - permit Business SIC classification: ANIMAL AQUACULTURE Organizations: AMERICAN GOLD SEAFOODS LLC (CONTACT/OPERATOR)
Alternative names: AMERICAN GOLD SEAFOODS LLC, GLOBAL AQUA ORCHARD ROCKS, NORTHWEST SEA FARMS ORCHARD RK
APPLIED MECHANICAL ENERGY (8040 NORTHEAST DAY ROAD BUILDING 6A in BAINBRIDGE ISLAND, WA)
(Resource Conservation and Recovery Act (tracking hazardous waste)) Business NAICS classification: OTHER GUIDED MISSILE AND SPACE VEHICLE PARTS AND AUXILIARY EQUIPMENT MANUFACTURING. Organizations: RICHARD DE GROEN (CONTACT/OPERATOR)
, GB PROPERTIES (CONTACT/OWNER)
Housing units lacking complete plumbing facilities: 0.5% Housing units lacking complete kitchen facilities: 0.9%
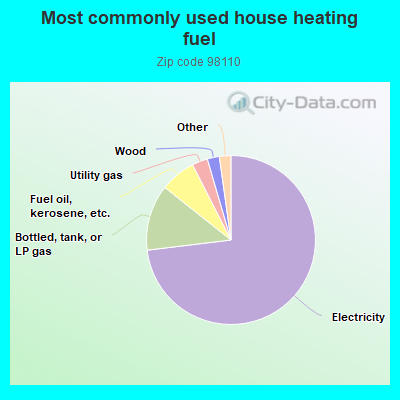
73.0%Electricity
12.6%Bottled, tank, or LP gas
6.8%Fuel oil, kerosene, etc.
3.0%Utility gas
2.3%Wood
1.0%Other fuel
0.5%No fuel used
Population in 1990: 15,846. Population change in the 1990s: +4,462 (+28.2%).
Place of birth for U.S.-born residents:
This state: 8,060
Northeast: 2,509
Midwest: 3,546
South: 3,035
West: 5,419
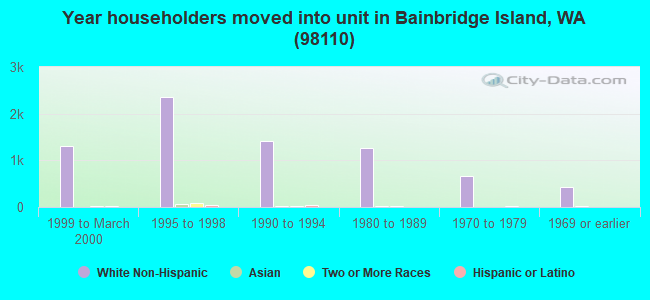
53% of the 98110 zip code residents lived in the same house 5 years ago. Out of people who lived in different houses, 40% lived in this county. Out of people who lived in different counties, 50% lived in Washington.
89% of the 98110 zip code residents lived in the same house 1 year ago. Out of people who lived in different houses, 27% moved from this county. Out of people who lived in different houses, 47% moved from different county within same state. Out of people who lived in different houses, 29% moved from different state. Out of people who lived in different houses, 1% moved from abroad.
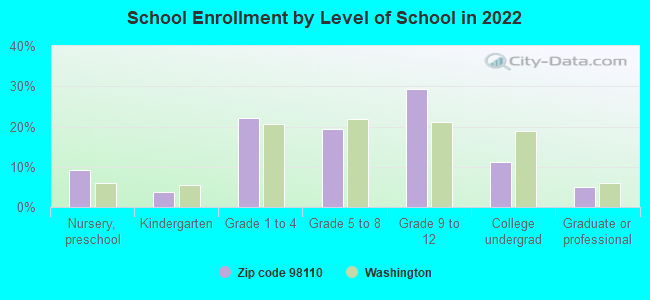
Private vs. public school enrollment:
Students in private schools in grades 1 to 8 (elementary and middle school): 362
Here:
15.8%
Washington:
12.4%
Students in private schools in grades 9 to 12 (high school): 260
Here:
15.9%
Washington:
9.2%
Students in private undergraduate colleges: 157
Here:
25.9%
Washington:
16.5%
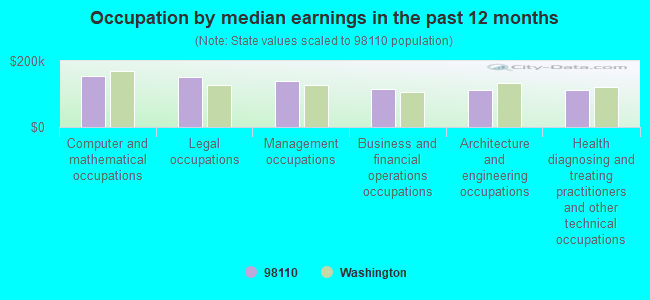
Occupation by median earnings in the past 12 months ($)
154,396Computer and mathematical occupations
152,076Legal occupations
140,278Management occupations
113,758Business and financial operations occupations
111,839Architecture and engineering occupations
111,813Health diagnosing and treating practitioners and other technical occupations
Companies with biggest federal contracts located in this zip code:
CAICOS CORP (265 WINSLOW WAY E STE 103 in BAINBRIDGE ISL, WA; small business) : $803,730 in 7 contractsfrom 1999 to 2000
Contracts for Maintenance, Repair or Alteration of Real Property -- Other Non-Building Facilities, Barges And Lighters, Cargo, Maintenance, Repair or Alteration of Real Property -- Other Conservation and Development Facilities by U.S. Army Corps of Engineers - civil program financing only Signed by year:2000: $74,750; 2001: $0; 2002: $0; 2003: $0; 2004: $0; 2005: $0; 2006: $0.
Biggest contracts:
$728,980 with U.S. Army Corps of Engineers - civil program financing only for Maintenance, Repair or Alteration of Real Property -- Other Non-Building Facilities. Signed on 1999-11-22. Completion date: 1999-12-31.
$145,292, same as above.Signed on 2000-06-21. Completion date: 1999-08-25.
$37,800 with U.S. Army Corps of Engineers - civil program financing only for Barges And Lighters, Cargo. Signed on 2000-06-23. Completion date: 2000-09-22.
-$1,326 with U.S. Army Corps of Engineers - civil program financing only for Maintenance, Repair or Alteration of Real Property -- Other Non-Building Facilities. Signed on 2000-07-10. Completion date: 1999-08-25.
HISEY CONSTRUCTION INC (6376 NE TOLO RD in BAINBRIDGE ISL, WA; small business) : $364,747 in 9 contractsfrom 1999 to 2001
Contracts for Maintenance, Repair or Alteration of Real Property -- Water Supply Facilities, Maintenance, Repair or Alteration of Real Property -- Highways, Roads, Streets, Bridges, and Railways (includes resurfacing) by Air Force Signed by year:2000: $168,179; 2001: $22,520; 2002: $0; 2003: $0; 2004: $0; 2005: $0; 2006: $0.
Biggest contracts:
$173,000 with Air Force for Maintenance, Repair or Alteration of Real Property -- Water Supply Facilities. Signed on 1999-10-27. Completion date: 2000-04-28.
$73,901 with Air Force for Maintenance, Repair or Alteration of Real Property -- Highways, Roads, Streets, Bridges, and Railways (includes resurfacing). Signed on 2000-08-31. Completion date: 2000-08-31.
$50,000 with Air Force for Maintenance, Repair or Alteration of Real Property -- Water Supply Facilities. Signed on 2000-03-28. Completion date: 2000-04-28.
$26,888 with Air Force for Maintenance, Repair or Alteration of Real Property -- Highways, Roads, Streets, Bridges, and Railways (includes resurfacing). Signed on 2000-02-22. Completion date: 2000-02-22.
WESTERN SHORE HERITAGE SERVICE (8001 DAY ROAD WEST in BAINBRIDGE ISL, WA; small business) : $266,546 in 7 contractsfrom 2002 to 2004
Contracts for Archeological/Paleontological Studies by U.S. Army Corps of Engineers - civil program financing only, Army Signed by year:2000: $0; 2001: $0; 2002: $127,596; 2003: $1,150; 2004: $137,800; 2005: $0; 2006: $0.
Biggest contracts:
$127,596 with U.S. Army Corps of Engineers - civil program financing only for Archeological/Paleontological Studies. Signed on 2002-02-25. Completion date: 2002-08-30.
$69,000 with Army for Archeological/Paleontological Studies. Taking place in OR. Signed on 2004-08-19. Completion date: 2005-09-30.
$69,000 with U.S. Army Corps of Engineers - civil program financing only for Archeological/Paleontological Studies. Taking place in OR. Signed on 2004-08-19. Completion date: 2005-09-30.
$1,150 with U.S. Army Corps of Engineers - civil program financing only for Archeological/Paleontological Studies. Signed on 2003-01-16. Completion date: 2003-03-28.
NUNN SWANNACK NUNN ASSOC (7764 NE HIDDEN COVE RD in BAINBRIDGE ISL, WA; small business)
$199,690 with Department of Defense for Physical Sciences -- Management and Support (R&D). Signed on 2002-08-14. Completion date: 2003-04-30.
TIES INC (8410 JENNIE AVE NE in BAINBRIDGE ISL, WA; small business)
$99,992 with Air Force for Defense Missile and Space Systems -- Management and Support (R&D). Signed on 2001-07-26. Completion date: 2002-07-25.
SOLTAR, STEVEN D (10862 NE OLD CREOSOTE HILL in BAINBRIDGE ISL, WA; small business) : $93,660 in 16 contractsfrom 1999 to 2006
Contracts for Other Professional Services, Program Management/Support Services, Training/Curriculum Development, Other Education and Training Services by Geological Survey, U.S. Army Corps of Engineers - civil program financing only, Office of Personnel Management Signed by year:2000: -$16,000; 2001: $49,000; 2002: -$9,565; 2003: $1,000; 2004: $15,000; 2005: $12,794; 2006: $11,431.
Biggest contracts:
$49,000 with Geological Survey for Other Professional Services. Taking place in CA. Signed on 2001-01-15. Completion date: 2002-01-15.
$30,000, same as above.Signed on 1999-10-15. Completion date: 2000-09-15.
$15,000 with Geological Survey for Program Management/Support Services. Signed on 2004-09-08. Completion date: 2005-09-07.
$10,020, same as above.Signed on 2005-09-01. Completion date: 2006-09-07.
NATIONAL DATA SYSTEMS, INC (1077 ARRON AVE NE in BAINBRIDGE ISL, WA; small business) : $73,120 in 4 contractsfrom 2004 to 2005
$65,720 with Bureau of Land Management for ADP Support Equipment. Taking place in AK. Signed on 2004-07-26. Completion date: 2004-08-30.
$3,900, same as above.Signed on 2004-07-22. Completion date: 2004-08-30.
$3,500 with Air Force for ADPE System Configuration. Signed on 2005-08-10. Completion date: 2005-09-09.
$0 with Bureau of Land Management for ADP Support Equipment. Taking place in AK. Signed on 2004-08-23. Completion date: 2004-08-30.
WILLIAM FIKE ( in BAINBRIDGE ISLAND, ; small business)
$43,320 with Public Health Service for Other Medical Services. Taking place in MT. Signed on 2005-02-09. Effective on 2005-03-01. Completion date: 2005-09-30.
ROTANG (7141 NE BAY HILL RD in SEATTLE, WA; small business)
$30,000 with Navy for Programming Services. Signed on 2000-09-27. Completion date: 2001-09-30.
ADVANTAGE RESOURCE GROUP, LLC (1808 EAGLE HARBOR LANE in BAINBRIDGE ISL, WA; small business)
$25,822 with Defense Logistics Agency for Rubber Fabricated Materials. Signed on 2004-03-04. Completion date: 2004-07-18.
Top industries in this zip code by the number of employees in 2005:
2002 - 2018 National Fire Incident Reporting System (NFIRS) incidents
According to the data from the years 2002 - 2018 the average number of fire incidents per year is 52. The highest number of fires - 112 took place in 2002, and the least - 5 in 2006. The data has a decreasing trend.
When looking into fire subcategories, the most incidents belonged to: Structure Fires (48.0%), and Outside Fires (34.5%).
Fire incident types reported to NFIRS in Zip Code 98110


 Nearest zip codes: 98392, 98311, 98345, 98310, 98342, 98366.
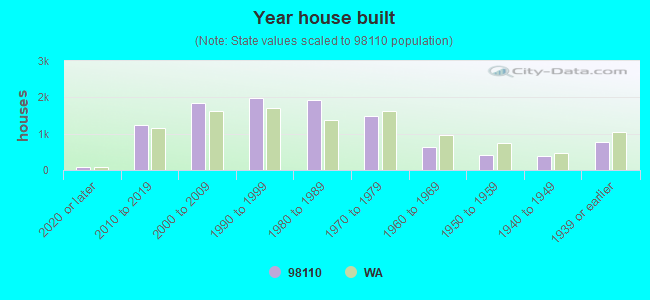


 According to the data from the years 2002 - 2018 the average number of fire incidents per year is 52. The highest number of fires - 112 took place in 2002, and the least - 5 in 2006. The data has a decreasing trend.
 When looking into fire subcategories, the most incidents belonged to: Structure Fires (48.0%), and Outside Fires (34.5%).