Estimated zip code population in 2022: 17,640
Zip code population in 2010: 14,770
Zip code population in 2000: 14,138
Houses and condos: 8,626
Renter-occupied apartments: 2,798
% of renters here:
34%State:
36%
March 2022 cost of living index in zip code 98136: 113.7
(more than average, U.S. average is 100)
Land area: 2.3
sq. mi.
Water area: 0.8
sq. mi.
Population density: 7,673 people per square mile (high).
OSM Map
General Map
Google Map
MSN Map
OSM Map
General Map
Google Map
MSN Map
OSM Map
General Map
Google Map
MSN Map
OSM Map
General Map
Google Map
MSN Map
Please wait while loading the map...
Real estate property taxes paid for housing units in 2022:
This zip code:
0.7% ($7,038)Washington:
0.8% ($4,283)
Median real estate property taxes paid for housing units with mortgages in 2022: $6,913 (0.7%)
Median real estate property taxes paid for housing units with no mortgage in 2022: $7,776 (0.8%)
Profiles of local businesses
Business Search - 14 Million verified businesses
Males: 9,004 Females: 8,636
For population 25 years and over in 98136:
High school or higher: 98.7%Bachelor's degree or higher: 67.8%Graduate or professional degree: 23.3%Unemployed: 3.3%Mean travel time to work (commute): 30.0 minutes
For population 15 years and over in 98136:
Never married: 33.2%Now married: 53.0%Separated: 1.8%Widowed: 2.8%Divorced: 9.2%
Zip code 98136 compared to state average:
Median household income above state average. Median house value above state average. Black race population percentage below state average. Length of stay since moving in significantly above state average. House age above state average. Percentage of population with a bachelor's degree or higher above state average. 13,829 78.4% White 1,679 9.5% Hispanic or Latino 1,019 5.8% Two or more races 645 3.7% Asian 284 1.6% Black 181 1.0% Some other race
Data:
Median household income ($)
Median household income (% change since 2000)
Household income diversity
Ratio of average income to average house value (%)
Ratio of average income to average rent
Median household income ($) - White
Median household income ($) - Black or African American
Median household income ($) - Asian
Median household income ($) - Hispanic or Latino
Median household income ($) - American Indian and Alaska Native
Median household income ($) - Multirace
Median household income ($) - Other Race
Median household income for houses/condos with a mortgage ($)
Median household income for apartments without a mortgage ($)
Races - White alone (%)
Races - White alone (% change since 2000)
Races - Black alone (%)
Races - Black alone (% change since 2000)
Races - American Indian alone (%)
Races - American Indian alone (% change since 2000)
Races - Asian alone (%)
Races - Asian alone (% change since 2000)
Races - Hispanic (%)
Races - Hispanic (% change since 2000)
Races - Native Hawaiian and Other Pacific Islander alone (%)
Races - Native Hawaiian and Other Pacific Islander alone (% change since 2000)
Races - Two or more races (%)
Races - Two or more races (% change since 2000)
Races - Other race alone (%)
Races - Other race alone (% change since 2000)
Racial diversity
Unemployment (%)
Unemployment (% change since 2000)
Unemployment (%) - White
Unemployment (%) - Black or African American
Unemployment (%) - Asian
Unemployment (%) - Hispanic or Latino
Unemployment (%) - American Indian and Alaska Native
Unemployment (%) - Multirace
Unemployment (%) - Other Race
Population density (people per square mile)
Population - Males (%)
Population - Females (%)
Population - Males (%) - White
Population - Males (%) - Black or African American
Population - Males (%) - Asian
Population - Males (%) - Hispanic or Latino
Population - Males (%) - American Indian and Alaska Native
Population - Males (%) - Multirace
Population - Males (%) - Other Race
Population - Females (%) - White
Population - Females (%) - Black or African American
Population - Females (%) - Asian
Population - Females (%) - Hispanic or Latino
Population - Females (%) - American Indian and Alaska Native
Population - Females (%) - Multirace
Population - Females (%) - Other Race
Coronavirus confirmed cases (Apr 18, 2024)
Deaths caused by coronavirus (Apr 18, 2024)
Coronavirus confirmed cases (per 100k population) (Apr 18, 2024)
Deaths caused by coronavirus (per 100k population) (Apr 18, 2024)
Daily increase in number of cases (Apr 18, 2024)
Weekly increase in number of cases (Apr 18, 2024)
Cases doubled (in days) (Apr 18, 2024)
Hospitalized patients (Apr 18, 2022)
Negative test results (Apr 18, 2022)
Total test results (Apr 18, 2022)
COVID Vaccine doses distributed (per 100k population) (Sep 19, 2023)
COVID Vaccine doses administered (per 100k population) (Sep 19, 2023)
COVID Vaccine doses distributed (Sep 19, 2023)
COVID Vaccine doses administered (Sep 19, 2023)
Likely homosexual households (%)
Likely homosexual households (% change since 2000)
Likely homosexual households - Lesbian couples (%)
Likely homosexual households - Lesbian couples (% change since 2000)
Likely homosexual households - Gay men (%)
Likely homosexual households - Gay men (% change since 2000)
Cost of living index
Median gross rent ($)
Median contract rent ($)
Median monthly housing costs ($)
Median house or condo value ($)
Median house or condo value ($ change since 2000)
Mean house or condo value by units in structure - 1, detached ($)
Mean house or condo value by units in structure - 1, attached ($)
Mean house or condo value by units in structure - 2 ($)
Mean house or condo value by units in structure by units in structure - 3 or 4 ($)
Mean house or condo value by units in structure - 5 or more ($)
Mean house or condo value by units in structure - Boat, RV, van, etc. ($)
Mean house or condo value by units in structure - Mobile home ($)
Median house or condo value ($) - White
Median house or condo value ($) - Black or African American
Median house or condo value ($) - Asian
Median house or condo value ($) - Hispanic or Latino
Median house or condo value ($) - American Indian and Alaska Native
Median house or condo value ($) - Multirace
Median house or condo value ($) - Other Race
Median resident age
Resident age diversity
Median resident age - Males
Median resident age - Females
Median resident age - White
Median resident age - Black or African American
Median resident age - Asian
Median resident age - Hispanic or Latino
Median resident age - American Indian and Alaska Native
Median resident age - Multirace
Median resident age - Other Race
Median resident age - Males - White
Median resident age - Males - Black or African American
Median resident age - Males - Asian
Median resident age - Males - Hispanic or Latino
Median resident age - Males - American Indian and Alaska Native
Median resident age - Males - Multirace
Median resident age - Males - Other Race
Median resident age - Females - White
Median resident age - Females - Black or African American
Median resident age - Females - Asian
Median resident age - Females - Hispanic or Latino
Median resident age - Females - American Indian and Alaska Native
Median resident age - Females - Multirace
Median resident age - Females - Other Race
Commute - mean travel time to work (minutes)
Travel time to work - Less than 5 minutes (%)
Travel time to work - Less than 5 minutes (% change since 2000)
Travel time to work - 5 to 9 minutes (%)
Travel time to work - 5 to 9 minutes (% change since 2000)
Travel time to work - 10 to 19 minutes (%)
Travel time to work - 10 to 19 minutes (% change since 2000)
Travel time to work - 20 to 29 minutes (%)
Travel time to work - 20 to 29 minutes (% change since 2000)
Travel time to work - 30 to 39 minutes (%)
Travel time to work - 30 to 39 minutes (% change since 2000)
Travel time to work - 40 to 59 minutes (%)
Travel time to work - 40 to 59 minutes (% change since 2000)
Travel time to work - 60 to 89 minutes (%)
Travel time to work - 60 to 89 minutes (% change since 2000)
Travel time to work - 90 or more minutes (%)
Travel time to work - 90 or more minutes (% change since 2000)
Marital status - Never married (%)
Marital status - Now married (%)
Marital status - Separated (%)
Marital status - Widowed (%)
Marital status - Divorced (%)
Median family income ($)
Median family income (% change since 2000)
Median non-family income ($)
Median non-family income (% change since 2000)
Median per capita income ($)
Median per capita income (% change since 2000)
Median family income ($) - White
Median family income ($) - Black or African American
Median family income ($) - Asian
Median family income ($) - Hispanic or Latino
Median family income ($) - American Indian and Alaska Native
Median family income ($) - Multirace
Median family income ($) - Other Race
Median year house/condo built
Median year apartment built
Year house built - Built 2005 or later (%)
Year house built - Built 2000 to 2004 (%)
Year house built - Built 1990 to 1999 (%)
Year house built - Built 1980 to 1989 (%)
Year house built - Built 1970 to 1979 (%)
Year house built - Built 1960 to 1969 (%)
Year house built - Built 1950 to 1959 (%)
Year house built - Built 1940 to 1949 (%)
Year house built - Built 1939 or earlier (%)
Average household size
Household density (households per square mile)
Average household size - White
Average household size - Black or African American
Average household size - Asian
Average household size - Hispanic or Latino
Average household size - American Indian and Alaska Native
Average household size - Multirace
Average household size - Other Race
Occupied housing units (%)
Vacant housing units (%)
Owner occupied housing units (%)
Renter occupied housing units (%)
Vacancy status - For rent (%)
Vacancy status - For sale only (%)
Vacancy status - Rented or sold, not occupied (%)
Vacancy status - For seasonal, recreational, or occasional use (%)
Vacancy status - For migrant workers (%)
Vacancy status - Other vacant (%)
Residents with income below the poverty level (%)
Residents with income below 50% of the poverty level (%)
Children below poverty level (%)
Poor families by family type - Married-couple family (%)
Poor families by family type - Male, no wife present (%)
Poor families by family type - Female, no husband present (%)
Poverty status for native-born residents (%)
Poverty status for foreign-born residents (%)
Poverty among high school graduates not in families (%)
Poverty among people who did not graduate high school not in families (%)
Residents with income below the poverty level (%) - White
Residents with income below the poverty level (%) - Black or African American
Residents with income below the poverty level (%) - Asian
Residents with income below the poverty level (%) - Hispanic or Latino
Residents with income below the poverty level (%) - American Indian and Alaska Native
Residents with income below the poverty level (%) - Multirace
Residents with income below the poverty level (%) - Other Race
Air pollution - Air Quality Index (AQI)
Air pollution - CO
Air pollution - NO2
Air pollution - SO2
Air pollution - Ozone
Air pollution - PM10
Air pollution - PM25
Air pollution - Pb
Crime - Murders per 100,000 population
Crime - Rapes per 100,000 population
Crime - Robberies per 100,000 population
Crime - Assaults per 100,000 population
Crime - Burglaries per 100,000 population
Crime - Thefts per 100,000 population
Crime - Auto thefts per 100,000 population
Crime - Arson per 100,000 population
Crime - City-data.com crime index
Crime - Violent crime index
Crime - Property crime index
Crime - Murders per 100,000 population (5 year average)
Crime - Rapes per 100,000 population (5 year average)
Crime - Robberies per 100,000 population (5 year average)
Crime - Assaults per 100,000 population (5 year average)
Crime - Burglaries per 100,000 population (5 year average)
Crime - Thefts per 100,000 population (5 year average)
Crime - Auto thefts per 100,000 population (5 year average)
Crime - Arson per 100,000 population (5 year average)
Crime - City-data.com crime index (5 year average)
Crime - Violent crime index (5 year average)
Crime - Property crime index (5 year average)
1996 Presidential Elections Results (%) - Democratic Party (Clinton)
1996 Presidential Elections Results (%) - Republican Party (Dole)
1996 Presidential Elections Results (%) - Other
2000 Presidential Elections Results (%) - Democratic Party (Gore)
2000 Presidential Elections Results (%) - Republican Party (Bush)
2000 Presidential Elections Results (%) - Other
2004 Presidential Elections Results (%) - Democratic Party (Kerry)
2004 Presidential Elections Results (%) - Republican Party (Bush)
2004 Presidential Elections Results (%) - Other
2008 Presidential Elections Results (%) - Democratic Party (Obama)
2008 Presidential Elections Results (%) - Republican Party (McCain)
2008 Presidential Elections Results (%) - Other
2012 Presidential Elections Results (%) - Democratic Party (Obama)
2012 Presidential Elections Results (%) - Republican Party (Romney)
2012 Presidential Elections Results (%) - Other
2016 Presidential Elections Results (%) - Democratic Party (Clinton)
2016 Presidential Elections Results (%) - Republican Party (Trump)
2016 Presidential Elections Results (%) - Other
2020 Presidential Elections Results (%) - Democratic Party (Biden)
2020 Presidential Elections Results (%) - Republican Party (Trump)
2020 Presidential Elections Results (%) - Other
Ancestries Reported - Arab (%)
Ancestries Reported - Czech (%)
Ancestries Reported - Danish (%)
Ancestries Reported - Dutch (%)
Ancestries Reported - English (%)
Ancestries Reported - French (%)
Ancestries Reported - French Canadian (%)
Ancestries Reported - German (%)
Ancestries Reported - Greek (%)
Ancestries Reported - Hungarian (%)
Ancestries Reported - Irish (%)
Ancestries Reported - Italian (%)
Ancestries Reported - Lithuanian (%)
Ancestries Reported - Norwegian (%)
Ancestries Reported - Polish (%)
Ancestries Reported - Portuguese (%)
Ancestries Reported - Russian (%)
Ancestries Reported - Scotch-Irish (%)
Ancestries Reported - Scottish (%)
Ancestries Reported - Slovak (%)
Ancestries Reported - Subsaharan African (%)
Ancestries Reported - Swedish (%)
Ancestries Reported - Swiss (%)
Ancestries Reported - Ukrainian (%)
Ancestries Reported - United States (%)
Ancestries Reported - Welsh (%)
Ancestries Reported - West Indian (%)
Ancestries Reported - Other (%)
Educational Attainment - No schooling completed (%)
Educational Attainment - Less than high school (%)
Educational Attainment - High school or equivalent (%)
Educational Attainment - Less than 1 year of college (%)
Educational Attainment - 1 or more years of college (%)
Educational Attainment - Associate degree (%)
Educational Attainment - Bachelor's degree (%)
Educational Attainment - Master's degree (%)
Educational Attainment - Professional school degree (%)
Educational Attainment - Doctorate degree (%)
School Enrollment - Nursery, preschool (%)
School Enrollment - Kindergarten (%)
School Enrollment - Grade 1 to 4 (%)
School Enrollment - Grade 5 to 8 (%)
School Enrollment - Grade 9 to 12 (%)
School Enrollment - College undergrad (%)
School Enrollment - Graduate or professional (%)
School Enrollment - Not enrolled in school (%)
School enrollment - Public schools (%)
School enrollment - Private schools (%)
School enrollment - Not enrolled (%)
Median number of rooms in houses and condos
Median number of rooms in apartments
Housing units lacking complete plumbing facilities (%)
Housing units lacking complete kitchen facilities (%)
Density of houses
Urban houses (%)
Rural houses (%)
Households with people 60 years and over (%)
Households with people 65 years and over (%)
Households with people 75 years and over (%)
Households with one or more nonrelatives (%)
Households with no nonrelatives (%)
Population in households (%)
Family households (%)
Nonfamily households (%)
Population in families (%)
Family households with own children (%)
Median number of bedrooms in owner occupied houses
Mean number of bedrooms in owner occupied houses
Median number of bedrooms in renter occupied houses
Mean number of bedrooms in renter occupied houses
Median number of vehichles in owner occupied houses
Mean number of vehichles in owner occupied houses
Median number of vehichles in renter occupied houses
Mean number of vehichles in renter occupied houses
Mortgage status - with mortgage (%)
Mortgage status - with second mortgage (%)
Mortgage status - with home equity loan (%)
Mortgage status - with both second mortgage and home equity loan (%)
Mortgage status - without a mortgage (%)
Average family size
Average family size - White
Average family size - Black or African American
Average family size - Asian
Average family size - Hispanic or Latino
Average family size - American Indian and Alaska Native
Average family size - Multirace
Average family size - Other Race
Geographical mobility - Same house 1 year ago (%)
Geographical mobility - Moved within same county (%)
Geographical mobility - Moved from different county within same state (%)
Geographical mobility - Moved from different state (%)
Geographical mobility - Moved from abroad (%)
Place of birth - Born in state of residence (%)
Place of birth - Born in other state (%)
Place of birth - Native, outside of US (%)
Place of birth - Foreign born (%)
Housing units in structures - 1, detached (%)
Housing units in structures - 1, attached (%)
Housing units in structures - 2 (%)
Housing units in structures - 3 or 4 (%)
Housing units in structures - 5 to 9 (%)
Housing units in structures - 10 to 19 (%)
Housing units in structures - 20 to 49 (%)
Housing units in structures - 50 or more (%)
Housing units in structures - Mobile home (%)
Housing units in structures - Boat, RV, van, etc. (%)
House/condo owner moved in on average (years ago)
Renter moved in on average (years ago)
Year householder moved into unit - Moved in 1999 to March 2000 (%)
Year householder moved into unit - Moved in 1995 to 1998 (%)
Year householder moved into unit - Moved in 1990 to 1994 (%)
Year householder moved into unit - Moved in 1980 to 1989 (%)
Year householder moved into unit - Moved in 1970 to 1979 (%)
Year householder moved into unit - Moved in 1969 or earlier (%)
Means of transportation to work - Drove car alone (%)
Means of transportation to work - Carpooled (%)
Means of transportation to work - Public transportation (%)
Means of transportation to work - Bus or trolley bus (%)
Means of transportation to work - Streetcar or trolley car (%)
Means of transportation to work - Subway or elevated (%)
Means of transportation to work - Railroad (%)
Means of transportation to work - Ferryboat (%)
Means of transportation to work - Taxicab (%)
Means of transportation to work - Motorcycle (%)
Means of transportation to work - Bicycle (%)
Means of transportation to work - Walked (%)
Means of transportation to work - Other means (%)
Working at home (%)
Industry diversity
Most Common Industries - Agriculture, forestry, fishing and hunting, and mining (%)
Most Common Industries - Agriculture, forestry, fishing and hunting (%)
Most Common Industries - Mining, quarrying, and oil and gas extraction (%)
Most Common Industries - Construction (%)
Most Common Industries - Manufacturing (%)
Most Common Industries - Wholesale trade (%)
Most Common Industries - Retail trade (%)
Most Common Industries - Transportation and warehousing, and utilities (%)
Most Common Industries - Transportation and warehousing (%)
Most Common Industries - Utilities (%)
Most Common Industries - Information (%)
Most Common Industries - Finance and insurance, and real estate and rental and leasing (%)
Most Common Industries - Finance and insurance (%)
Most Common Industries - Real estate and rental and leasing (%)
Most Common Industries - Professional, scientific, and management, and administrative and waste management services (%)
Most Common Industries - Professional, scientific, and technical services (%)
Most Common Industries - Management of companies and enterprises (%)
Most Common Industries - Administrative and support and waste management services (%)
Most Common Industries - Educational services, and health care and social assistance (%)
Most Common Industries - Educational services (%)
Most Common Industries - Health care and social assistance (%)
Most Common Industries - Arts, entertainment, and recreation, and accommodation and food services (%)
Most Common Industries - Arts, entertainment, and recreation (%)
Most Common Industries - Accommodation and food services (%)
Most Common Industries - Other services, except public administration (%)
Most Common Industries - Public administration (%)
Occupation diversity
Most Common Occupations - Management, business, science, and arts occupations (%)
Most Common Occupations - Management, business, and financial occupations (%)
Most Common Occupations - Management occupations (%)
Most Common Occupations - Business and financial operations occupations (%)
Most Common Occupations - Computer, engineering, and science occupations (%)
Most Common Occupations - Computer and mathematical occupations (%)
Most Common Occupations - Architecture and engineering occupations (%)
Most Common Occupations - Life, physical, and social science occupations (%)
Most Common Occupations - Education, legal, community service, arts, and media occupations (%)
Most Common Occupations - Community and social service occupations (%)
Most Common Occupations - Legal occupations (%)
Most Common Occupations - Education, training, and library occupations (%)
Most Common Occupations - Arts, design, entertainment, sports, and media occupations (%)
Most Common Occupations - Healthcare practitioners and technical occupations (%)
Most Common Occupations - Health diagnosing and treating practitioners and other technical occupations (%)
Most Common Occupations - Health technologists and technicians (%)
Most Common Occupations - Service occupations (%)
Most Common Occupations - Healthcare support occupations (%)
Most Common Occupations - Protective service occupations (%)
Most Common Occupations - Fire fighting and prevention, and other protective service workers including supervisors (%)
Most Common Occupations - Law enforcement workers including supervisors (%)
Most Common Occupations - Food preparation and serving related occupations (%)
Most Common Occupations - Building and grounds cleaning and maintenance occupations (%)
Most Common Occupations - Personal care and service occupations (%)
Most Common Occupations - Sales and office occupations (%)
Most Common Occupations - Sales and related occupations (%)
Most Common Occupations - Office and administrative support occupations (%)
Most Common Occupations - Natural resources, construction, and maintenance occupations (%)
Most Common Occupations - Farming, fishing, and forestry occupations (%)
Most Common Occupations - Construction and extraction occupations (%)
Most Common Occupations - Installation, maintenance, and repair occupations (%)
Most Common Occupations - Production, transportation, and material moving occupations (%)
Most Common Occupations - Production occupations (%)
Most Common Occupations - Transportation occupations (%)
Most Common Occupations - Material moving occupations (%)
People in Group quarters - Institutionalized population (%)
People in Group quarters - Correctional institutions (%)
People in Group quarters - Federal prisons and detention centers (%)
People in Group quarters - Halfway houses (%)
People in Group quarters - Local jails and other confinement facilities (including police lockups) (%)
People in Group quarters - Military disciplinary barracks (%)
People in Group quarters - State prisons (%)
People in Group quarters - Other types of correctional institutions (%)
People in Group quarters - Nursing homes (%)
People in Group quarters - Hospitals/wards, hospices, and schools for the handicapped (%)
People in Group quarters - Hospitals/wards and hospices for chronically ill (%)
People in Group quarters - Hospices or homes for chronically ill (%)
People in Group quarters - Military hospitals or wards for chronically ill (%)
People in Group quarters - Other hospitals or wards for chronically ill (%)
People in Group quarters - Hospitals or wards for drug/alcohol abuse (%)
People in Group quarters - Mental (Psychiatric) hospitals or wards (%)
People in Group quarters - Schools, hospitals, or wards for the mentally retarded (%)
People in Group quarters - Schools, hospitals, or wards for the physically handicapped (%)
People in Group quarters - Institutions for the deaf (%)
People in Group quarters - Institutions for the blind (%)
People in Group quarters - Orthopedic wards and institutions for the physically handicapped (%)
People in Group quarters - Wards in general hospitals for patients who have no usual home elsewhere (%)
People in Group quarters - Wards in military hospitals for patients who have no usual home elsewhere (%)
People in Group quarters - Juvenile institutions (%)
People in Group quarters - Long-term care (%)
People in Group quarters - Homes for abused, dependent, and neglected children (%)
People in Group quarters - Residential treatment centers for emotionally disturbed children (%)
People in Group quarters - Training schools for juvenile delinquents (%)
People in Group quarters - Short-term care, detention or diagnostic centers for delinquent children (%)
People in Group quarters - Type of juvenile institution unknown (%)
People in Group quarters - Noninstitutionalized population (%)
People in Group quarters - College dormitories (includes college quarters off campus) (%)
People in Group quarters - Military quarters (%)
People in Group quarters - On base (%)
People in Group quarters - Barracks, unaccompanied personnel housing (UPH), (Enlisted/Officer), ;and similar group living quarters for military personnel (%)
People in Group quarters - Transient quarters for temporary residents (%)
People in Group quarters - Military ships (%)
People in Group quarters - Group homes (%)
People in Group quarters - Homes or halfway houses for drug/alcohol abuse (%)
People in Group quarters - Homes for the mentally ill (%)
People in Group quarters - Homes for the mentally retarded (%)
People in Group quarters - Homes for the physically handicapped (%)
People in Group quarters - Other group homes (%)
People in Group quarters - Religious group quarters (%)
People in Group quarters - Dormitories (%)
People in Group quarters - Agriculture workers' dormitories on farms (%)
People in Group quarters - Job Corps and vocational training facilities (%)
People in Group quarters - Other workers' dormitories (%)
People in Group quarters - Crews of maritime vessels (%)
People in Group quarters - Other nonhousehold living situations (%)
People in Group quarters - Other noninstitutional group quarters (%)
Residents speaking English at home (%)
Residents speaking English at home - Born in the United States (%)
Residents speaking English at home - Native, born elsewhere (%)
Residents speaking English at home - Foreign born (%)
Residents speaking Spanish at home (%)
Residents speaking Spanish at home - Born in the United States (%)
Residents speaking Spanish at home - Native, born elsewhere (%)
Residents speaking Spanish at home - Foreign born (%)
Residents speaking other language at home (%)
Residents speaking other language at home - Born in the United States (%)
Residents speaking other language at home - Native, born elsewhere (%)
Residents speaking other language at home - Foreign born (%)
Class of Workers - Employee of private company (%)
Class of Workers - Self-employed in own incorporated business (%)
Class of Workers - Private not-for-profit wage and salary workers (%)
Class of Workers - Local government workers (%)
Class of Workers - State government workers (%)
Class of Workers - Federal government workers (%)
Class of Workers - Self-employed workers in own not incorporated business and Unpaid family workers (%)
House heating fuel used in houses and condos - Utility gas (%)
House heating fuel used in houses and condos - Bottled, tank, or LP gas (%)
House heating fuel used in houses and condos - Electricity (%)
House heating fuel used in houses and condos - Fuel oil, kerosene, etc. (%)
House heating fuel used in houses and condos - Coal or coke (%)
House heating fuel used in houses and condos - Wood (%)
House heating fuel used in houses and condos - Solar energy (%)
House heating fuel used in houses and condos - Other fuel (%)
House heating fuel used in houses and condos - No fuel used (%)
House heating fuel used in apartments - Utility gas (%)
House heating fuel used in apartments - Bottled, tank, or LP gas (%)
House heating fuel used in apartments - Electricity (%)
House heating fuel used in apartments - Fuel oil, kerosene, etc. (%)
House heating fuel used in apartments - Coal or coke (%)
House heating fuel used in apartments - Wood (%)
House heating fuel used in apartments - Solar energy (%)
House heating fuel used in apartments - Other fuel (%)
House heating fuel used in apartments - No fuel used (%)
Armed forces status - In Armed Forces (%)
Armed forces status - Civilian (%)
Armed forces status - Civilian - Veteran (%)
Armed forces status - Civilian - Nonveteran (%)
Fatal accidents locations in years 2005-2021
Fatal accidents locations in 2005
Fatal accidents locations in 2006
Fatal accidents locations in 2007
Fatal accidents locations in 2008
Fatal accidents locations in 2009
Fatal accidents locations in 2010
Fatal accidents locations in 2011
Fatal accidents locations in 2012
Fatal accidents locations in 2013
Fatal accidents locations in 2014
Fatal accidents locations in 2015
Fatal accidents locations in 2016
Fatal accidents locations in 2017
Fatal accidents locations in 2018
Fatal accidents locations in 2019
Fatal accidents locations in 2020
Fatal accidents locations in 2021
Alcohol use - People drinking some alcohol every month (%)
Alcohol use - People not drinking at all (%)
Alcohol use - Average days/month drinking alcohol
Alcohol use - Average drinks/week
Alcohol use - Average days/year people drink much
Audiometry - Average condition of hearing (%)
Audiometry - People that can hear a whisper from across a quiet room (%)
Audiometry - People that can hear normal voice from across a quiet room (%)
Audiometry - Ears ringing, roaring, buzzing (%)
Audiometry - Had a job exposure to loud noise (%)
Audiometry - Had off-work exposure to loud noise (%)
Blood Pressure & Cholesterol - Has high blood pressure (%)
Blood Pressure & Cholesterol - Checking blood pressure at home (%)
Blood Pressure & Cholesterol - Frequently checking blood cholesterol (%)
Blood Pressure & Cholesterol - Has high cholesterol level (%)
Consumer Behavior - Money monthly spent on food at supermarket/grocery store
Consumer Behavior - Money monthly spent on food at other stores
Consumer Behavior - Money monthly spent on eating out
Consumer Behavior - Money monthly spent on carryout/delivered foods
Consumer Behavior - Income spent on food at supermarket/grocery store (%)
Consumer Behavior - Income spent on food at other stores (%)
Consumer Behavior - Income spent on eating out (%)
Consumer Behavior - Income spent on carryout/delivered foods (%)
Current Health Status - General health condition (%)
Current Health Status - Blood donors (%)
Current Health Status - Has blood ever tested for HIV virus (%)
Current Health Status - Left-handed people (%)
Dermatology - People using sunscreen (%)
Diabetes - Diabetics (%)
Diabetes - Had a blood test for high blood sugar (%)
Diabetes - People taking insulin (%)
Diet Behavior & Nutrition - Diet health (%)
Diet Behavior & Nutrition - Milk product consumption (# of products/month)
Diet Behavior & Nutrition - Meals not home prepared (#/week)
Diet Behavior & Nutrition - Meals from fast food or pizza place (#/week)
Diet Behavior & Nutrition - Ready-to-eat foods (#/month)
Diet Behavior & Nutrition - Frozen meals/pizza (#/month)
Drug Use - People that ever used marijuana or hashish (%)
Drug Use - Ever used hard drugs (%)
Drug Use - Ever used any form of cocaine (%)
Drug Use - Ever used heroin (%)
Drug Use - Ever used methamphetamine (%)
Health Insurance - People covered by health insurance (%)
Kidney Conditions-Urology - Avg. # of times urinating at night
Medical Conditions - People with asthma (%)
Medical Conditions - People with anemia (%)
Medical Conditions - People with psoriasis (%)
Medical Conditions - People with overweight (%)
Medical Conditions - Elderly people having difficulties in thinking or remembering (%)
Medical Conditions - People who ever received blood transfusion (%)
Medical Conditions - People having trouble seeing even with glass/contacts (%)
Medical Conditions - People with arthritis (%)
Medical Conditions - People with gout (%)
Medical Conditions - People with congestive heart failure (%)
Medical Conditions - People with coronary heart disease (%)
Medical Conditions - People with angina pectoris (%)
Medical Conditions - People who ever had heart attack (%)
Medical Conditions - People who ever had stroke (%)
Medical Conditions - People with emphysema (%)
Medical Conditions - People with thyroid problem (%)
Medical Conditions - People with chronic bronchitis (%)
Medical Conditions - People with any liver condition (%)
Medical Conditions - People who ever had cancer or malignancy (%)
Mental Health - People who have little interest in doing things (%)
Mental Health - People feeling down, depressed, or hopeless (%)
Mental Health - People who have trouble sleeping or sleeping too much (%)
Mental Health - People feeling tired or having little energy (%)
Mental Health - People with poor appetite or overeating (%)
Mental Health - People feeling bad about themself (%)
Mental Health - People who have trouble concentrating on things (%)
Mental Health - People moving or speaking slowly or too fast (%)
Mental Health - People having thoughts they would be better off dead (%)
Oral Health - Average years since last visit a dentist
Oral Health - People embarrassed because of mouth (%)
Oral Health - People with gum disease (%)
Oral Health - General health of teeth and gums (%)
Oral Health - Average days a week using dental floss/device
Oral Health - Average days a week using mouthwash for dental problem
Oral Health - Average number of teeth
Pesticide Use - Households using pesticides to control insects (%)
Pesticide Use - Households using pesticides to kill weeds (%)
Physical Activity - People doing vigorous-intensity work activities (%)
Physical Activity - People doing moderate-intensity work activities (%)
Physical Activity - People walking or bicycling (%)
Physical Activity - People doing vigorous-intensity recreational activities (%)
Physical Activity - People doing moderate-intensity recreational activities (%)
Physical Activity - Average hours a day doing sedentary activities
Physical Activity - Average hours a day watching TV or videos
Physical Activity - Average hours a day using computer
Physical Functioning - People having limitations keeping them from working (%)
Physical Functioning - People limited in amount of work they can do (%)
Physical Functioning - People that need special equipment to walk (%)
Physical Functioning - People experiencing confusion/memory problems (%)
Physical Functioning - People requiring special healthcare equipment (%)
Prescription Medications - Average number of prescription medicines taking
Preventive Aspirin Use - Adults 40+ taking low-dose aspirin (%)
Reproductive Health - Vaginal deliveries (%)
Reproductive Health - Cesarean deliveries (%)
Reproductive Health - Deliveries resulted in a live birth (%)
Reproductive Health - Pregnancies resulted in a delivery (%)
Reproductive Health - Women breastfeeding newborns (%)
Reproductive Health - Women that had a hysterectomy (%)
Reproductive Health - Women that had both ovaries removed (%)
Reproductive Health - Women that have ever taken birth control pills (%)
Reproductive Health - Women taking birth control pills (%)
Reproductive Health - Women that have ever used Depo-Provera or injectables (%)
Reproductive Health - Women that have ever used female hormones (%)
Sexual Behavior - People 18+ that ever had sex (vaginal, anal, or oral) (%)
Sexual Behavior - Males 18+ that ever had vaginal sex with a woman (%)
Sexual Behavior - Males 18+ that ever performed oral sex on a woman (%)
Sexual Behavior - Males 18+ that ever had anal sex with a woman (%)
Sexual Behavior - Males 18+ that ever had any sex with a man (%)
Sexual Behavior - Females 18+ that ever had vaginal sex with a man (%)
Sexual Behavior - Females 18+ that ever performed oral sex on a man (%)
Sexual Behavior - Females 18+ that ever had anal sex with a man (%)
Sexual Behavior - Females 18+ that ever had any kind of sex with a woman (%)
Sexual Behavior - Average age people first had sex
Sexual Behavior - Average number of female sex partners in lifetime (males 18+)
Sexual Behavior - Average number of female vaginal sex partners in lifetime (males 18+)
Sexual Behavior - Average age people first performed oral sex on a woman (18+)
Sexual Behavior - Average number of woman performed oral sex on in lifetime (18+)
Sexual Behavior - Average number of male sex partners in lifetime (males 18+)
Sexual Behavior - Average number of male anal sex partners in lifetime (males 18+)
Sexual Behavior - Average age people first performed oral sex on a man (18+)
Sexual Behavior - Average number of male oral sex partners in lifetime (18+)
Sexual Behavior - People using protection when performing oral sex (%)
Sexual Behavior - Average number of times people have vaginal or anal sex a year
Sexual Behavior - People having sex without condom (%)
Sexual Behavior - Average number of male sex partners in lifetime (females 18+)
Sexual Behavior - Average number of male vaginal sex partners in lifetime (females 18+)
Sexual Behavior - Average number of female sex partners in lifetime (females 18+)
Sexual Behavior - Circumcised males 18+ (%)
Sleep Disorders - Average hours sleeping at night
Sleep Disorders - People that has trouble sleeping (%)
Smoking-Cigarette Use - People smoking cigarettes (%)
Taste & Smell - People 40+ having problems with smell (%)
Taste & Smell - People 40+ having problems with taste (%)
Taste & Smell - People 40+ that ever had wisdom teeth removed (%)
Taste & Smell - People 40+ that ever had tonsils teeth removed (%)
Taste & Smell - People 40+ that ever had a loss of consciousness because of a head injury (%)
Taste & Smell - People 40+ that ever had a broken nose or other serious injury to face or skull (%)
Taste & Smell - People 40+ that ever had two or more sinus infections (%)
Weight - Average height (inches)
Weight - Average weight (pounds)
Weight - Average BMI
Weight - People that are obese (%)
Weight - People that ever were obese (%)
Weight - People trying to lose weight (%)
100%
urban population.
Estimated median house/condo value in 2022: $1,031,813
98136:
$1,031,813Washington:
$569,500
According to our research of Washington and other state lists, there were 2 registered sex offenders living in 98136 zip code as of April 18, 2024 . The ratio of all residents to sex offenders in zip code 98136 is 8,160 to 1.The ratio of registered sex offenders to all residents in this zip code is much lower than the state average.
Median resident age: This zip code:
40.5 yearsWashington median age:
38.4 years
Average household size: This zip code:
2.1 peopleWashington:
2.5 people
Averages for the 2020 tax year for zip code 98136, filed in 2021:
Average Adjusted Gross Income (AGI) in 2020: $161,717 (Individual Income Tax Returns) Here:
$161,717State:
$99,264
Salary/wage: $130,093 (reported on 79.8% of returns )Here:
$130,093State:
$80,347
(% of AGI for various income ranges: 1077.5% for AGIs below $25k , 3354.7% for AGIs $25k-50k , 6244.9% for AGIs $50k-75k , 9469.2% for AGIs $75k-100k , 18460.5% for AGIs $100k-200k , 98285.6% for AGIs over 200k ) Taxable interest for individuals: $1,946 (reported on 53.1% of returns )This zip code:
$1,946Washington:
$2,077
(% of AGI for various income ranges: 44.5% for AGIs below $25k , 32.6% for AGIs $25k-50k , 43.8% for AGIs $50k-75k , 108.7% for AGIs $75k-100k , 174.5% for AGIs $100k-200k , 957.5% for AGIs over 200k ) Ordinary dividends: $12,827 (reported on 43.6% of returns )Here:
$12,827State:
$10,013
(% of AGI for various income ranges: 89.3% for AGIs below $25k , 128.7% for AGIs $25k-50k , 267.9% for AGIs $50k-75k , 338.3% for AGIs $75k-100k , 561.2% for AGIs $100k-200k , 6550.0% for AGIs over 200k ) Net capital gain/loss in AGI: +$43,182 (reported on 40.3% of returns )Here:
+$43,182State:
+$40,092
(% of AGI for various income ranges: 30.5% for AGIs below $25k , 126.8% for AGIs $25k-50k , 225.9% for AGIs $50k-75k , 317.3% for AGIs $75k-100k , 880.7% for AGIs $100k-200k , 24728.7% for AGIs over 200k ) Profit/loss from business: +$26,297 (reported on 16.5% of returns )Here:
+$26,297State:
+$18,312
(% of AGI for various income ranges: 149.6% for AGIs below $25k , 298.2% for AGIs $25k-50k , 353.3% for AGIs $50k-75k , 476.8% for AGIs $75k-100k , 1051.6% for AGIs $100k-200k , 2857.6% for AGIs over 200k ) Taxable individual retirement arrangement distribution: $27,918 (reported on 11.6% of returns )98136:
$27,918Washington:
$24,221
(% of AGI for various income ranges: 93.3% for AGIs below $25k , 132.7% for AGIs $25k-50k , 314.1% for AGIs $50k-75k , 402.7% for AGIs $75k-100k , 813.4% for AGIs $100k-200k , 2121.6% for AGIs over 200k ) Self-employed (Keogh) retirement plans: $23,387 (reported on 1.7% of returns )98136:
$23,387Washington:
$24,166
(% of AGI for various income ranges: 19.9% for AGIs $25k-50k , 71.3% for AGIs $100k-200k , 449.1% for AGIs over 200k ) Total itemized deductions: $35,566 (reported on 26.9% of returns )Here:
$35,566State:
$39,068
(% of AGI for various income ranges: 168.7% for AGIs below $25k , 300.5% for AGIs $25k-50k , 565.4% for AGIs $50k-75k , 824.0% for AGIs $75k-100k , 1676.1% for AGIs $100k-200k , 9112.7% for AGIs over 200k ) Charity contributions: $9,737 (reported on 21.9% of returns )(% of AGI for various income ranges: 8.9% for AGIs below $25k , 17.9% for AGIs $25k-50k , 49.7% for AGIs $50k-75k , 95.7% for AGIs $75k-100k , 194.5% for AGIs $100k-200k , 2742.9% for AGIs over 200k ) Taxes paid: $8,500 (reported on 26.8% of returns )(% of AGI for various income ranges: 37.6% for AGIs below $25k , 72.3% for AGIs $25k-50k , 164.1% for AGIs $50k-75k , 228.8% for AGIs $75k-100k , 475.5% for AGIs $100k-200k , 1928.7% for AGIs over 200k ) Earned income credit: $1,343 (reported on 3.4% of returns )(% of AGI for various income ranges: 31.3% for AGIs below $25k , 14.7% for AGIs $25k-50k ) Percentage of individuals using paid preparers for their 2020 taxes: 92.1%(% for various income ranges: 88.6% for AGIs below $25k , 90.9% for AGIs $25k-50k , 91.3% for AGIs $50k-75k , 92.4% for AGIs $75k-100k , 92.5% for AGIs $100k-200k , 95.2% for AGIs over 200k )
Averages for the 2012 tax year for zip code 98136, filed in 2013:
Average Adjusted Gross Income (AGI) in 2012: $105,289 (Individual Income Tax Returns) Here:
$105,289State:
$69,533
Salary/wage: $82,605 (reported on 80.8% of returns )Here:
$82,605State:
$57,267
(% of AGI for various income ranges: 69.2% for AGIs below $25k , 76.0% for AGIs $25k-50k , 74.5% for AGIs $50k-75k , 73.4% for AGIs $75k-100k , 78.4% for AGIs $100k-200k , 46.7% for AGIs over 200k ) Taxable interest for individuals: $1,730 (reported on 53.8% of returns )This zip code:
$1,730Washington:
$1,816
(% of AGI for various income ranges: 2.1% for AGIs below $25k , 1.1% for AGIs $25k-50k , 1.2% for AGIs $50k-75k , 1.1% for AGIs $75k-100k , 0.8% for AGIs $100k-200k , 0.7% for AGIs over 200k ) Ordinary dividends: $11,047 (reported on 37.5% of returns )(% of AGI for various income ranges: 5.6% for AGIs below $25k , 2.6% for AGIs $25k-50k , 2.6% for AGIs $50k-75k , 2.5% for AGIs $75k-100k , 1.9% for AGIs $100k-200k , 6.0% for AGIs over 200k ) Net capital gain/loss in AGI: +$24,312 (reported on 30.5% of returns )Here:
+$24,312State:
+$21,568
(% of AGI for various income ranges: 0.6% for AGIs $25k-50k , 1.0% for AGIs $50k-75k , 1.3% for AGIs $75k-100k , 1.4% for AGIs $100k-200k , 14.8% for AGIs over 200k ) Profit/loss from business: +$22,875 (reported on 16.6% of returns )Here:
+$22,875State:
+$16,521
(% of AGI for various income ranges: 10.1% for AGIs below $25k , 5.8% for AGIs $25k-50k , 4.1% for AGIs $50k-75k , 3.8% for AGIs $75k-100k , 3.5% for AGIs $100k-200k , 2.8% for AGIs over 200k ) Taxable individual retirement arrangement distribution: $19,040 (reported on 12.7% of returns )98136:
$19,040Washington:
$18,648
(% of AGI for various income ranges: 4.1% for AGIs below $25k , 2.8% for AGIs $25k-50k , 3.0% for AGIs $50k-75k , 3.5% for AGIs $75k-100k , 2.8% for AGIs $100k-200k , 1.4% for AGIs over 200k ) Self-employment retirement plans: $18,807 (reported on 1.8% of returns )98136:
$18,807Washington:
$20,087
(% of AGI for various income ranges: 0.4% for AGIs $50k-75k , 0.4% for AGIs $100k-200k , 0.4% for AGIs over 200k ) Total itemized deductions: $25,678 (15% of AGI, reported on 47.2% of returns )Here:
$25,678State:
$23,872
Here:
15.0% of AGIState:
18.2% of AGI
(% of AGI for various income ranges: 18.3% for AGIs below $25k , 12.1% for AGIs $25k-50k , 14.9% for AGIs $50k-75k , 15.0% for AGIs $75k-100k , 14.6% for AGIs $100k-200k , 7.5% for AGIs over 200k ) Charity contributions: $3,652 (reported on 39.9% of returns )(% of AGI for various income ranges: 1.3% for AGIs below $25k , 0.9% for AGIs $25k-50k , 1.2% for AGIs $50k-75k , 1.4% for AGIs $75k-100k , 1.5% for AGIs $100k-200k , 1.4% for AGIs over 200k ) Taxes paid: $7,441 (reported on 46.7% of returns )(% of AGI for various income ranges: 3.9% for AGIs below $25k , 3.2% for AGIs $25k-50k , 3.9% for AGIs $50k-75k , 4.3% for AGIs $75k-100k , 4.2% for AGIs $100k-200k , 2.4% for AGIs over 200k ) Earned income credit: $1,153 (reported on 5.5% of returns )(% of AGI for various income ranges: 1.6% for AGIs below $25k , 0.3% for AGIs $25k-50k ) Percentage of individuals using paid preparers for their 2012 taxes: 40.1%(% for various income ranges: 31.6% for AGIs below $25k , 31.8% for AGIs $25k-50k , 38.2% for AGIs $50k-75k , 45.7% for AGIs $75k-100k , 45.1% for AGIs $100k-200k , 66.7% for AGIs over 200k )
Averages for the 2004 tax year for zip code 98136, filed in 2005:
Average Adjusted Gross Income (AGI) in 2004: $69,582 (Individual Income Tax Returns) Here:
$69,582State:
$54,331
Salary/wage: $61,969 (reported on 78.8% of returns )Here:
$61,969State:
$45,761
(% of AGI for various income ranges: 160.3% for AGIs below $10k , 63.2% for AGIs $10k-25k , 77.6% for AGIs $25k-50k , 76.2% for AGIs $50k-75k , 78.9% for AGIs $75k-100k , 64.4% for AGIs over 100k ) Taxable interest for individuals: $2,333 (reported on 60.2% of returns )This zip code:
$2,333Washington:
$2,110
(% of AGI for various income ranges: 37.8% for AGIs below $10k , 4.6% for AGIs $10k-25k , 2.4% for AGIs $25k-50k , 2.2% for AGIs $50k-75k , 1.5% for AGIs $75k-100k , 1.6% for AGIs over 100k ) Taxable dividends: $5,392 (reported on 42.6% of returns )(% of AGI for various income ranges: 25.5% for AGIs below $10k , 4.7% for AGIs $10k-25k , 2.5% for AGIs $25k-50k , 2.4% for AGIs $50k-75k , 2.8% for AGIs $75k-100k , 3.6% for AGIs over 100k ) Net capital gain/loss: +$12,476 (reported on 35.5% of returns )Here:
+$12,476State:
+$15,835
(% of AGI for various income ranges: -4.4% for AGIs below $10k , 0.6% for AGIs $10k-25k , 0.7% for AGIs $25k-50k , 1.2% for AGIs $50k-75k , 1.6% for AGIs $75k-100k , 10.9% for AGIs over 100k ) Profit/loss from business: +$22,185 (reported on 16.2% of returns )Here:
+$22,185State:
+$13,994
(% of AGI for various income ranges: -6.3% for AGIs below $10k , 5.7% for AGIs $10k-25k , 4.2% for AGIs $25k-50k , 4.2% for AGIs $50k-75k , 4.3% for AGIs $75k-100k , 5.9% for AGIs over 100k ) IRA payment deduction: $3,277 (reported on 3.2% of returns )98136:
$3,277Washington:
$3,001
(% of AGI for various income ranges: 0.4% for AGIs $10k-25k , 0.3% for AGIs $25k-50k , 0.2% for AGIs $50k-75k , 0.2% for AGIs $75k-100k , 0.1% for AGIs over 100k ) Self-employed pension: $14,505 (reported on 2.4% of returns )Here:
$14,505Washington:
$14,244
(% of AGI for various income ranges: 0.2% for AGIs $25k-50k , 0.2% for AGIs $50k-75k , 0.4% for AGIs $75k-100k , 0.7% for AGIs over 100k ) Total itemized deductions: $21,676 (20% of AGI, reported on 47.5% of returns )Here:
$21,676State:
$19,669
Here:
20.1% of AGIState:
20.7% of AGI
(% of AGI for various income ranges: 93.9% for AGIs below $10k , 16.8% for AGIs $10k-25k , 14.8% for AGIs $25k-50k , 17.3% for AGIs $50k-75k , 18.8% for AGIs $75k-100k , 12.4% for AGIs over 100k ) Charity contributions deductions: $3,304 (3% of AGI, reported on 42.0% of returns )Here:
2.9% of AGIState:
3.5% of AGI
(% of AGI for various income ranges: 3.7% for AGIs below $10k , 1.3% for AGIs $10k-25k , 1.2% for AGIs $25k-50k , 1.5% for AGIs $50k-75k , 1.8% for AGIs $75k-100k , 2.4% for AGIs over 100k ) Total tax: $12,252 (reported on 86.7% of returns )98136:
$12,252State:
$9,065
(% of AGI for various income ranges: 6.7% for AGIs below $10k , 5.2% for AGIs $10k-25k , 8.9% for AGIs $25k-50k , 11.1% for AGIs $50k-75k , 11.8% for AGIs $75k-100k , 19.7% for AGIs over 100k ) Earned income credit: $1,103 (reported on 5.3% of returns )Percentage of individuals using paid preparers for their 2004 taxes: 45.6%(% for various income ranges: 41.6% for AGIs below $10k , 43.4% for AGIs $10k-25k , 40.6% for AGIs $25k-50k , 43.1% for AGIs $50k-75k , 46.6% for AGIs $75k-100k , 58.9% for AGIs over 100k )
Estimated median household income in 2022: This zip code:
$146,230Washington:
$91,306
Nearest zip codes: 98126 ,
98116 ,
98106 ,
98146 ,
98134 ,
98108 .
Seattle Zip Code Map
Percentage of family households: This zip code:
41.7%Washington:
45.0%
Percentage of households with unmarried partners: This zip code:
8.0%Washington:
48.7%
Likely homosexual households (counted as self-reported same-sex unmarried-partner households)
Lesbian couples: 0.5% of all households Gay men: 0.7% of all households
Household received Food Stamps/SNAP in the past 12 months: 391Household did not receive Food Stamps/SNAP in the past 12 months: 7,786
Women who had a birth in the past 12 months: 188 (129 now married , 56 unmarried) Women who did not have a birth in the past 12 months: 4,222 (2,335 now married , 1,874 unmarried)
Housing units in zip code 98136 with a mortgage: 4,156 (672
second mortgage , 26
home equity loan , 647
both second mortgage and home equity loan )
Houses without a mortgage: 81
Median monthly owner costs for units with a mortgage: $3,240
Median monthly owner costs for units without a mortgage: $1,084
Residents with income below the poverty level in 2022:
This zip code:
5.6%Whole state:
10.0%
Residents with income below 50% of the poverty level in 2022:
This zip code:
2.1%Whole state:
4.6%
Median number of rooms in houses and condos: Median number of rooms in apartments: Notable locations in this zip code not listed on our city pages
Click to draw/clear zip code borders Notable locations in zip code 98136: (A) , Colman Pool (B) , Seattle Public Utilities Southwest Barton Water Tower (C) . Display/hide their locations on the map
Churches in zip code 98136 include: (A) , Seattle Unitarian Fellowship Church (B) , Seaview United Methodist Church (C) , West Seattle Church of the Nazarene (D) , Church of Christ of West Seattle (E) , Gatewood Baptist Church (F) . Display/hide their locations on the map
Parks in zip code 98136 include: (1) , Fauntleroy Park (2) . Display/hide their locations on the map
Tourist attraction (not listed on the city page) :
Year house built (houses)
0 2020 or later1,019 2010 to 2019539 2000 to 2009595 1990 to 1999737 1980 to 1989422 1970 to 1979677 1960 to 19691,055 1950 to 1959673 1940 to 19492,853 1939 or earlier
Zip code 98136 household income distribution in 2022 161 Less than $10,000251 $10,000 to $14,99950 $15,000 to $19,999230 $20,000 to $24,99990 $25,000 to $29,99951 $30,000 to $34,999178 $35,000 to $39,999181 $40,000 to $44,99985 $45,000 to $49,999359 $50,000 to $59,999433 $60,000 to $74,999880 $75,000 to $99,999652 $100,000 to $124,999595 $125,000 to $149,9991,271 $150,000 to $199,9992,809 $200,000 or moreEstimate of home value of owner-occupied houses/condos in 2022 in zip code 98136 15 Less than $10,00011 $35,000 to $39,9998 $150,000 to $174,99927 $200,000 to $249,99917 $250,000 to $299,99966 $300,000 to $399,999269 $400,000 to $499,9991,660 $500,000 to $749,9992,341 $750,000 to $999,9991,250 $1,000,000 to $1,499,999630 $1,500,000 to $1,999,999361 $2,000,000 or moreRent paid by renters in 2022 in zip code 98136 13 $200 to $24917 $250 to $29941 $300 to $3498 $550 to $59913 $600 to $6499 $800 to $89947 $900 to $999201 $1,000 to $1,249620 $1,250 to $1,499515 $1,500 to $1,999522 $2,000 to $2,499195 $2,500 to $2,999490 $3,000 to $3,49963 $3,500 or more151 No cash rent
Median gross rent in 2022: $2,040.
Median price asked for vacant for-sale houses and condos in 2022: $259,305.
Estimated median house (or condo) value in 2022 for: White Non-Hispanic householders: $1,047,835Black or African American householders: $838,417American Indian or Alaska Native householders: $1,304,205Asian householders: $1,018,398Some other race householders: $1,068,330Two or more races householders: $709,487Hispanic or Latino householders: $931,575Estimated median house or condo value in 2022: $1,031,813
98136:
$1,031,813Washington:
$569,500
Lower value quartile - upper value quartile: $787,776 - $1,251,647
Mean price in 2022: Detached houses: $1,274,185Here:
$1,274,185State:
$734,307
Townhouses or other attached units: $827,273Here:
$827,273State:
$657,697
In 2-unit structures: $675,439Here:
$675,439State:
$534,634
In 3-to-4-unit structures: $1,828,237Here:
$1,828,237State:
$510,239
In 5-or-more-unit structures: $626,747Here:
$626,747State:
$503,183
Mobile homes: $218,940Here:
$218,940State:
$218,362
Occupied boats, RVs, vans, etc.: $467,608Here:
$467,608State:
$159,523
Housing units in structures:
One, detached: 5,896One, attached: 463Two: 773 or 4: 3265 to 9: 32810 to 19: 40520 to 49: 85850 or more: 271Unemployment : 3.3%
Means of transportation to work in zip code 98136 46.0% 4,969 Drove a car alone3.4% 367 Carpooled6.2% 667 Bus or trolley bus0.3% 37 Streetcar or trolley car0.1% 14 Railroad0.3% 30 Ferryboat0.1% 13 Motorcycle0.6% 66 Bicycle3.3% 355 Walked0.9% 92 Other means43.2% 4,666 Worked at homeTravel time to work (commute) in zip code 98136 170 Less than 5 minutes457 5 to 9 minutes460 10 to 14 minutes715 15 to 19 minutes838 20 to 24 minutes170 25 to 29 minutes1,232 30 to 34 minutes383 35 to 39 minutes448 40 to 44 minutes1,327 45 to 59 minutes519 60 to 89 minutes121 90 or more minutes
Neighborhoods in zip code 98136: Percentage of zip code residents living and working in this county: 99.6%
Household type by relationship:
Households: 17,640
Male householders: 4,545 (1,264 living alone ), Female householders: 3,629 (1,162 living alone )3,811 spouses (3,709 opposite-sex spouses ), 1,079 unmarried partners , (894 opposite-sex unmarried partners ), 3,360 children (3,097 natural , 158 adopted , 101 stepchildren ), 127 grandchildren , 184 brothers or sisters , 81 parents , 0 foster children , 39 other relatives , 824 non-relatives In group quarters: 74 (-1 institutionalized population )
Size of family households: 2,335 2-persons , 1,205 3-persons , 599 4-persons , 160 5-persons , 81 6-persons , 37 7-or-more-persons
Size of nonfamily households: 2,425 1-person , 1,291 2-persons , 115 3-persons
2,191 married couples with children. single-parent households (79 men , 389 women ).
87.5% of residents of 98136 zip code speak English at home. of residents speak Spanish at home (85% very well, 13% well, 1% not at all ).of residents speak other Indo-European language at home (84% very well, 9% well, 8% not well ).of residents speak Asian or Pacific Island language at home (59% very well, 16% well, 22% not well, 3% not at all ).of residents speak other language at home (100% very well ).
Foreign born population: 1,985 (11.3%)
(40.6%
of them are naturalized citizens )
This zip code:
11.3%Whole state:
15.3%
21% Honduras 11% India 6% France 5% Sweden 4% Bolivia 4% Iraq 3% Thailand 10% English 8% German 8% European 7% Irish 6% Italian 4% Norwegian 4% American
Year of entry for the foreign-born population
983 2010 or later 390 2000 to 2009 278 1990 to 1999 605 Before 1990
There are
114 Medical Specialists in Zip Code 98136 .
Facilities with environmental interests located in this zip code:
BIRD JOHNSON PORT (4100 W MARGINAL WAY SW in SEATTLE, WA)
(Resource Conservation and Recovery Act (tracking hazardous waste)) STATE MASTER (Washington State Department of Ecology's Facility/Site identification system) - HAZWASTE-WAD988476206, HAZARDOUS WASTE PROGRAM Business SIC classification: FABRICATED METAL PRODUCTS; ENGINEERING SERVICESBusiness NAICS classification: ALL OTHER MISCELLANEOUS FABRICATED METAL PRODUCT MANUFACTURING.Organizations: BIRD JOHNSON CO (CONTACT/OPERATOR)
, AXEL JOHNSON (CONTACT/OWNER)
47TH ERSKINE (47TH & ERSKINE in SEATTLE, WA)
(Resource Conservation and Recovery Act (tracking hazardous waste)) Organizations: WA ECY (CONTACT/OWNER)
ALKI BEACH PROPERTIES (2634 BEACH DR SW in SEATTLE, WA)
COMPLIANCE ACTIVITY (Tracking inspections of insecticide, fungicide, and rodenticide, and toxic substances)
Housing units lacking complete plumbing facilities: 0.7%
Housing units lacking complete kitchen facilities: 3.8%
49.3% Utility gas 44.0% Electricity 4.4% Fuel oil, kerosene, etc. 1.3% Wood
Population in 1990: 13,816. Population change in the 1990s: +322 (+2.3%).
Place of birth for U.S.-born residents:
This state: 7,854Northeast: 1,063Midwest: 1,882South: 1,205West: 3,390
56% of the 98136 zip code residents lived in the same house 5 years ago.
Out of people who lived in different houses, 66% lived in this county.
Out of people who lived in different counties, 50% lived in Washington.
88% of the 98136 zip code residents lived in the same house 1 year ago.
Out of people who lived in different houses, 67% moved from this county.
Out of people who lived in different houses, 7% moved from different county within same state.
Out of people who lived in different houses, 24% moved from different state.
Out of people who lived in different houses, 2% moved from abroad.
Private vs. public school enrollment:
Students in private schools in grades 1 to 8 (elementary and middle school): 373
Here:
28.0%Washington:
12.4%
Students in private schools in grades 9 to 12 (high school): 199
Here:
45.8%Washington:
9.2%
Students in private undergraduate colleges:
Here:
0.0%Washington:
16.5%
Occupation by median earnings in the past 12 months ($)
160,364 Legal occupations 152,587 Computer and mathematical occupations 140,715 Architecture and engineering occupations 131,083 Management occupations 105,995 Life, physical, and social science occupations 96,936 Business and financial operations occupations
Companies with federal contracts located in this zip code:
EUREDIL S.R.L. (VIA COMUNALE in MESSINA, In; small business)
$35,000 with Department of Veterans Affairs for ADP Support Equipment. Taking place in VA. Signed on 1999-10-15. Completion date: 2000-01-15.
BOZEAT, J & ASSOCIATES LLC (7333 CALIFORNIA AVE SW in SEATTLE, WA; small business)
$3,230 with Army for Power and Hand Pumps. Signed on 2005-09-22. Completion date: 2005-10-28.
Top industries in this zip code by the number of employees in 2005:
Accommodation and Food Services: Limited-Service Restaurants (100-249 employees: 1 establishment, 10-19 employees: 2 establishments, 5-9 employees: 2 establishments, 1-4 employees: 3 establishments)Health Care and Social Assistance: Continuing Care Retirement Communities (100-249: 1)Administrative and Support and Waste Management and Remediation Services: Professional Employer Organizations (100-249: 1)Other Services (except Public Administration): Religious Organizations (20-49: 2, 5-9: 1, 1-4: 1)Accommodation and Food Services: Full-Service Restaurants (20-49: 1, 10-19: 1, 5-9: 2, 1-4: 3)Accommodation and Food Services: Snack and Nonalcoholic Beverage Bars (20-49: 1, 10-19: 2, 1-4: 1)Health Care and Social Assistance: Child Day Care Services (20-49: 1, 5-9: 2, 1-4: 3)Other Services (except Public Administration): Beauty Salons (10-19: 2, 5-9: 1, 1-4: 7)
People in group quarters in 2010:
86 people in nursing facilities/skilled-nursing facilities
8 people in residential treatment centers for adults
5 people in group homes intended for adults
People in group quarters in 2000:
103 people in nursing homes
9 people in homes for the mentally retarded
8 people in other noninstitutional group quarters
Fatal accident statistics in 2013:
Fatal accident count: 1Vehicles involved in fatal accidents: 1Fatal accidents caused by drunken drivers: 0Fatalities: 1Persons involved in fatal accidents: 2Pedestrians involved in fatal accidents: 1
Home Mortgage Disclosure Act Aggregated Statistics For Year 2009(Based on 10 partial tracts) A) FHA, FSA/RHS & VA B) Conventional C) Refinancings D) Home Improvement Loans E) Loans on Dwellings For 5+ Families F) Non-occupant Loans on Number Average Value Number Average Value Number Average Value Number Average Value Number Average Value Number Average Value
LOANS ORIGINATED 165 $346,591 337 $319,148 1,512 $312,167 48 $196,109 2 $1,267,805 108 $279,922 APPLICATIONS APPROVED, NOT ACCEPTED 12 $390,268 23 $328,873 133 $324,088 5 $221,442 0 $0 8 $290,316 APPLICATIONS DENIED 14 $314,636 34 $318,654 319 $367,771 8 $95,495 0 $0 37 $321,177 APPLICATIONS WITHDRAWN 18 $353,861 35 $364,161 256 $348,346 14 $186,381 0 $0 21 $274,510 FILES CLOSED FOR INCOMPLETENESS 0 $0 3 $443,540 55 $333,311 4 $123,128 0 $0 5 $231,522
Aggregated Statistics For Year 2008(Based on 10 partial tracts) A) FHA, FSA/RHS & VA B) Conventional C) Refinancings D) Home Improvement Loans E) Loans on Dwellings For 5+ Families F) Non-occupant Loans on Number Average Value Number Average Value Number Average Value Number Average Value Number Average Value Number Average Value
LOANS ORIGINATED 44 $356,075 425 $333,674 658 $321,280 66 $158,761 10 $1,277,036 103 $283,823 APPLICATIONS APPROVED, NOT ACCEPTED 1 $351,320 62 $412,540 80 $301,427 10 $251,642 0 $0 12 $262,947 APPLICATIONS DENIED 1 $373,390 63 $368,609 268 $402,630 27 $165,764 0 $0 32 $263,232 APPLICATIONS WITHDRAWN 2 $382,990 60 $365,234 152 $385,798 10 $320,424 0 $0 23 $277,100 FILES CLOSED FOR INCOMPLETENESS 0 $0 10 $374,745 22 $350,663 4 $61,715 0 $0 4 $314,195
Aggregated Statistics For Year 2007(Based on 10 partial tracts) A) FHA, FSA/RHS & VA B) Conventional C) Refinancings D) Home Improvement Loans E) Loans on Dwellings For 5+ Families F) Non-occupant Loans on Number Average Value Number Average Value Number Average Value Number Average Value Number Average Value Number Average Value
LOANS ORIGINATED 5 $326,478 766 $346,161 779 $328,955 86 $195,103 21 $2,808,041 148 $330,030 APPLICATIONS APPROVED, NOT ACCEPTED 0 $0 98 $313,920 93 $344,486 15 $183,507 0 $0 20 $318,332 APPLICATIONS DENIED 3 $227,357 101 $430,157 244 $361,577 49 $156,088 0 $0 47 $338,348 APPLICATIONS WITHDRAWN 2 $182,990 78 $373,058 94 $352,990 11 $318,623 2 $383,100 14 $406,569 FILES CLOSED FOR INCOMPLETENESS 0 $0 15 $473,313 20 $361,302 5 $168,452 0 $0 5 $288,506
Aggregated Statistics For Year 2006(Based on 10 partial tracts) A) FHA, FSA/RHS & VA B) Conventional C) Refinancings D) Home Improvement Loans E) Loans on Dwellings For 5+ Families F) Non-occupant Loans on Number Average Value Number Average Value Number Average Value Number Average Value Number Average Value Number Average Value
LOANS ORIGINATED 5 $250,974 966 $298,775 844 $298,576 83 $154,914 10 $1,782,802 163 $284,257 APPLICATIONS APPROVED, NOT ACCEPTED 0 $0 114 $307,394 115 $282,721 22 $152,081 2 $815,995 23 $343,380 APPLICATIONS DENIED 0 $0 119 $321,420 205 $291,777 38 $116,616 0 $0 28 $323,870 APPLICATIONS WITHDRAWN 0 $0 94 $285,659 178 $296,807 9 $110,698 0 $0 20 $339,593 FILES CLOSED FOR INCOMPLETENESS 0 $0 13 $330,454 29 $287,917 7 $329,857 2 $676,430 4 $167,555
Aggregated Statistics For Year 2005(Based on 10 partial tracts) A) FHA, FSA/RHS & VA B) Conventional C) Refinancings D) Home Improvement Loans E) Loans on Dwellings For 5+ Families F) Non-occupant Loans on G) Loans On Manufactured Number Average Value Number Average Value Number Average Value Number Average Value Number Average Value Number Average Value Number Average Value
LOANS ORIGINATED 1 $315,660 1,015 $270,584 1,058 $276,373 101 $180,271 19 $1,218,071 163 $237,504 2 $79,010 APPLICATIONS APPROVED, NOT ACCEPTED 0 $0 67 $279,662 121 $251,561 6 $172,995 0 $0 13 $309,207 0 $0 APPLICATIONS DENIED 4 $180,985 108 $258,318 244 $300,936 25 $173,276 0 $0 28 $193,679 0 $0 APPLICATIONS WITHDRAWN 0 $0 86 $273,687 200 $267,901 20 $216,682 0 $0 19 $362,207 2 $301,850 FILES CLOSED FOR INCOMPLETENESS 0 $0 12 $232,914 60 $299,502 0 $0 2 $462,685 2 $230,105 0 $0
Aggregated Statistics For Year 2004(Based on 10 partial tracts) A) FHA, FSA/RHS & VA B) Conventional C) Refinancings D) Home Improvement Loans E) Loans on Dwellings For 5+ Families F) Non-occupant Loans on G) Loans On Manufactured Number Average Value Number Average Value Number Average Value Number Average Value Number Average Value Number Average Value Number Average Value
LOANS ORIGINATED 10 $237,570 993 $247,424 1,149 $243,617 78 $110,885 15 $1,040,782 157 $202,315 0 $0 APPLICATIONS APPROVED, NOT ACCEPTED 1 $200,940 97 $260,667 98 $258,354 10 $154,535 4 $389,988 19 $238,561 0 $0 APPLICATIONS DENIED 2 $237,670 80 $218,742 244 $255,216 35 $64,639 0 $0 21 $221,255 0 $0 APPLICATIONS WITHDRAWN 0 $0 79 $262,319 190 $247,424 12 $140,202 0 $0 23 $262,079 2 $221,405 FILES CLOSED FOR INCOMPLETENESS 0 $0 11 $322,800 67 $291,318 2 $33,200 0 $0 2 $144,570 2 $329,815
Aggregated Statistics For Year 2003(Based on 10 partial tracts) A) FHA, FSA/RHS & VA B) Conventional C) Refinancings D) Home Improvement Loans E) Loans on Dwellings For 5+ Families F) Non-occupant Loans on Number Average Value Number Average Value Number Average Value Number Average Value Number Average Value Number Average Value
LOANS ORIGINATED 34 $212,429 847 $237,365 3,083 $216,419 73 $49,313 12 $746,481 271 $170,773 APPLICATIONS APPROVED, NOT ACCEPTED 2 $215,100 65 $301,893 271 $216,775 25 $25,692 0 $0 13 $153,462 APPLICATIONS DENIED 2 $212,655 63 $250,797 325 $243,354 23 $97,450 2 $469,200 29 $181,502 APPLICATIONS WITHDRAWN 4 $193,770 81 $246,689 271 $228,425 14 $37,874 0 $0 28 $150,765 FILES CLOSED FOR INCOMPLETENESS 0 $0 15 $392,329 49 $216,384 2 $23,460 0 $0 4 $201,480
Aggregated Statistics For Year 2002(Based on 10 partial tracts) A) FHA, FSA/RHS & VA B) Conventional C) Refinancings D) Home Improvement Loans E) Loans on Dwellings For 5+ Families F) Non-occupant Loans on Number Average Value Number Average Value Number Average Value Number Average Value Number Average Value Number Average Value
LOANS ORIGINATED 36 $199,756 722 $226,016 2,051 $219,006 55 $37,928 13 $641,239 145 $173,530 APPLICATIONS APPROVED, NOT ACCEPTED 5 $133,298 52 $221,743 217 $234,232 16 $40,442 0 $0 23 $203,739 APPLICATIONS DENIED 1 $107,600 54 $204,058 212 $201,405 31 $22,475 1 $3,625,920 29 $196,756 APPLICATIONS WITHDRAWN 4 $142,858 61 $213,546 220 $212,030 8 $34,115 0 $0 19 $189,623 FILES CLOSED FOR INCOMPLETENESS 0 $0 16 $175,778 69 $223,727 6 $114,627 0 $0 4 $131,480
Aggregated Statistics For Year 2001(Based on 10 partial tracts) A) FHA, FSA/RHS & VA B) Conventional C) Refinancings D) Home Improvement Loans E) Loans on Dwellings For 5+ Families F) Non-occupant Loans on Number Average Value Number Average Value Number Average Value Number Average Value Number Average Value Number Average Value
LOANS ORIGINATED 51 $193,342 643 $209,037 1,681 $204,888 135 $57,322 6 $566,928 121 $164,542 APPLICATIONS APPROVED, NOT ACCEPTED 2 $196,280 42 $243,329 155 $210,590 26 $37,431 2 $938,400 10 $112,169 APPLICATIONS DENIED 2 $145,430 61 $233,865 207 $187,797 53 $42,531 0 $0 23 $214,731 APPLICATIONS WITHDRAWN 7 $225,550 56 $182,128 163 $185,695 17 $38,139 0 $0 13 $126,088 FILES CLOSED FOR INCOMPLETENESS 0 $0 17 $162,545 47 $188,009 0 $0 0 $0 0 $0
Aggregated Statistics For Year 2000(Based on 10 partial tracts) A) FHA, FSA/RHS & VA B) Conventional C) Refinancings D) Home Improvement Loans E) Loans on Dwellings For 5+ Families F) Non-occupant Loans on Number Average Value Number Average Value Number Average Value Number Average Value Number Average Value Number Average Value
LOANS ORIGINATED 39 $175,957 557 $207,135 343 $177,907 177 $37,127 3 $601,820 61 $158,049 APPLICATIONS APPROVED, NOT ACCEPTED 0 $0 53 $202,240 64 $174,134 27 $28,870 0 $0 5 $123,416 APPLICATIONS DENIED 0 $0 54 $204,998 117 $160,585 63 $31,877 2 $383,100 7 $115,889 APPLICATIONS WITHDRAWN 5 $116,326 39 $205,599 72 $155,757 11 $49,433 1 $339,930 6 $127,900 FILES CLOSED FOR INCOMPLETENESS 0 $0 4 $233,645 28 $154,974 2 $24,345 0 $0 0 $0
Aggregated Statistics For Year 1999(Based on 4 partial tracts) A) FHA, FSA/RHS & VA B) Conventional C) Refinancings D) Home Improvement Loans E) Loans on Dwellings For 5+ Families F) Non-occupant Loans on Number Average Value Number Average Value Number Average Value Number Average Value Number Average Value Number Average Value
LOANS ORIGINATED 12 $174,048 130 $190,021 150 $156,230 32 $173,130 3 $1,100,460 25 $130,777 APPLICATIONS APPROVED, NOT ACCEPTED 0 $0 12 $181,067 23 $154,965 7 $22,311 0 $0 3 $135,803 APPLICATIONS DENIED 1 $62,070 16 $147,392 34 $184,841 11 $33,962 0 $0 2 $164,495 APPLICATIONS WITHDRAWN 2 $125,505 8 $161,206 27 $153,862 2 $24,390 0 $0 3 $123,380 FILES CLOSED FOR INCOMPLETENESS 0 $0 3 $148,107 10 $127,609 0 $0 0 $0 0 $0
Private Mortgage Insurance Companies Aggregated Statistics For Year 2009(Based on 10 partial tracts) A) Conventional B) Refinancings Number Average Value Number Average Value
LOANS ORIGINATED 34 $319,700 14 $381,771 APPLICATIONS APPROVED, NOT ACCEPTED 5 $296,540 8 $347,316 APPLICATIONS DENIED 13 $373,009 8 $350,454 APPLICATIONS WITHDRAWN 2 $273,700 6 $326,497 FILES CLOSED FOR INCOMPLETENESS 2 $279,955 0 $0
Aggregated Statistics For Year 2008(Based on 10 partial tracts) A) Conventional B) Refinancings C) Non-occupant Loans on Number Average Value Number Average Value Number Average Value
LOANS ORIGINATED 122 $342,643 26 $366,427 4 $270,560 APPLICATIONS APPROVED, NOT ACCEPTED 21 $371,399 7 $389,947 0 $0 APPLICATIONS DENIED 3 $434,593 0 $0 1 $225,860 APPLICATIONS WITHDRAWN 6 $367,183 2 $378,505 0 $0 FILES CLOSED FOR INCOMPLETENESS 0 $0 0 $0 0 $0
Aggregated Statistics For Year 2007(Based on 10 partial tracts) A) Conventional B) Refinancings C) Non-occupant Loans on Number Average Value Number Average Value Number Average Value
LOANS ORIGINATED 89 $337,836 16 $354,396 1 $401,710 APPLICATIONS APPROVED, NOT ACCEPTED 9 $433,572 0 $0 2 $571,430 APPLICATIONS DENIED 0 $0 0 $0 0 $0 APPLICATIONS WITHDRAWN 5 $375,468 2 $373,535 0 $0 FILES CLOSED FOR INCOMPLETENESS 0 $0 0 $0 0 $0
Aggregated Statistics For Year 2006(Based on 10 partial tracts) A) Conventional B) Refinancings C) Non-occupant Loans on Number Average Value Number Average Value Number Average Value
LOANS ORIGINATED 25 $292,320 13 $378,024 0 $0 APPLICATIONS APPROVED, NOT ACCEPTED 5 $356,032 5 $274,330 1 $263,630 APPLICATIONS DENIED 0 $0 0 $0 0 $0 APPLICATIONS WITHDRAWN 2 $372,185 2 $199,425 0 $0 FILES CLOSED FOR INCOMPLETENESS 3 $184,553 0 $0 0 $0
Aggregated Statistics For Year 2005(Based on 10 partial tracts) A) Conventional B) Refinancings C) Non-occupant Loans on Number Average Value Number Average Value Number Average Value
LOANS ORIGINATED 30 $267,372 15 $331,301 1 $461,410 APPLICATIONS APPROVED, NOT ACCEPTED 2 $181,440 3 $284,057 0 $0 APPLICATIONS DENIED 2 $325,220 0 $0 2 $325,220 APPLICATIONS WITHDRAWN 2 $200,975 6 $356,435 0 $0 FILES CLOSED FOR INCOMPLETENESS 0 $0 0 $0 0 $0
Aggregated Statistics For Year 2004(Based on 10 partial tracts) A) Conventional B) Refinancings C) Non-occupant Loans on Number Average Value Number Average Value Number Average Value
LOANS ORIGINATED 69 $262,043 21 $245,931 5 $273,452 APPLICATIONS APPROVED, NOT ACCEPTED 8 $262,321 5 $248,024 2 $134,460 APPLICATIONS DENIED 0 $0 0 $0 0 $0 APPLICATIONS WITHDRAWN 2 $142,395 0 $0 1 $152,590 FILES CLOSED FOR INCOMPLETENESS 0 $0 3 $318,010 0 $0
Aggregated Statistics For Year 2003(Based on 10 partial tracts) A) Conventional B) Refinancings C) Non-occupant Loans on Number Average Value Number Average Value Number Average Value
LOANS ORIGINATED 103 $254,399 70 $249,508 10 $227,299 APPLICATIONS APPROVED, NOT ACCEPTED 24 $259,536 26 $252,982 7 $231,730 APPLICATIONS DENIED 0 $0 2 $220,630 2 $197,065 APPLICATIONS WITHDRAWN 7 $226,749 0 $0 3 $210,413 FILES CLOSED FOR INCOMPLETENESS 0 $0 0 $0 0 $0
Aggregated Statistics For Year 2002(Based on 10 partial tracts) A) Conventional B) Refinancings C) Non-occupant Loans on Number Average Value Number Average Value Number Average Value
LOANS ORIGINATED 137 $237,478 62 $242,240 7 $224,807 APPLICATIONS APPROVED, NOT ACCEPTED 19 $240,827 14 $193,229 3 $218,440 APPLICATIONS DENIED 0 $0 2 $367,005 0 $0 APPLICATIONS WITHDRAWN 10 $231,673 3 $202,330 0 $0 FILES CLOSED FOR INCOMPLETENESS 0 $0 0 $0 0 $0
Aggregated Statistics For Year 2001(Based on 10 partial tracts) A) Conventional B) Refinancings C) Non-occupant Loans on Number Average Value Number Average Value Number Average Value
LOANS ORIGINATED 110 $222,507 68 $224,892 2 $120,570 APPLICATIONS APPROVED, NOT ACCEPTED 15 $219,321 14 $220,167 0 $0 APPLICATIONS DENIED 3 $120,673 1 $233,370 0 $0 APPLICATIONS WITHDRAWN 5 $238,196 1 $194,140 0 $0 FILES CLOSED FOR INCOMPLETENESS 0 $0 1 $147,300 1 $147,300
Aggregated Statistics For Year 2000(Based on 10 partial tracts) A) Conventional B) Refinancings Number Average Value Number Average Value
LOANS ORIGINATED 141 $223,426 21 $203,767 APPLICATIONS APPROVED, NOT ACCEPTED 12 $202,790 6 $140,638 APPLICATIONS DENIED 2 $282,735 3 $227,847 APPLICATIONS WITHDRAWN 6 $207,078 2 $101,660 FILES CLOSED FOR INCOMPLETENESS 3 $225,413 0 $0
Aggregated Statistics For Year 1999(Based on 4 partial tracts) A) Conventional B) Refinancings C) Non-occupant Loans on Number Average Value Number Average Value Number Average Value
LOANS ORIGINATED 44 $195,341 5 $152,884 1 $163,300 APPLICATIONS APPROVED, NOT ACCEPTED 3 $194,687 1 $248,120 0 $0 APPLICATIONS DENIED 1 $260,760 0 $0 0 $0 APPLICATIONS WITHDRAWN 0 $0 1 $157,770 0 $0 FILES CLOSED FOR INCOMPLETENESS 0 $0 0 $0 0 $0
2003 - 2018 National Fire Incident Reporting System (NFIRS) incidents See full 2006 National Fire Incident Reporting System statistics for zip code 98136, Washington
Most common first names in zip code 98136 among deceased individuals Name Count Lived (average)
John 90 74.6 years Robert 81 72.5 years Mary 78 82.0 years William 68 78.6 years Helen 56 81.5 years James 56 73.9 years George 49 78.3 years Margaret 48 80.9 years Dorothy 42 81.6 years Ruth 41 86.8 years
Most common last names in zip code 98136 among deceased individuals Last name Count Lived (average)
Johnson 39 76.8 years Smith 38 77.9 years Anderson 23 79.3 years Miller 21 80.8 years Nelson 19 79.7 years Brown 19 80.7 years Olson 15 82.3 years Jones 15 81.7 years Williams 14 77.5 years Peterson 14 82.4 years
Businesses in zip code 98136
Name Count Name Count
AT&T 1 Rite Aid 1 Blockbuster 1 Starbucks 1 McDonald's 1 Subway 1 Papa John's Pizza 1 UPS 2


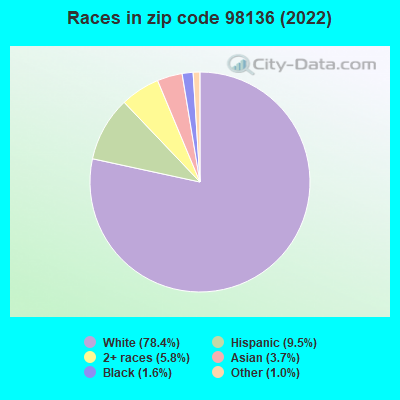


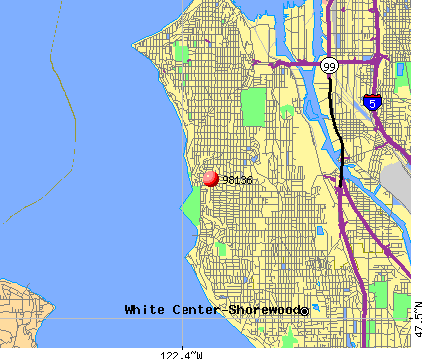 Nearest zip codes: 98126, 98116, 98106, 98146, 98134, 98108.
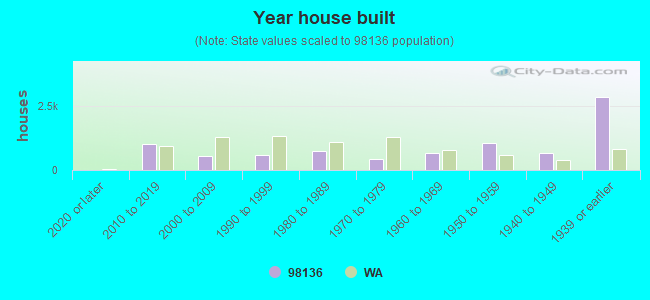

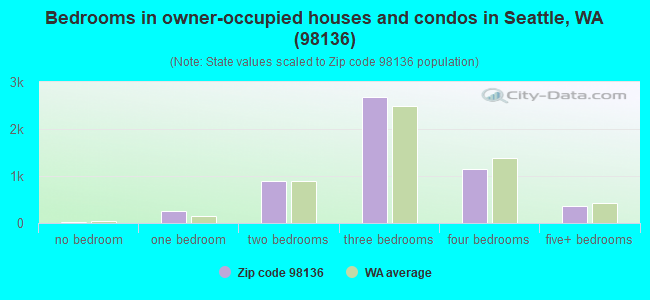
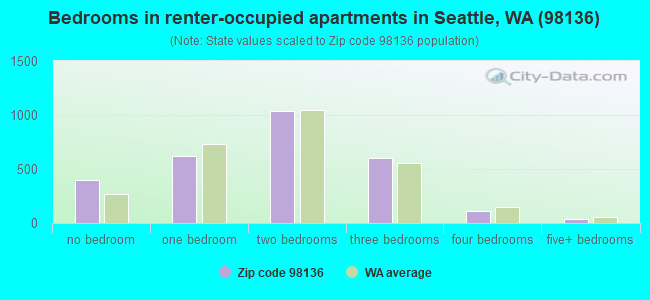
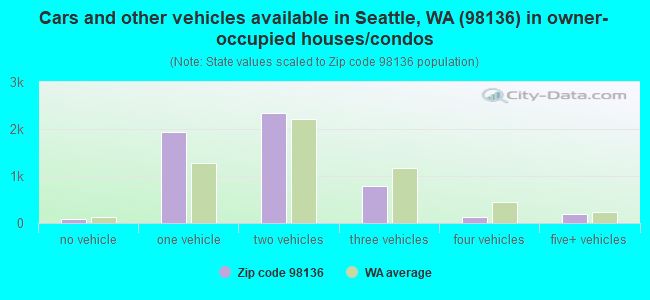
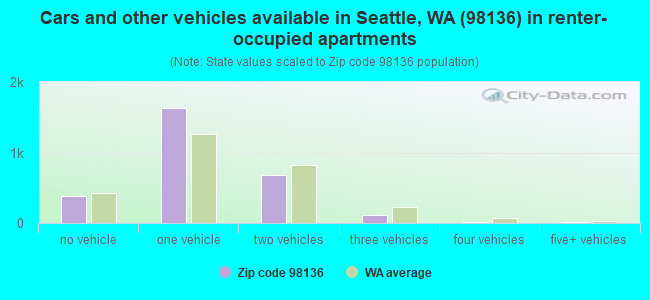


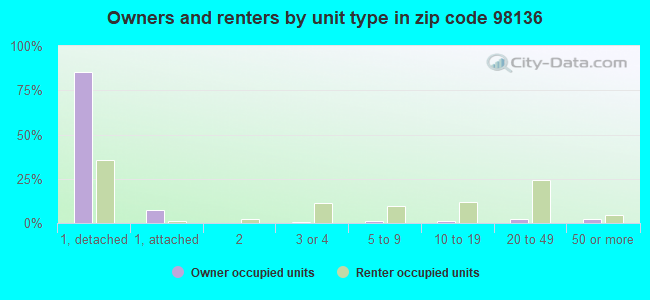
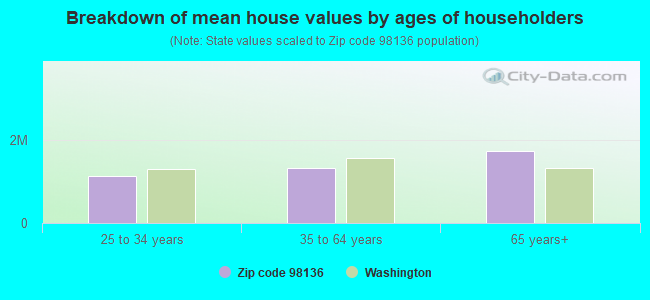


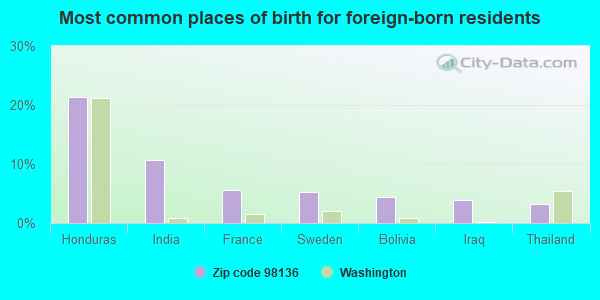
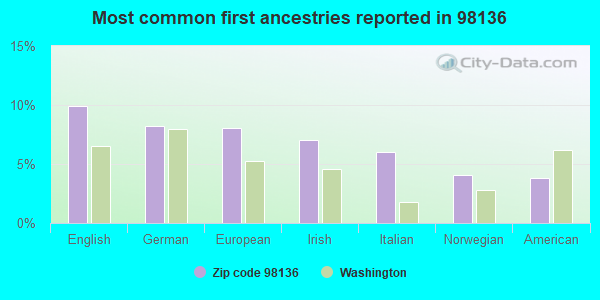
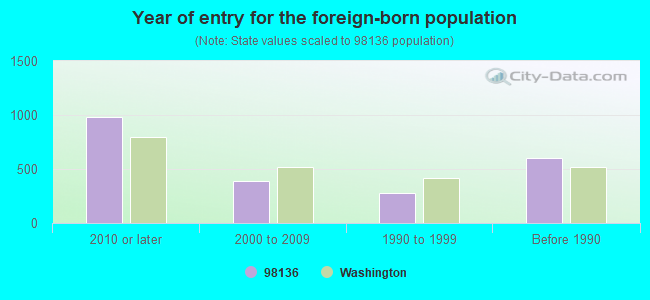

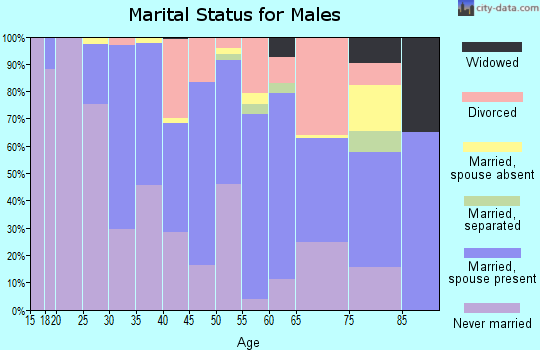
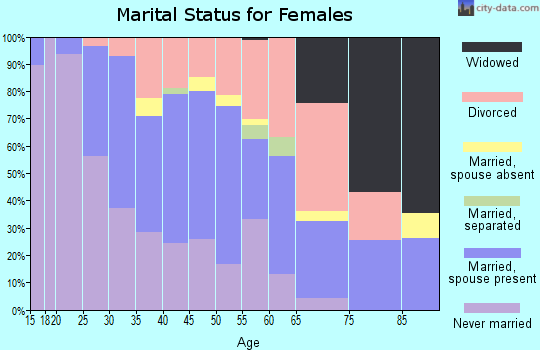
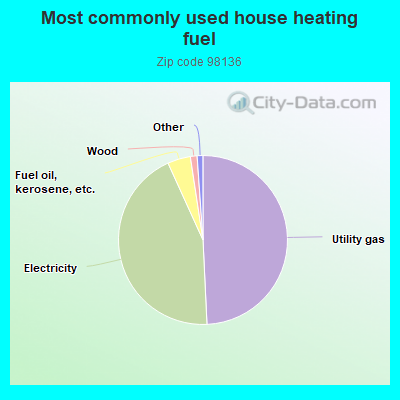

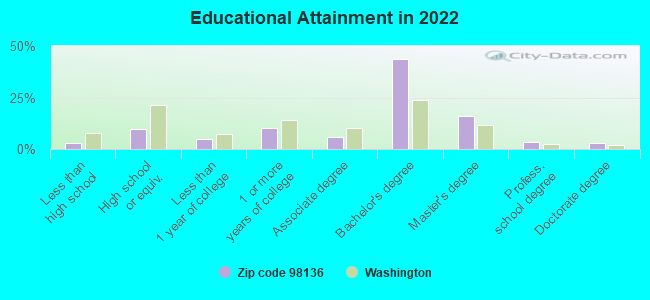

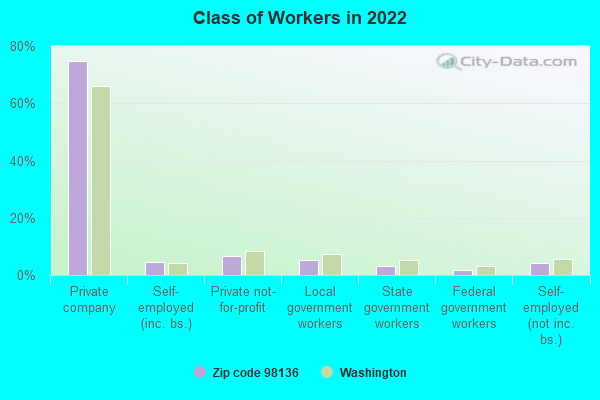
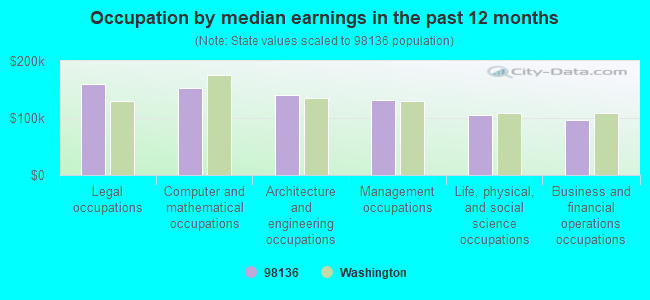
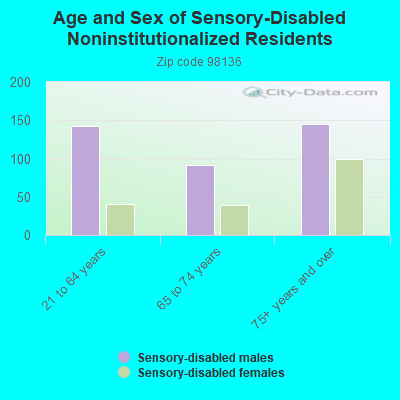
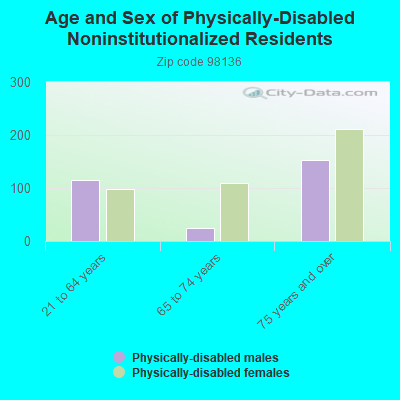
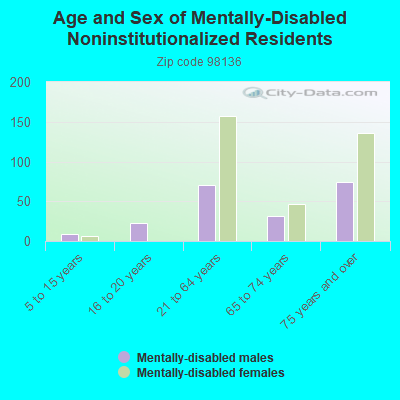

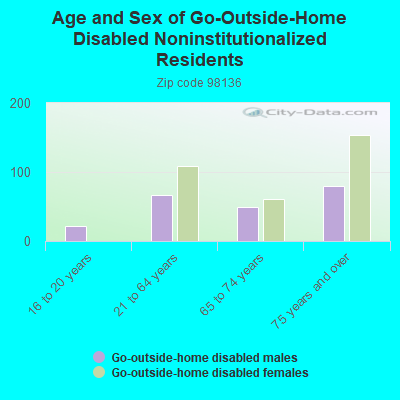
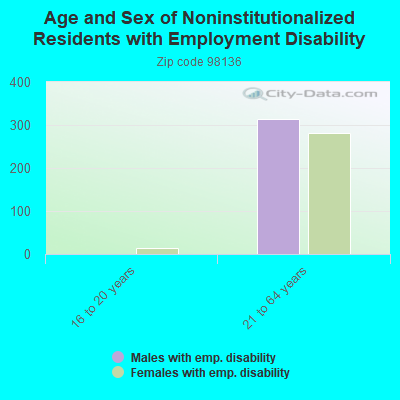
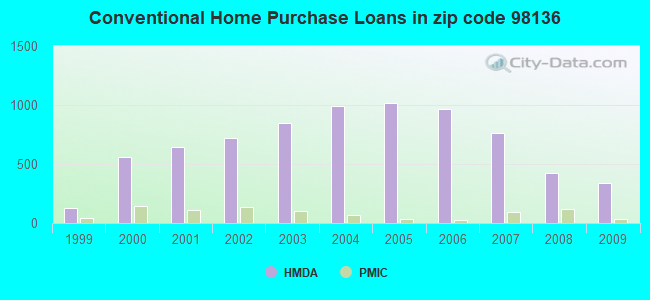
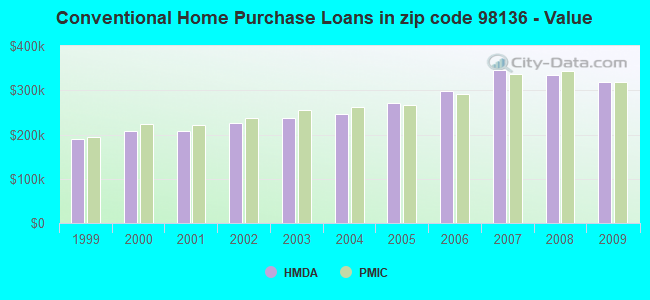
 According to the data from the years 2003 - 2018 the average number of fire incidents per year is 19. The highest number of fires - 30 took place in 2006, and the least - 3 in 2003. The data has an increasing trend.
 When looking into fire subcategories, the most incidents belonged to: Outside Fires (47.5%), and Structure Fires (34.7%).