Estimated median house/condo value in 2022: $479,395
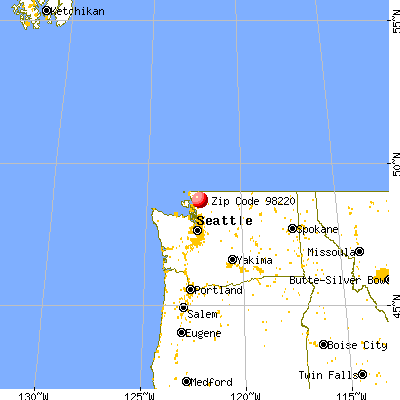
98220:
$479,395
Washington:
$569,500
Median resident age:
This zip code:
41.8 years
Washington median age:
38.4 years
Average household size:
This zip code:
3.0 people
Washington:
2.5 people
Averages for the 2020 tax year for zip code 98220, filed in 2021:
Average Adjusted Gross Income (AGI) in 2020: $66,640 (Individual Income Tax Returns)
Here:
$66,640
State:
$99,264
Salary/wage: $54,830 (reported on 77.1% of returns)
Here:
$54,830
State:
$80,347
(% of AGI for various income ranges: 1200.0% for AGIs below $25k, 3057.1% for AGIs $25k-50k, 5372.0% for AGIs $50k-75k, 11045.0% for AGIs $75k-100k, 23496.7% for AGIs $100k-200k)
Taxable interest for individuals: $367 (reported on 34.3% of returns)
This zip code:
$367
Washington:
$2,077
(% of AGI for various income ranges: 11.4% for AGIs $25k-50k, 14.0% for AGIs $50k-75k, 96.7% for AGIs $100k-200k)
Ordinary dividends: $2,183 (reported on 17.1% of returns)
Here:
$2,183
State:
$10,013
(% of AGI for various income ranges: 85.0% for AGIs below $25k, 400.0% for AGIs $75k-100k)
Net capital gain/loss in AGI: +$4,850 (reported on 17.1% of returns)
Here:
+$4,850
State:
+$40,092
(% of AGI for various income ranges: 1475.0% for AGIs $75k-100k)
Profit/loss from business: +$14,375 (reported on 11.4% of returns)
Here:
+$14,375
State:
+$18,312
(% of AGI for various income ranges: 93.3% for AGIs below $25k, 2595.0% for AGIs $75k-100k)
Taxable individual retirement arrangement distribution: $8,550 (reported on 5.7% of returns)
98220:
$8,550
Washington:
$24,221
(% of AGI for various income ranges: 285.0% for AGIs below $25k)
Earned income credit: $1,600 (reported on 14.3% of returns)
Here:
$1,600
State:
$2,020
(% of AGI for various income ranges: 133.3% for AGIs below $25k)
Percentage of individuals using paid preparers for their 2020 taxes: 91.4%
Here:
91%
State:
93%
(% for various income ranges: 88.9% for AGIs below $25k, 88.9% for AGIs $25k-50k, 100.0% for AGIs $50k-75k, 100.0% for AGIs $75k-100k, 85.7% for AGIs $100k-200k)
Averages for the 2012 tax year for zip code 98220, filed in 2013:
Average Adjusted Gross Income (AGI) in 2012: $50,119 (Individual Income Tax Returns)
Here:
$50,119
State:
$69,533
Salary/wage: $41,344 (reported on 80.6% of returns)
Here:
$41,344
State:
$57,267
(% of AGI for various income ranges: 67.4% for AGIs below $25k, 72.1% for AGIs $25k-50k, 75.7% for AGIs $50k-75k, 136.7% for AGIs $75k-100k)
Taxable interest for individuals: $230 (reported on 32.3% of returns)
This zip code:
$230
Washington:
$1,816
(% of AGI for various income ranges: 0.4% for AGIs below $25k, 0.2% for AGIs $25k-50k, 0.4% for AGIs $75k-100k)
Ordinary dividends: $1,060 (reported on 16.1% of returns)
Here:
$1,060
State:
$8,163
Profit/loss from business: +$4,980 (reported on 16.1% of returns)
Here:
+$4,980
State:
+$16,521
Total itemized deductions: $18,456 (22% of AGI, reported on 29.0% of returns)
Here:
$18,456
State:
$23,872
Here:
22.2% of AGI
State:
18.2% of AGI
Charity contributions: $3,040 (reported on 16.1% of returns)
Here:
$3,040
State:
$4,465
Taxes paid: $4,588 (reported on 25.8% of returns)
98220:
$4,588
State:
$6,400
Earned income credit: $1,460 (reported on 16.1% of returns)
Here:
$1,460
State:
$2,073
(% of AGI for various income ranges: 5.8% for AGIs below $25k)
Percentage of individuals using paid preparers for their 2012 taxes: 45.2%
Here:
45%
State:
43%
(% for various income ranges: 36.4% for AGIs below $25k, 44.4% for AGIs $25k-50k, 40.0% for AGIs $50k-75k, 100.0% for AGIs $75k-100k)
Averages for the 2004 tax year for zip code 98220, filed in 2005:
Average Adjusted Gross Income (AGI) in 2004: $36,162 (Individual Income Tax Returns)
Here:
$36,162
State:
$54,331
Salary/wage: $32,495 (reported on 87.6% of returns)
Here:
$32,495
State:
$45,761
(% of AGI for various income ranges: 93.8% for AGIs below $10k, 78.2% for AGIs $10k-25k, 86.6% for AGIs $25k-50k, 82.8% for AGIs $50k-75k, 83.8% for AGIs $75k-100k, 54.6% for AGIs over 100k)
Taxable interest for individuals: $577 (reported on 39.6% of returns)
This zip code:
$577
Washington:
$2,110
(% of AGI for various income ranges: 2.1% for AGIs below $10k, 1.1% for AGIs $10k-25k, 1.1% for AGIs $25k-50k, 0.2% for AGIs $50k-75k, 0.3% for AGIs $75k-100k, 0.3% for AGIs over 100k)
Taxable dividends: $1,196 (reported on 14.7% of returns)
Here:
$1,196
State:
$5,879
Net capital gain/loss: +$5,324 (reported on 10.7% of returns)
Here:
+$5,324
State:
+$15,835
Profit/loss from business: +$7,413 (reported on 13.3% of returns)
Here:
+$7,413
State:
+$13,994
Total itemized deductions: $14,516 (24% of AGI, reported on 26.9% of returns)
Here:
$14,516
State:
$19,669
Here:
23.6% of AGI
State:
20.7% of AGI
(% of AGI for various income ranges: 9.6% for AGIs $10k-25k, 10.9% for AGIs $25k-50k, 13.1% for AGIs $50k-75k, 11.4% for AGIs $75k-100k, 9.4% for AGIs over 100k)
Charity contributions deductions: $1,662 (3% of AGI, reported on 18.8% of returns)
Here:
$1,662
State:
$3,569
Here:
2.6% of AGI
State:
3.5% of AGI
Total tax: $4,793 (reported on 71.1% of returns)
98220:
$4,793
State:
$9,065
(% of AGI for various income ranges: 2.4% for AGIs below $10k, 5.1% for AGIs $10k-25k, 6.5% for AGIs $25k-50k, 8.9% for AGIs $50k-75k, 11.3% for AGIs $75k-100k, 16.7% for AGIs over 100k)
Earned income credit: $1,242 (reported on 17.9% of returns)
Here:
$1,242
State:
$1,607
Percentage of individuals using paid preparers for their 2004 taxes: 44.5%
Here:
45%
State:
49%
(% for various income ranges: 42.0% for AGIs below $10k, 45.9% for AGIs $10k-25k, 41.5% for AGIs $25k-50k, 44.9% for AGIs $50k-75k, 87.0% for AGIs $75k-100k)
Notable locations in zip code 98220: Lummi Indian Business Council Skookum Creek Fish Hatchery (A), Shetler Dairy (B), Whatcom County Fire District 16 (C). Display/hide their locations on the map
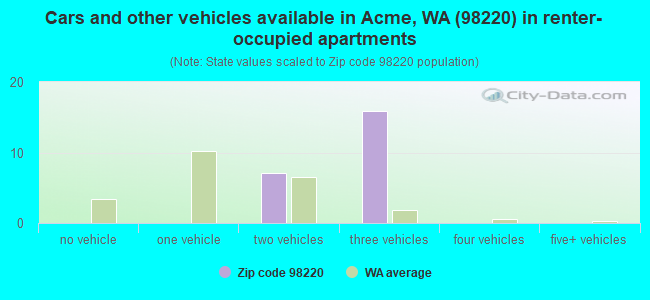
Size of family households: 36 2-persons, 23 3-persons, 42 4-persons, 21 5-persons
Size of nonfamily households: 72 2-persons
46 married couples with children.
0 single-parent households ().
98.1% of residents of 98220 zip code speak English at home.
Foreign born population: 0 (0.0%)
:
0.0%
Whole state:
15.3%
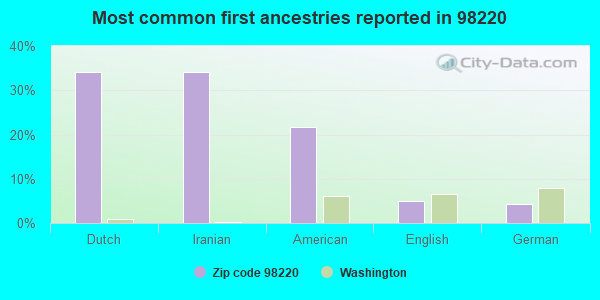
34%Dutch
34%Iranian
22%American
5%English
4%German
Facilities with environmental interests located in this zip code:
ACME ELEMENTARY SCHOOL (5200 TURKINGTON RD in ACME, WA)
(National Center for Education Statistics) - STATE ID-2585 STATE MASTER (Washington State Department of Ecology's Facility/Site identification system) - TOXICS-610, UNDERGROUND STORAGE TANK PROGRAM Organizations: MOUNT BAKER SCH DIST 507 (SCHOOL DISTRICT)
CONCRETE NORWEST SAXON PIT (INTERSECT OF DORAN RD& BOWMAN RD in ACME, WA)
National Pollutant Discharge Elimination System NON-MAJOR (Tracking pollutant discharge elimination systems) - permit STATE MASTER (Washington State Department of Ecology's Facility/Site identification system) - WATQUAL-WAG503013, National Pollutant Discharge Elimination System Permit Business SIC classification: CONSTRUCTION SAND AND GRAVEL Organizations: CONCRETE NOR'WEST (CONTACT/OPERATOR)
ACME LANDFILL (MOSQUITO LAKE ROAD in ACME, WA)
SUPERFUND (Superfund database) STATE MASTER (Washington State Department of Ecology's Facility/Site identification system) - TOXICS-, GROUND WATER PROGRAM Business SIC classification: REFUSE SYSTEMS Alternative names: WHATCOM CO - ACME LDFL
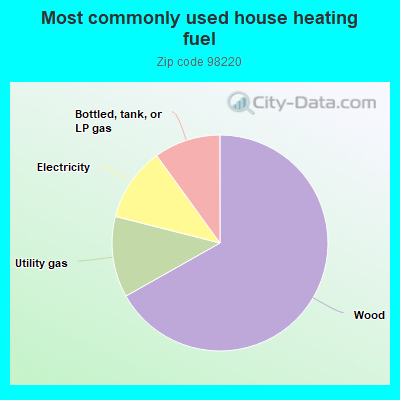
67.7%Wood
12.3%Utility gas
11.2%Electricity
10.1%Bottled, tank, or LP gas
Population in 1990: 471. Population change in the 1990s: +177 (+37.6%).
Place of birth for U.S.-born residents:
This state: 375
Midwest: 123
South: 6
West: 74
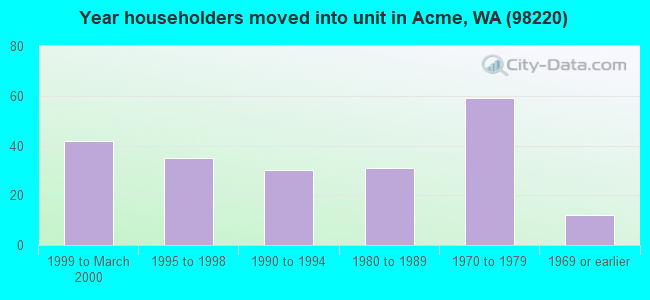
62% of the 98220 zip code residents lived in the same house 5 years ago. Out of people who lived in different houses, 67% lived in this county.
85% of the 98220 zip code residents lived in the same house 1 year ago. Out of people who lived in different houses, 67% moved from this county. Out of people who lived in different houses, 25% moved from different county within same state.
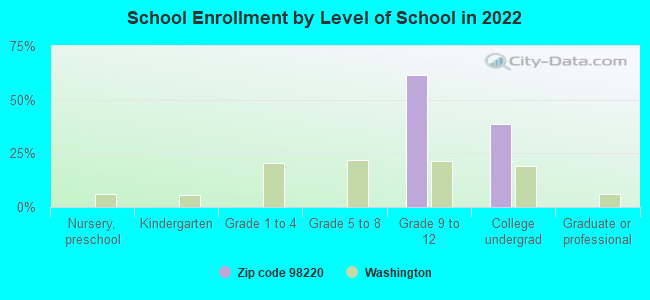
Students in private schools in grades 9 to 12 (high school):
Here:
0.0%
Washington:
9.2%
Students in private undergraduate colleges:
Here:
0.0%
Washington:
16.5%
Companies with federal contracts located in this zip code:
ALERT TECHNOLOGY GROUP INC (4620 TURKINGTON RD in ACME, WA)
$60,000 with Forest Service (disused code: now 12C2) for Data Collection Services. Taking place in DC. Signed on 2002-04-15. Completion date: 2002-05-15.
LARSON, DANIEL (5252 TURKINGTON RD in ACME, WA; small business) : $4,145 in 2 contractsfrom 2003 to 2004
$6,528 with Geological Survey for Natural Resource Studies. Signed on 2003-07-15. Completion date: 2003-09-15.
-$2,383, same as above.Signed on 2004-01-02. Effective on 2003-12-15. Completion date: 2003-09-30.
Top industries in this zip code by the number of employees in 2005:
Construction: Land Subdivision (20-49 employees: 1 establishment)
Accommodation and Food Services: Full-Service Restaurants (10-19: 1)
Construction: New Single-Family Housing Construction (except Operative Builders) (5-9: 1)
Professional, Scientific, and Technical Services: Engineering Services (5-9: 1)
Accommodation and Food Services: Drinking Places (Alcoholic Beverages) (1-4: 1)
Construction: Other Heavy and Civil Engineering Construction (1-4: 1)
Home Mortgage Disclosure Act Aggregated Statistics For Year 2009 (Based on 2 partial tracts)
A) FHA, FSA/RHS & VA Home Purchase Loans
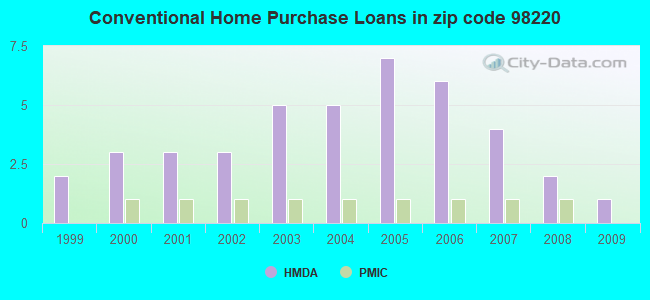
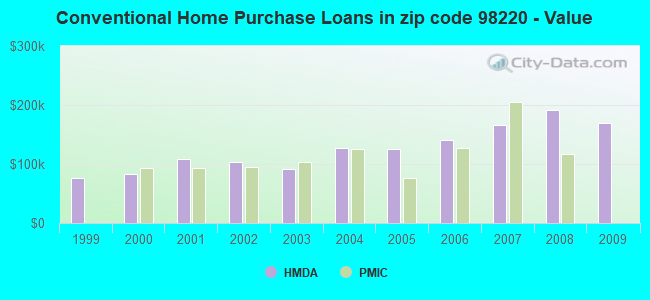
B) Conventional Home Purchase Loans
C) Refinancings
F) Non-occupant Loans on < 5 Family Dwellings (A B C & D)
G) Loans On Manufactured Home Dwelling (A B C & D)
Number
Average Value
Number
Average Value
Number
Average Value
Number
Average Value
Number
Average Value
LOANS ORIGINATED
1
$173,060
1
$168,940
7
$195,763
2
$126,325
1
$168,030
APPLICATIONS APPROVED, NOT ACCEPTED
0
$0
0
$0
1
$176,720
0
$0
0
$0
APPLICATIONS DENIED
0
$0
0
$0
3
$160,160
0
$0
1
$90,810
APPLICATIONS WITHDRAWN
0
$0
0
$0
2
$187,485
0
$0
0
$0
FILES CLOSED FOR INCOMPLETENESS
0
$0
0
$0
0
$0
0
$0
0
$0
Aggregated Statistics For Year 2008 (Based on 2 partial tracts)
A) FHA, FSA/RHS & VA Home Purchase Loans
B) Conventional Home Purchase Loans
C) Refinancings
D) Home Improvement Loans
F) Non-occupant Loans on < 5 Family Dwellings (A B C & D)
G) Loans On Manufactured Home Dwelling (A B C & D)
Number
Average Value
Number
Average Value
Number
Average Value
Number
Average Value
Number
Average Value
Number
Average Value
LOANS ORIGINATED
1
$116,830
2
$191,305
5
$186,164
1
$54,710
2
$151,750
1
$210,640
APPLICATIONS APPROVED, NOT ACCEPTED
0
$0
0
$0
1
$117,770
0
$0
0
$0
0
$0
APPLICATIONS DENIED
0
$0
1
$81,770
3
$162,170
1
$112,770
0
$0
1
$121,210
APPLICATIONS WITHDRAWN
0
$0
0
$0
2
$168,295
0
$0
0
$0
0
$0
FILES CLOSED FOR INCOMPLETENESS
0
$0
0
$0
0
$0
0
$0
0
$0
0
$0
Aggregated Statistics For Year 2007 (Based on 2 partial tracts)
A) FHA, FSA/RHS & VA Home Purchase Loans
B) Conventional Home Purchase Loans
C) Refinancings
D) Home Improvement Loans
F) Non-occupant Loans on < 5 Family Dwellings (A B C & D)
G) Loans On Manufactured Home Dwelling (A B C & D)
Number
Average Value
Number
Average Value
Number
Average Value
Number
Average Value
Number
Average Value
Number
Average Value
LOANS ORIGINATED
1
$91,030
4
$166,930
5
$173,990
1
$143,800
2
$169,610
2
$110,925
APPLICATIONS APPROVED, NOT ACCEPTED
0
$0
1
$111,800
1
$136,820
0
$0
0
$0
0
$0
APPLICATIONS DENIED
0
$0
1
$202,920
3
$162,610
1
$143,800
1
$90,920
1
$99,670
APPLICATIONS WITHDRAWN
0
$0
0
$0
1
$219,250
0
$0
0
$0
1
$55,370
FILES CLOSED FOR INCOMPLETENESS
0
$0
0
$0
0
$0
0
$0
0
$0
0
$0
Aggregated Statistics For Year 2006 (Based on 2 partial tracts)
A) FHA, FSA/RHS & VA Home Purchase Loans
B) Conventional Home Purchase Loans
C) Refinancings
D) Home Improvement Loans
F) Non-occupant Loans on < 5 Family Dwellings (A B C & D)
G) Loans On Manufactured Home Dwelling (A B C & D)
Number
Average Value
Number
Average Value
Number
Average Value
Number
Average Value
Number
Average Value
Number
Average Value
LOANS ORIGINATED
1
$91,610
6
$139,907
6
$154,345
1
$87,860
3
$130,913
2
$113,630
APPLICATIONS APPROVED, NOT ACCEPTED
0
$0
1
$135,080
1
$135,130
0
$0
0
$0
0
$0
APPLICATIONS DENIED
0
$0
2
$124,365
4
$107,608
1
$89,490
1
$71,790
1
$116,030
APPLICATIONS WITHDRAWN
0
$0
1
$103,900
2
$158,260
0
$0
0
$0
0
$0
FILES CLOSED FOR INCOMPLETENESS
0
$0
0
$0
1
$93,520
0
$0
0
$0
0
$0
Aggregated Statistics For Year 2005 (Based on 2 partial tracts)
A) FHA, FSA/RHS & VA Home Purchase Loans
B) Conventional Home Purchase Loans
C) Refinancings
D) Home Improvement Loans
F) Non-occupant Loans on < 5 Family Dwellings (A B C & D)
G) Loans On Manufactured Home Dwelling (A B C & D)
Number
Average Value
Number
Average Value
Number
Average Value
Number
Average Value
Number
Average Value
Number
Average Value
LOANS ORIGINATED
1
$76,220
7
$125,767
6
$148,915
1
$78,390
3
$105,497
2
$113,655
APPLICATIONS APPROVED, NOT ACCEPTED
0
$0
1
$128,390
1
$140,510
0
$0
0
$0
0
$0
APPLICATIONS DENIED
0
$0
1
$169,680
5
$130,462
1
$36,890
0
$0
1
$128,840
APPLICATIONS WITHDRAWN
0
$0
1
$78,790
3
$154,680
0
$0
0
$0
1
$72,420
FILES CLOSED FOR INCOMPLETENESS
0
$0
0
$0
1
$113,660
0
$0
0
$0
0
$0
Aggregated Statistics For Year 2004 (Based on 2 partial tracts)
A) FHA, FSA/RHS & VA Home Purchase Loans
B) Conventional Home Purchase Loans
C) Refinancings
D) Home Improvement Loans
F) Non-occupant Loans on < 5 Family Dwellings (A B C & D)
G) Loans On Manufactured Home Dwelling (A B C & D)
Number
Average Value
Number
Average Value
Number
Average Value
Number
Average Value
Number
Average Value
Number
Average Value
LOANS ORIGINATED
1
$82,800
5
$127,956
5
$111,202
1
$31,550
2
$90,235
2
$83,040
APPLICATIONS APPROVED, NOT ACCEPTED
0
$0
1
$97,330
1
$148,690
0
$0
0
$0
1
$38,350
APPLICATIONS DENIED
0
$0
1
$153,500
5
$109,910
1
$37,550
1
$64,010
1
$101,530
APPLICATIONS WITHDRAWN
0
$0
1
$105,110
3
$114,667
0
$0
0
$0
1
$53,280
FILES CLOSED FOR INCOMPLETENESS
0
$0
0
$0
1
$121,690
0
$0
0
$0
0
$0
Aggregated Statistics For Year 2003 (Based on 2 partial tracts)
A) FHA, FSA/RHS & VA Home Purchase Loans
B) Conventional Home Purchase Loans
C) Refinancings
F) Non-occupant Loans on < 5 Family Dwellings (A B C & D)
Number
Average Value
Number
Average Value
Number
Average Value
Number
Average Value
LOANS ORIGINATED
1
$86,720
5
$91,034
10
$119,923
2
$106,705
APPLICATIONS APPROVED, NOT ACCEPTED
0
$0
1
$73,760
1
$122,580
0
$0
APPLICATIONS DENIED
0
$0
1
$138,000
4
$115,465
1
$73,640
APPLICATIONS WITHDRAWN
0
$0
1
$91,720
2
$123,740
0
$0
FILES CLOSED FOR INCOMPLETENESS
0
$0
0
$0
0
$0
0
$0
Aggregated Statistics For Year 2002 (Based on 2 partial tracts)
A) FHA, FSA/RHS & VA Home Purchase Loans
B) Conventional Home Purchase Loans
C) Refinancings
F) Non-occupant Loans on < 5 Family Dwellings (A B C & D)
Number
Average Value
Number
Average Value
Number
Average Value
Number
Average Value
LOANS ORIGINATED
1
$54,250
3
$102,750
7
$106,180
1
$100,270
APPLICATIONS APPROVED, NOT ACCEPTED
0
$0
1
$48,080
1
$119,180
0
$0
APPLICATIONS DENIED
0
$0
1
$114,260
4
$97,062
0
$0
APPLICATIONS WITHDRAWN
0
$0
0
$0
2
$143,015
0
$0
FILES CLOSED FOR INCOMPLETENESS
0
$0
0
$0
0
$0
0
$0
Aggregated Statistics For Year 2001 (Based on 2 partial tracts)
A) FHA, FSA/RHS & VA Home Purchase Loans
B) Conventional Home Purchase Loans
C) Refinancings
D) Home Improvement Loans
F) Non-occupant Loans on < 5 Family Dwellings (A B C & D)
Number
Average Value
Number
Average Value
Number
Average Value
Number
Average Value
Number
Average Value
LOANS ORIGINATED
1
$92,660
3
$108,937
6
$98,880
0
$0
1
$107,160
APPLICATIONS APPROVED, NOT ACCEPTED
0
$0
1
$43,390
1
$92,260
0
$0
0
$0
APPLICATIONS DENIED
0
$0
1
$66,550
3
$96,507
1
$8,470
0
$0
APPLICATIONS WITHDRAWN
0
$0
1
$53,680
2
$115,730
0
$0
0
$0
FILES CLOSED FOR INCOMPLETENESS
0
$0
0
$0
1
$67,870
0
$0
0
$0
Aggregated Statistics For Year 2000 (Based on 2 partial tracts)
B) Conventional Home Purchase Loans
C) Refinancings
D) Home Improvement Loans
F) Non-occupant Loans on < 5 Family Dwellings (A B C & D)
Number
Average Value
Number
Average Value
Number
Average Value
Number
Average Value
LOANS ORIGINATED
3
$83,320
2
$112,240
1
$11,180
1
$62,630
APPLICATIONS APPROVED, NOT ACCEPTED
1
$43,190
1
$53,170
0
$0
0
$0
APPLICATIONS DENIED
1
$110,310
3
$91,043
1
$10,810
0
$0
APPLICATIONS WITHDRAWN
1
$45,050
1
$82,140
0
$0
0
$0
FILES CLOSED FOR INCOMPLETENESS
0
$0
1
$60,750
0
$0
0
$0
Aggregated Statistics For Year 1999 (Based on 1 partial tract)


 Nearest zip codes: 98284, 98263, 98229, 98235, 98233, 98232.