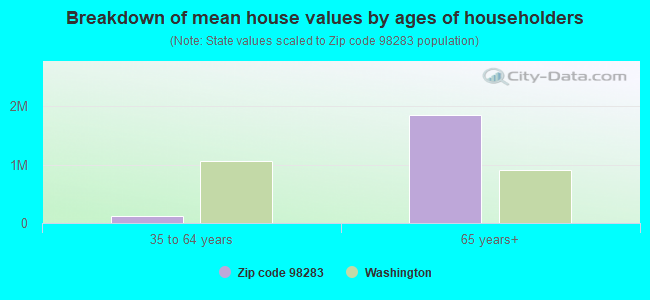
Estimated median house/condo value in 2022: $311,577
98283:
$311,577
Washington:
$569,500
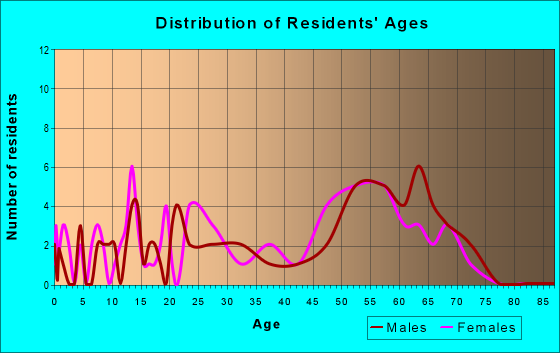
Median resident age:
This zip code:
41.4 years
Washington median age:
38.4 years
Average household size:
This zip code:
2.9 people
Washington:
2.5 people
Averages for the 2020 tax year for zip code 98283, filed in 2021:
Average Adjusted Gross Income (AGI) in 2020: $65,368 (Individual Income Tax Returns)
Here:
$65,368
State:
$99,264
Salary/wage: $54,306 (reported on 84.2% of returns)
Here:
$54,306
State:
$80,347
(% of AGI for various income ranges: 1836.7% for AGIs below $25k, 3490.0% for AGIs $25k-50k, 5390.0% for AGIs $50k-75k, 24675.0% for AGIs $100k-200k)
Taxable interest for individuals: $400 (reported on 31.6% of returns)
This zip code:
$400
Washington:
$2,077
(% of AGI for various income ranges: 30.0% for AGIs $25k-50k, 75.0% for AGIs $100k-200k)
Ordinary dividends: $1,200 (reported on 10.5% of returns)
Here:
$1,200
State:
$10,013
(% of AGI for various income ranges: 80.0% for AGIs below $25k)
Net capital gain/loss in AGI: +$4,567 (reported on 15.8% of returns)
Here:
+$4,567
State:
+$40,092
(% of AGI for various income ranges: 456.7% for AGIs $25k-50k)
Earned income credit: $2,450 (reported on 10.5% of returns)
Here:
$2,450
State:
$2,020
(% of AGI for various income ranges: 163.3% for AGIs below $25k)
Percentage of individuals using paid preparers for their 2020 taxes: 89.5%
Here:
89%
State:
93%
(% for various income ranges: 83.3% for AGIs below $25k, 100.0% for AGIs $25k-50k, 80.0% for AGIs $50k-75k, 100.0% for AGIs $100k-200k)
Averages for the 2012 tax year for zip code 98283, filed in 2013:
Average Adjusted Gross Income (AGI) in 2012: $45,600 (Individual Income Tax Returns)
Here:
$45,600
State:
$69,533
Salary/wage: $37,907 (reported on 88.2% of returns)
Here:
$37,907
State:
$57,267
(% of AGI for various income ranges: 54.6% for AGIs below $25k, 78.2% for AGIs $25k-50k, 84.5% for AGIs $50k-75k, 70.2% for AGIs $75k-100k)
Taxable interest for individuals: $100 (reported on 29.4% of returns)
This zip code:
$100
Washington:
$1,816
Profit/loss from business: +$4,400 (reported on 11.8% of returns)
Here:
+$4,400
State:
+$16,521
Total itemized deductions: $15,240 (23% of AGI, reported on 29.4% of returns)
Here:
$15,240
State:
$23,872
Here:
22.9% of AGI
State:
18.2% of AGI
Charity contributions: $1,550 (reported on 11.8% of returns)
Here:
$1,550
State:
$4,465
Taxes paid: $3,750 (reported on 23.5% of returns)
98283:
$3,750
State:
$6,400
Earned income credit: $2,000 (reported on 17.6% of returns)
Here:
$2,000
State:
$2,073
(% of AGI for various income ranges: 7.3% for AGIs below $25k)
Percentage of individuals using paid preparers for their 2012 taxes: 35.3%
Here:
35%
State:
43%
Averages for the 2004 tax year for zip code 98283, filed in 2005:
Average Adjusted Gross Income (AGI) in 2004: $34,847 (Individual Income Tax Returns)
Here:
$34,847
State:
$54,331
Salary/wage: $32,065 (reported on 86.0% of returns)
Here:
$32,065
State:
$45,761
(% of AGI for various income ranges: 83.9% for AGIs below $10k, 70.5% for AGIs $10k-25k, 86.6% for AGIs $25k-50k, 79.1% for AGIs $50k-75k, 73.0% for AGIs $75k-100k)
Taxable interest for individuals: $651 (reported on 38.6% of returns)
This zip code:
$651
Washington:
$2,110
(% of AGI for various income ranges: 1.3% for AGIs $10k-25k, 1.0% for AGIs $25k-50k, 0.2% for AGIs $50k-75k, 0.8% for AGIs $75k-100k)
Taxable dividends: $840 (reported on 11.6% of returns)
Here:
$840
State:
$5,879
Profit/loss from business: +$1,000 (reported on 6.0% of returns)
Here:
+$1,000
State:
+$13,994
Total itemized deductions: $13,268 (23% of AGI, reported on 19.1% of returns)
Here:
$13,268
State:
$19,669
Here:
23.1% of AGI
State:
20.7% of AGI
Charity contributions deductions: $720 (1% of AGI, reported on 11.6% of returns)
Here:
$720
State:
$3,569
Here:
1.2% of AGI
State:
3.5% of AGI
Total tax: $4,342 (reported on 70.7% of returns)
98283:
$4,342
State:
$9,065
(% of AGI for various income ranges: 4.8% for AGIs $10k-25k, 7.5% for AGIs $25k-50k, 9.8% for AGIs $50k-75k, 12.6% for AGIs $75k-100k)
Earned income credit: $1,737 (reported on 17.7% of returns)
Here:
$1,737
State:
$1,607
Percentage of individuals using paid preparers for their 2004 taxes: 47.9%
Here:
48%
State:
49%
(% for various income ranges: 40.0% for AGIs below $10k, 56.9% for AGIs $10k-25k, 46.0% for AGIs $25k-50k, 43.2% for AGIs $50k-75k, 57.9% for AGIs $75k-100k)
Household received Food Stamps/SNAP in the past 12 months: 56 Household did not receive Food Stamps/SNAP in the past 12 months: 95
Women who had a birth in the past 12 months: 9 (10 now married, 0 unmarried) Women who did not have a birth in the past 12 months: 75 (60 now married, 14 unmarried)
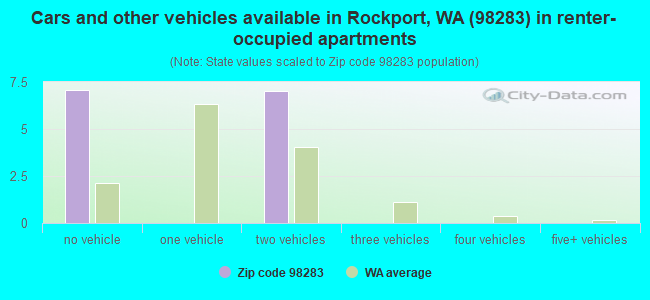
Housing units in zip code 98283 with a mortgage: 68 (14 second mortgage, 14 both second mortgage and home equity loan) Median monthly owner costs for units with a mortgage: $1,146 Median monthly owner costs for units without a mortgage: $758
Residents with income below the poverty level in 2022:
This zip code:
11.4%
Whole state:
10.0%
Residents with income below 50% of the poverty level in 2022:
This zip code:
7.8%
Whole state:
4.6%
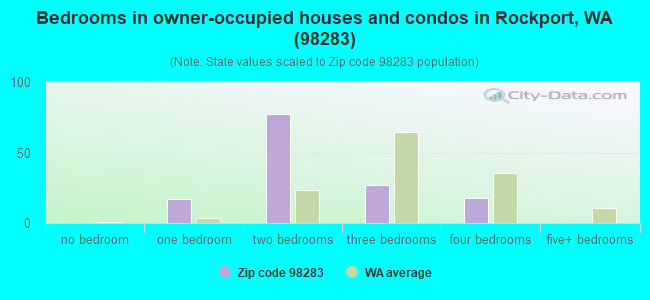
Median number of rooms in houses and condos:
Here:
4.2
State:
6.5
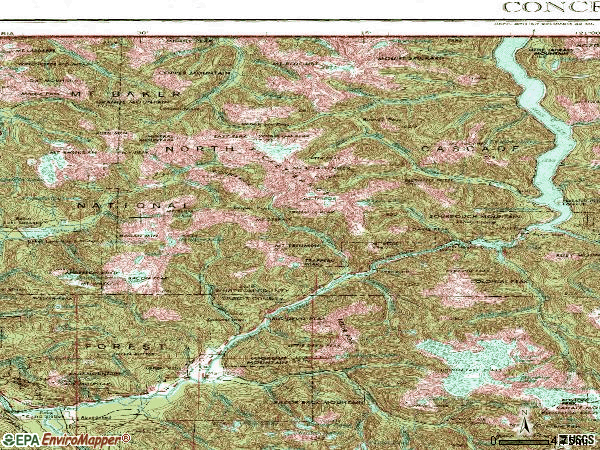
Notable locations in this zip code not listed on our city pages
Notable locations in zip code 98283: Perry Creek Shelter (A), Tapto Camp (B), Diable Vista (C), Desolation Peak Lookout Station (D), Colonial Creek Campground (E), Cat Island Campground (F), Gorge Powerhouse (G), Bear Creek Shelter (H), Newhalem Creek Powerhouse (I), Gorge Creek Falls Viewpoint (J), Group Campground (K), Tenmile Shelter (L), Tenmile Island Campground (M), Cougar Island Campground (N), Nightmare Camp (O), Big Bear Campground (P), Goodell Campground (Q), Goodell Siding (R), Beaver Pass Shelter (S), Ross Lake Guards Station (T). Display/hide their locations on the map
Lakes and reservoirs: Green Lake (A), Noname Lake (B), Middle Lakes (C), Sourdough Lake (D), Berdeen Lake (E), Bear Lake (F), Willow Lake (G), Luna Lake (H). Display/hide their locations on the map
Rivers and creeks: Baker River (A), Bald Eagle Creek (B), Bear Creek (C), Big Beaver Creek (D), Brush Creek (E), Bucket Creek (F), Camp Dayo Creek (G), Colonial Creek (H), Crescent Creek (I). Display/hide their locations on the map
In group quarters: 33 (-1 institutionalized population)
Size of family households: 11 2-persons, 75 3-persons, 6 4-persons, 28 5-persons
Size of nonfamily households: 27 1-person
121 married couples with children.
13 single-parent households (13 women).
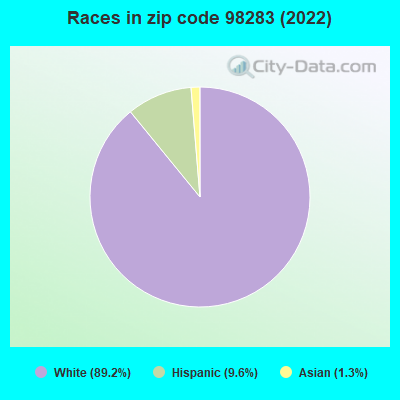
90.7% of residents of 98283 zip code speak English at home.
8.9% of residents speak Spanish at home (100% not at all).
1.4% of residents speak Asian or Pacific Island language at home (100% very well).
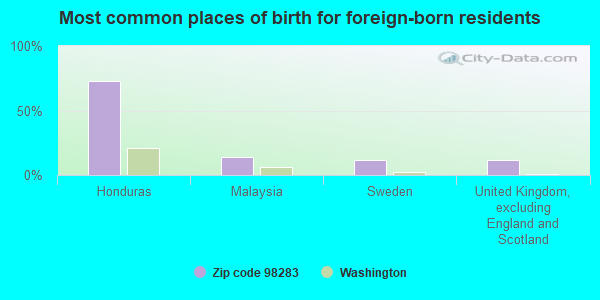
Foreign born population: 44 (9.4%) (14.2% of them are naturalized citizens)
This zip code:
9.4%
Whole state:
15.3%
73%Honduras
14%Malaysia
11%Sweden
11%United Kingdom, excluding England and Scotland
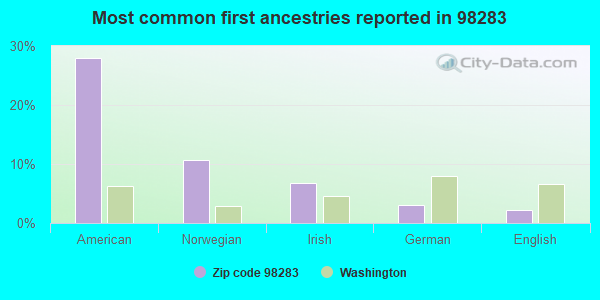
28%American
11%Norwegian
7%Irish
3%German
2%English
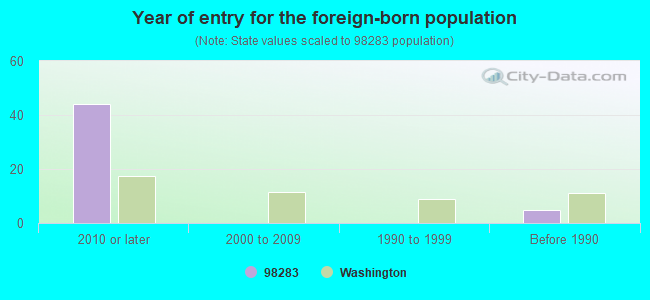
Year of entry for the foreign-born population
442010 or later
02000 to 2009
01990 to 1999
5Before 1990
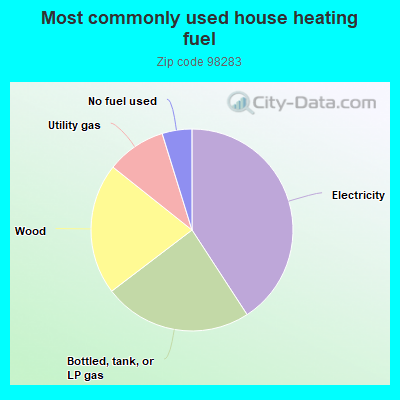
41.1%Electricity
24.0%Bottled, tank, or LP gas
21.2%Wood
9.6%Utility gas
4.8%No fuel used
Population in 1990: 157. Population change in the 1990s: +221 (+140.8%).
Place of birth for U.S.-born residents:
This state: 224
Northeast: 44
West: 158
43% of the 98283 zip code residents lived in the same house 5 years ago. Out of people who lived in different houses, 67% lived in this county. Out of people who lived in different counties, 50% lived in Washington.
87% of the 98283 zip code residents lived in the same house 1 year ago. Out of people who lived in different houses, 22% moved from different county within same state. Out of people who lived in different houses, 84% moved from different state.
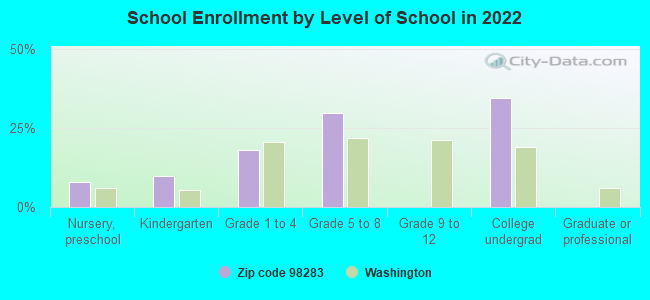
Private vs. public school enrollment:
Students in private schools in grades 1 to 8 (elementary and middle school):
Here:
0.0%
Washington:
12.4%
Students in private undergraduate colleges:
Here:
0.0%
Washington:
16.5%
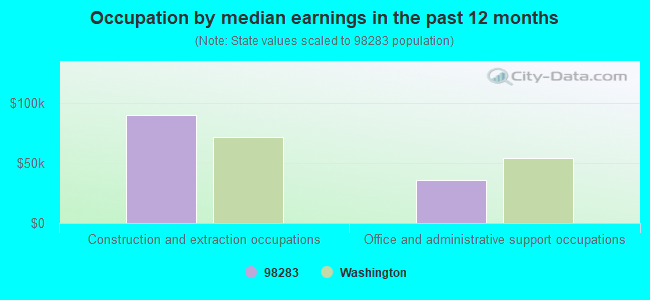
Occupation by median earnings in the past 12 months ($)
90,062Construction and extraction occupations
35,682Office and administrative support occupations
Top industries in this zip code by the number of employees in 2005:
Accommodation and Food Services: Hotels (except Casino Hotels) and Motels (10-19 employees: 1 establishment, 1-4 employees: 1 establishment)
Accommodation and Food Services: Drinking Places (Alcoholic Beverages) (1-4: 2)
Accommodation and Food Services: Full-Service Restaurants (1-4: 2)
Construction: Site Preparation Contractors (1-4: 2)
Construction: Highway, Street, and Bridge Construction (1-4: 1)
Wholesale Trade: Brick, Stone, and Related Construction Material Merchant Wholesalers (1-4: 1)
Administrative and Support and Waste Management and Remediation Services: Convention and Visitors Bureaus (1-4: 1)
People in group quarters in 2010:
10 people in workers' group living quarters and job corps centers
People in group quarters in 2000:
3 people in job corps and vocational training facilities
Fatal accident statistics in 2012:
Fatal accident count: 1
Vehicles involved in fatal accidents: 1
Fatal accidents caused by drunken drivers: 0
Fatalities: 1
Persons involved in fatal accidents: 1
Pedestrians involved in fatal accidents: 0
Home Mortgage Disclosure Act Aggregated Statistics For Year 2009 (Based on 6 partial tracts)
A) FHA, FSA/RHS & VA Home Purchase Loans
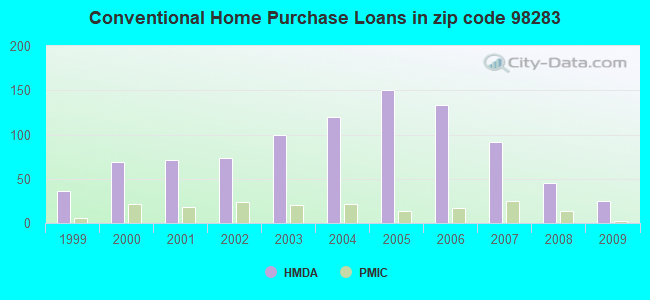
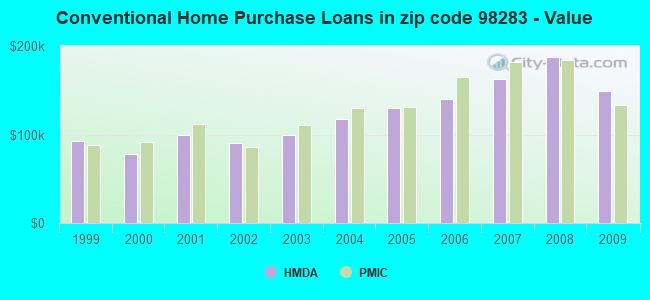
B) Conventional Home Purchase Loans
C) Refinancings
D) Home Improvement Loans
F) Non-occupant Loans on < 5 Family Dwellings (A B C & D)
G) Loans On Manufactured Home Dwelling (A B C & D)
Number
Average Value
Number
Average Value
Number
Average Value
Number
Average Value
Number
Average Value
Number
Average Value
LOANS ORIGINATED
24
$157,998
25
$149,677
164
$184,279
9
$128,561
34
$162,039
31
$122,372
APPLICATIONS APPROVED, NOT ACCEPTED
2
$126,385
4
$200,662
19
$202,764
2
$76,080
4
$147,512
3
$168,740
APPLICATIONS DENIED
7
$163,970
7
$134,740
63
$170,334
6
$194,608
7
$132,321
17
$120,694
APPLICATIONS WITHDRAWN
3
$156,680
4
$239,248
41
$201,443
2
$91,125
4
$199,440
5
$116,908
FILES CLOSED FOR INCOMPLETENESS
1
$76,380
1
$38,190
4
$194,312
2
$216,830
2
$214,675
1
$231,150
Aggregated Statistics For Year 2008 (Based on 6 partial tracts)
A) FHA, FSA/RHS & VA Home Purchase Loans
B) Conventional Home Purchase Loans
C) Refinancings
D) Home Improvement Loans
F) Non-occupant Loans on < 5 Family Dwellings (A B C & D)
G) Loans On Manufactured Home Dwelling (A B C & D)
Number
Average Value
Number
Average Value
Number
Average Value
Number
Average Value
Number
Average Value
Number
Average Value
LOANS ORIGINATED
14
$186,932
45
$188,024
108
$190,324
11
$109,883
36
$184,303
32
$148,925
APPLICATIONS APPROVED, NOT ACCEPTED
1
$159,060
9
$151,309
17
$153,147
1
$268,430
7
$208,184
4
$103,242
APPLICATIONS DENIED
4
$234,742
12
$149,995
63
$173,326
19
$131,265
11
$155,745
20
$136,323
APPLICATIONS WITHDRAWN
3
$98,280
5
$281,902
43
$171,835
3
$70,337
9
$234,254
10
$146,612
FILES CLOSED FOR INCOMPLETENESS
1
$96,100
2
$194,210
5
$221,070
1
$91,650
1
$80,080
3
$104,703
Aggregated Statistics For Year 2007 (Based on 6 partial tracts)
A) FHA, FSA/RHS & VA Home Purchase Loans
B) Conventional Home Purchase Loans
C) Refinancings
D) Home Improvement Loans
F) Non-occupant Loans on < 5 Family Dwellings (A B C & D)
G) Loans On Manufactured Home Dwelling (A B C & D)
Number
Average Value
Number
Average Value
Number
Average Value
Number
Average Value
Number
Average Value
Number
Average Value
LOANS ORIGINATED
17
$123,088
91
$162,802
118
$163,664
33
$94,747
49
$153,395
45
$111,500
APPLICATIONS APPROVED, NOT ACCEPTED
1
$194,360
16
$153,831
20
$153,264
6
$82,013
6
$136,647
6
$121,167
APPLICATIONS DENIED
4
$107,218
26
$173,332
71
$157,498
25
$126,716
13
$154,608
19
$120,715
APPLICATIONS WITHDRAWN
1
$143,030
7
$194,516
33
$148,267
4
$126,245
4
$135,950
12
$103,381
FILES CLOSED FOR INCOMPLETENESS
0
$0
1
$155,230
7
$172,127
1
$210,060
1
$97,940
1
$149,110
Aggregated Statistics For Year 2006 (Based on 6 partial tracts)
A) FHA, FSA/RHS & VA Home Purchase Loans
B) Conventional Home Purchase Loans
C) Refinancings
D) Home Improvement Loans
F) Non-occupant Loans on < 5 Family Dwellings (A B C & D)
G) Loans On Manufactured Home Dwelling (A B C & D)
Number
Average Value
Number
Average Value
Number
Average Value
Number
Average Value
Number
Average Value
Number
Average Value
LOANS ORIGINATED
16
$131,888
133
$139,859
140
$146,298
28
$70,365
59
$146,359
39
$132,631
APPLICATIONS APPROVED, NOT ACCEPTED
3
$118,630
26
$113,728
23
$131,636
1
$37,260
7
$94,553
9
$147,729
APPLICATIONS DENIED
2
$131,910
40
$140,938
80
$122,560
23
$86,973
13
$122,278
27
$96,550
APPLICATIONS WITHDRAWN
2
$154,130
13
$176,732
51
$139,325
5
$67,258
7
$114,639
7
$137,264
FILES CLOSED FOR INCOMPLETENESS
0
$0
2
$98,565
14
$151,474
2
$32,030
1
$25,260
1
$57,790
Aggregated Statistics For Year 2005 (Based on 6 partial tracts)
A) FHA, FSA/RHS & VA Home Purchase Loans
B) Conventional Home Purchase Loans
C) Refinancings
D) Home Improvement Loans
F) Non-occupant Loans on < 5 Family Dwellings (A B C & D)
G) Loans On Manufactured Home Dwelling (A B C & D)
Number
Average Value
Number
Average Value
Number
Average Value
Number
Average Value
Number
Average Value
Number
Average Value
LOANS ORIGINATED
14
$125,092
150
$129,693
143
$138,381
22
$78,230
58
$119,904
45
$114,396
APPLICATIONS APPROVED, NOT ACCEPTED
2
$115,770
32
$88,723
27
$114,454
4
$37,625
3
$84,207
11
$105,418
APPLICATIONS DENIED
3
$90,523
32
$119,367
110
$133,172
16
$51,312
11
$127,079
29
$100,401
APPLICATIONS WITHDRAWN
3
$149,303
17
$105,701
75
$138,887
10
$114,619
5
$125,690
16
$102,744
FILES CLOSED FOR INCOMPLETENESS
1
$56,060
3
$106,510
18
$139,724
1
$65,910
2
$170,015
4
$122,960
Aggregated Statistics For Year 2004 (Based on 6 partial tracts)
A) FHA, FSA/RHS & VA Home Purchase Loans
B) Conventional Home Purchase Loans
C) Refinancings
D) Home Improvement Loans
F) Non-occupant Loans on < 5 Family Dwellings (A B C & D)
G) Loans On Manufactured Home Dwelling (A B C & D)
Number
Average Value
Number
Average Value
Number
Average Value
Number
Average Value
Number
Average Value
Number
Average Value
LOANS ORIGINATED
18
$103,438
120
$117,353
109
$113,469
16
$43,916
41
$96,481
39
$95,565
APPLICATIONS APPROVED, NOT ACCEPTED
1
$135,520
22
$98,505
27
$122,476
4
$27,870
4
$75,778
12
$70,908
APPLICATIONS DENIED
4
$136,712
33
$104,816
108
$114,949
15
$55,876
14
$100,168
28
$83,292
APPLICATIONS WITHDRAWN
1
$112,560
16
$146,636
61
$125,702
3
$24,053
4
$148,480
12
$102,013
FILES CLOSED FOR INCOMPLETENESS
0
$0
5
$114,134
24
$112,544
0
$0
1
$51,010
4
$103,808
Aggregated Statistics For Year 2003 (Based on 2 partial tracts)
A) FHA, FSA/RHS & VA Home Purchase Loans
B) Conventional Home Purchase Loans
C) Refinancings
D) Home Improvement Loans
F) Non-occupant Loans on < 5 Family Dwellings (A B C & D)
Number
Average Value
Number
Average Value
Number
Average Value
Number
Average Value
Number
Average Value
LOANS ORIGINATED
17
$109,865
99
$99,027
219
$117,943
5
$28,212
54
$85,122
APPLICATIONS APPROVED, NOT ACCEPTED
0
$0
13
$122,205
22
$120,008
2
$73,305
5
$73,674
APPLICATIONS DENIED
2
$72,380
31
$95,877
84
$118,426
6
$18,377
14
$113,300
APPLICATIONS WITHDRAWN
2
$113,650
16
$123,469
45
$118,450
1
$28,950
3
$122,380
FILES CLOSED FOR INCOMPLETENESS
0
$0
3
$109,237
8
$136,444
0
$0
2
$126,590
Aggregated Statistics For Year 2002 (Based on 2 partial tracts)
A) FHA, FSA/RHS & VA Home Purchase Loans
B) Conventional Home Purchase Loans
C) Refinancings
D) Home Improvement Loans
F) Non-occupant Loans on < 5 Family Dwellings (A B C & D)
Number
Average Value
Number
Average Value
Number
Average Value
Number
Average Value
Number
Average Value
LOANS ORIGINATED
11
$106,232
73
$90,949
145
$110,404
10
$23,470
27
$79,989
APPLICATIONS APPROVED, NOT ACCEPTED
1
$77,000
12
$86,292
22
$116,676
0
$0
6
$77,205
APPLICATIONS DENIED
1
$69,610
24
$102,538
84
$99,550
4
$66,682
4
$108,262
APPLICATIONS WITHDRAWN
1
$92,400
10
$75,768
50
$123,212
1
$33,880
1
$89,940
FILES CLOSED FOR INCOMPLETENESS
0
$0
2
$94,865
9
$131,824
0
$0
1
$208,820
Aggregated Statistics For Year 2001 (Based on 2 partial tracts)
A) FHA, FSA/RHS & VA Home Purchase Loans
B) Conventional Home Purchase Loans
C) Refinancings
D) Home Improvement Loans
F) Non-occupant Loans on < 5 Family Dwellings (A B C & D)
Number
Average Value
Number
Average Value
Number
Average Value
Number
Average Value
Number
Average Value
LOANS ORIGINATED
19
$105,044
71
$99,141
120
$106,486
7
$22,880
28
$82,434
APPLICATIONS APPROVED, NOT ACCEPTED
2
$113,345
14
$66,748
18
$110,401
3
$17,660
1
$64,680
APPLICATIONS DENIED
3
$124,637
20
$71,672
66
$94,481
12
$15,195
7
$59,489
APPLICATIONS WITHDRAWN
1
$131,210
12
$96,352
50
$99,706
4
$51,898
3
$75,767
FILES CLOSED FOR INCOMPLETENESS
1
$35,110
1
$174,940
14
$104,412
0
$0
1
$35,110
Aggregated Statistics For Year 2000 (Based on 2 partial tracts)
A) FHA, FSA/RHS & VA Home Purchase Loans
B) Conventional Home Purchase Loans
C) Refinancings
D) Home Improvement Loans
F) Non-occupant Loans on < 5 Family Dwellings (A B C & D)
Number
Average Value
Number
Average Value
Number
Average Value
Number
Average Value
Number
Average Value
LOANS ORIGINATED
8
$90,552
69
$78,027
48
$100,729
12
$20,072
18
$74,947
APPLICATIONS APPROVED, NOT ACCEPTED
0
$0
11
$84,560
12
$95,428
2
$41,270
1
$26,490
APPLICATIONS DENIED
5
$85,994
30
$79,197
62
$94,884
12
$19,404
3
$37,370
APPLICATIONS WITHDRAWN
2
$138,910
12
$80,850
23
$76,920
3
$42,913
1
$87,470
FILES CLOSED FOR INCOMPLETENESS
0
$0
2
$58,520
12
$109,032
0
$0
1
$51,130
Aggregated Statistics For Year 1999 (Based on 1 partial tract)
A) FHA, FSA/RHS & VA Home Purchase Loans
B) Conventional Home Purchase Loans
C) Refinancings
D) Home Improvement Loans
F) Non-occupant Loans on < 5 Family Dwellings (A B C & D)
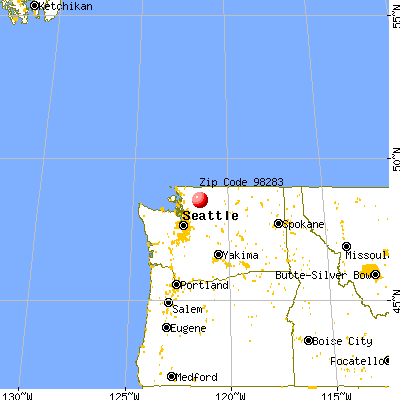


 Nearest zip codes: 98267, 98237, 98241, 98833, 98244, 98255.