Estimated zip code population in 2022: 182 Zip code population in 2010: 333 Zip code population in 2000: 433
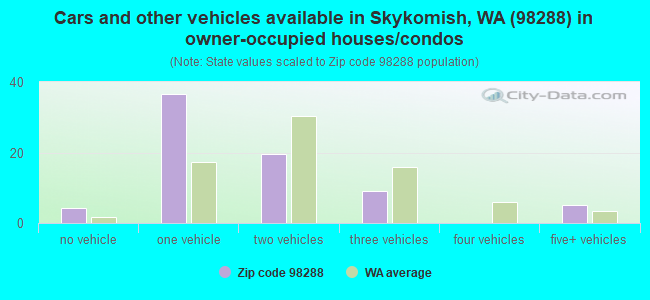
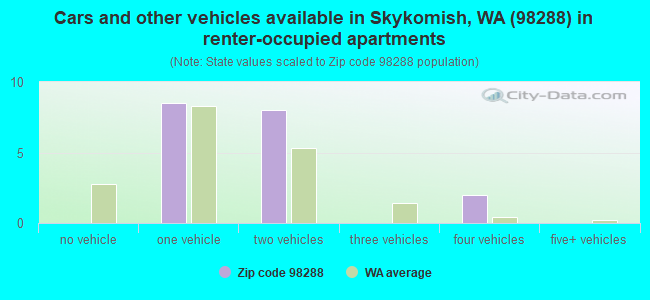
Houses and condos: 350 Renter-occupied apartments: 18
% of renters here:
20%
State:
36%
March 2022 cost of living index in zip code 98288: 99.3 (near average, U.S. average is 100)
Land area: 211.5 sq. mi. Water area: 4.2 sq. mi.
Population density: 0.860 people per square mile
(very low).
OSM Map
General Map
Google Map
MSN Map
OSM Map
General Map
Google Map
MSN Map
OSM Map
General Map
Google Map
MSN Map
OSM Map
General Map
Google Map
MSN Map
Please wait while loading the map...
Real estate property taxes paid for housing units in 2022:
This zip code:
0.5% ($2,060)
Washington:
0.8% ($4,283)
Median real estate property taxes paid for housing units with mortgages in 2022: $2,200 (0.5%) Median real estate property taxes paid for housing units with no mortgage in 2022: $1,804 (0.4%)
Business Search- 14 Million verified businesses
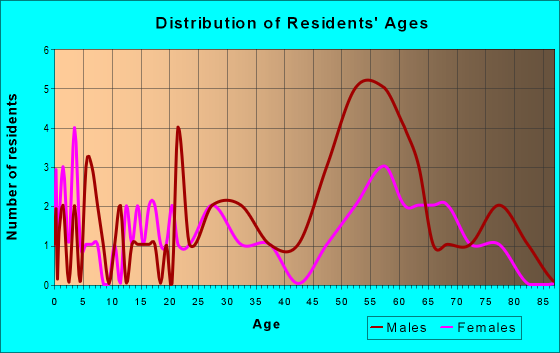
Males: 119
(65.6%)
Females: 62
(34.4%)
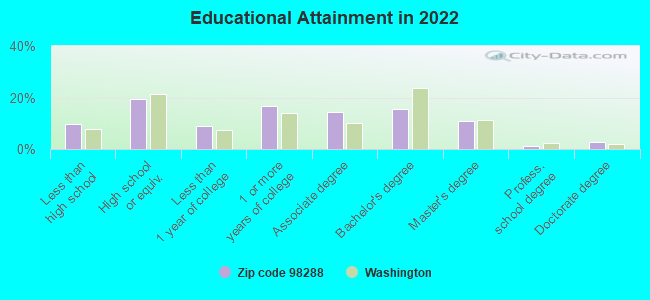
For population 25 years and over in 98288:
High school or higher: 87.7%
Bachelor's degree or higher: 29.6%
Graduate or professional degree: 14.8%
Unemployed: 2.9%
Mean travel time to work (commute): 43.7 minutes
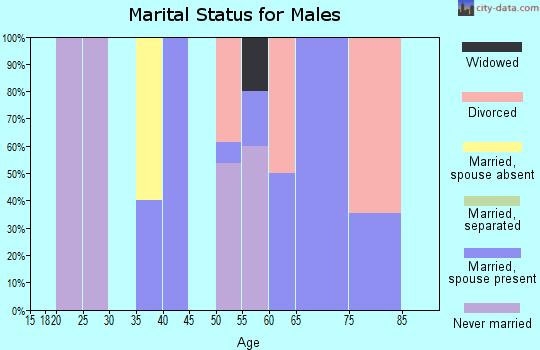
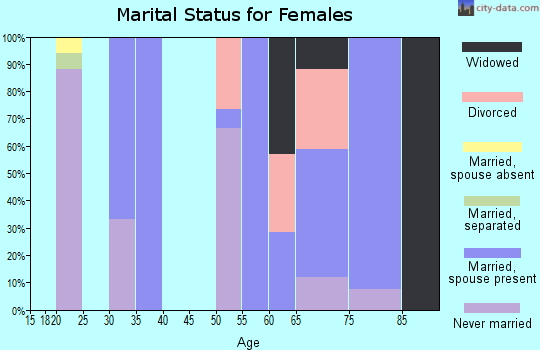
For population 15 years and over in 98288:
Never married: 32.2%
Now married: 35.7%
Separated: 1.8%
Widowed: 10.7%
Divorced: 19.7%
Zip code 98288 compared to state average:
Median household income below state average.
Hispanic race population percentage significantly below state average.
Median age significantly above state average.
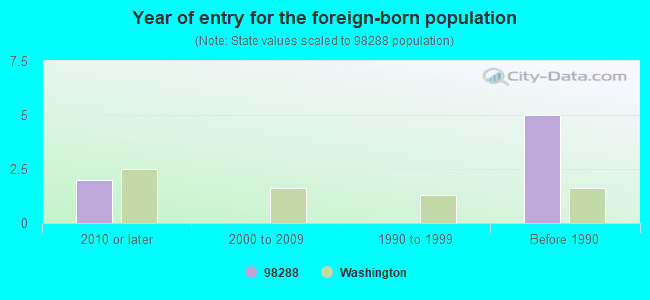
Foreign-born population percentage significantly below state average.
Renting percentage below state average.
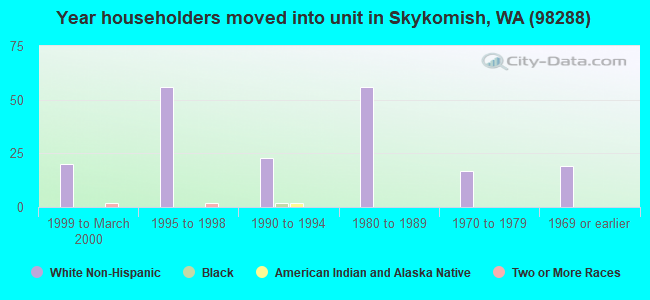
Length of stay since moving in below state average.
Number of rooms per house significantly below state average.
Household received Food Stamps/SNAP in the past 12 months: 5 Household did not receive Food Stamps/SNAP in the past 12 months: 85
Women who did not have a birth in the past 12 months: 22 (10 now married, 12 unmarried)
Housing units in zip code 98288 with a mortgage: 50 (3 second mortgage, 3 both second mortgage and home equity loan) Median monthly owner costs for units with a mortgage: $1,529 Median monthly owner costs for units without a mortgage: $704
Residents with income below the poverty level in 2022:
This zip code:
14.8%
Whole state:
10.0%
Residents with income below 50% of the poverty level in 2022:
This zip code:
8.6%
Whole state:
4.6%
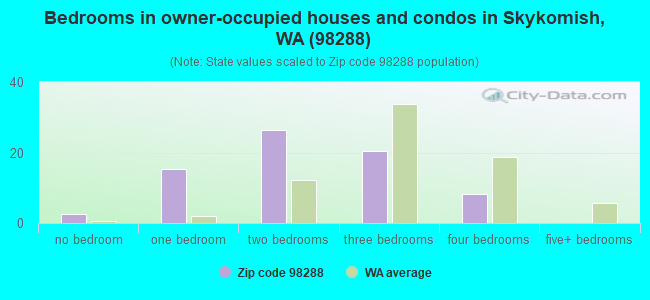
Median number of rooms in houses and condos:
Here:
5.0
State:
6.5
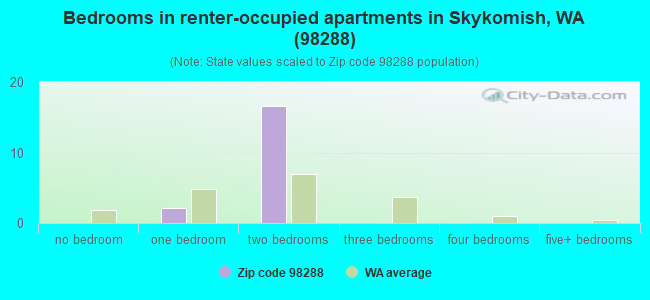
Median number of rooms in apartments:
Here:
4.2
State:
3.9
Notable locations in this zip code not listed on our city pages
Notable locations in zip code 98288: Skykomish District Ranger Office (A), Foss River Camp (B), Foss River Campground (C), Stevens Pass Recreation Area (D), Miller River Campground (E), Tye Canyon Campground (F), Steven Pass Org Site (G), Beckler River Campground (H), West Fork Campground (I), Deception Falls Campground (J), Scenic (K), Deception Creek Campground (L), Deception Falls Picnic Area (M), Money Creek Campground (N), Pacific Crest Trailhead (O), Surprise Mountain Lookout (P), Tye (Q), King County Fire Protection District 50 Station 295 (R). Display/hide their locations on the map
Lakes: Terrace Lakes (A), Cass Pond (B), Tye Lake (C), Trout Lake (D), Cloudy Lake (E), No Name Lake (F), Cleveland Lake (G), Profitts Pond (H). Display/hide their locations on the map
Rivers and creeks: Beckler River (A), Bolt Creek (B), Burn Creek (C), Camp Robber Creek (D), Carroll Creek (E), Coney Creek (F), Deception Creek (G), Eagle Creek (H), Fisher Creek (I). Display/hide their locations on the map
In group quarters: 15 (-1 institutionalized population)
Size of family households: 21 2-persons, 4 3-persons, 11 4-persons
Size of nonfamily households: 48 1-person, 4 2-persons, 1 3-persons
11 married couples with children.
3 single-parent households (3 women).
99.4% of residents of 98288 zip code speak English at home.
0.6% of residents speak Spanish at home (100% not well).
Foreign born population: 4 (2.3%) (0.0% of them are naturalized citizens)
:
2.3%
Whole state:
15.3%
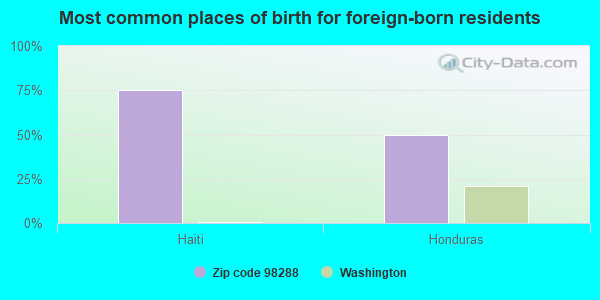
75%Haiti
50%Honduras
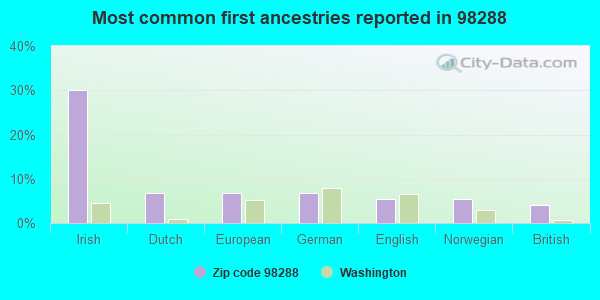
30%Irish
7%Dutch
7%European
7%German
5%English
5%Norwegian
4%British
Year of entry for the foreign-born population
22010 or later
02000 to 2009
01990 to 1999
5Before 1990
Facilities with environmental interests located in this zip code:
BNSF SKYKOMISH REMEDIATION SITE (SOUTH FORK SKYKOMISH RIVER in SKYKOMISH, WA)
National Pollutant Discharge Elimination System NON-MAJOR (Tracking pollutant discharge elimination systems) - permit STATE MASTER (Washington State Department of Ecology's Facility/Site identification system) - WATQUAL-, NPDES NON-MAJOR Business SIC classification: NONCLASSIFIABLE ESTABLISHMENTS Organizations: BNSF RAILWAY COMPANY (CONTACT/OPERATOR)
, BNSF RAILWAY CO. (CONTACT/OWNER)
Alternative names: BNSF RAILWAY COMPANY
BURLINGTON NORTHERN & SANTA FE RR (RAILROAD AVENUE & 5TH STREET in SKYKOMISH, WA)
(Resource Conservation and Recovery Act (tracking hazardous waste)) Business NAICS classification: LINE-HAUL RAILROADS. Organizations: BRUCE SHEPPARD (CONTACT/OPERATOR)
, BURLINGTON NORTHERN & SANTA FE RAILWAY (CONTACT/OWNER)
BURLINGTON NORTH SANTE FE SKYK (SE OF INT OF 5TH ST N + RAILRO in SKYKOMISH, WA)
National Pollutant Discharge Elimination System NON-MAJOR (Tracking pollutant discharge elimination systems) - permit Business SIC classification: DAIRY FARMS Organizations: BURLINGTON NORTHERN SANTE FE R (CONTACT/OWNER)
Alternative names: BURLINGTON NORTHERN SANTE FE R
CASHMAN MILL SITE (OLD CASCADE HWY & LOWE CREEK RD in SKYKOMISH, WA)
SUPERFUND (Superfund database) Alternative names: APEX MILL
Housing units lacking complete plumbing facilities: 20.6% Housing units lacking complete kitchen facilities: 9.8%
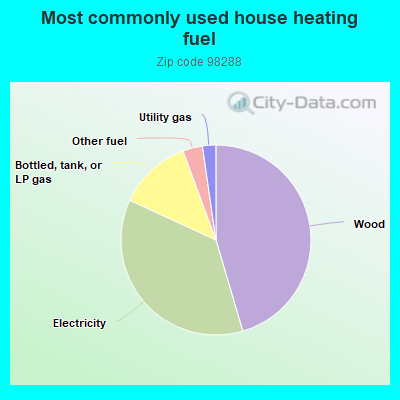
45.9%Wood
36.8%Electricity
12.6%Bottled, tank, or LP gas
3.4%Other fuel
2.3%Utility gas
Population in 1990: 388. Population change in the 1990s: +45 (+11.6%).
Place of birth for U.S.-born residents:
This state: 89
Northeast: 2
Midwest: 16
South: 28
West: 36
63% of the 98288 zip code residents lived in the same house 5 years ago. Out of people who lived in different houses, 47% lived in this county. Out of people who lived in different counties, 50% lived in Washington.
93% of the 98288 zip code residents lived in the same house 1 year ago. Out of people who lived in different houses, 8% moved from this county. Out of people who lived in different houses, 100% moved from different state.
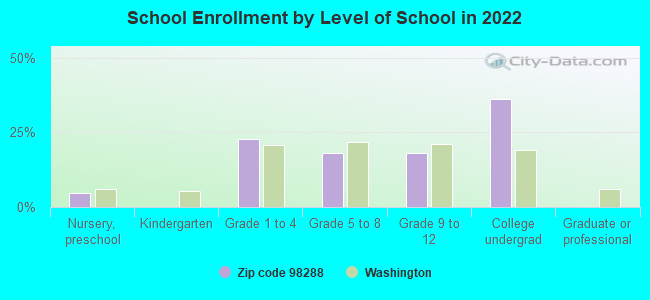
Private vs. public school enrollment:
Students in private schools in grades 1 to 8 (elementary and middle school):
Here:
0.0%
Washington:
12.4%
Students in private schools in grades 9 to 12 (high school):
Here:
0.0%
Washington:
9.2%
Students in private undergraduate colleges:
Here:
0.0%
Washington:
16.5%
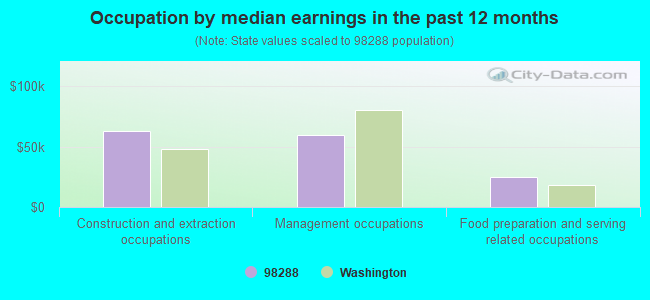
Occupation by median earnings in the past 12 months ($)
62,718Construction and extraction occupations
59,553Management occupations
24,844Food preparation and serving related occupations
Top industries in this zip code by the number of employees in 2005:
Arts, Entertainment, and Recreation: Skiing Facilities (500-999 employees: 1 establishment)
Accommodation and Food Services: Hotels (except Casino Hotels) and Motels (5-9: 1)
Educational Services: Sports and Recreation Instruction (1-4: 1)
Professional, Scientific, and Technical Services: Other Scientific and Technical Consulting Services (1-4: 1)
Accommodation and Food Services: Drinking Places (Alcoholic Beverages) (1-4: 1)
Accommodation and Food Services: Snack and Nonalcoholic Beverage Bars (1-4: 1)
Construction: All Other Specialty Trade Contractors (1-4: 1)
People in group quarters in 2010:
3 people in workers' group living quarters and job corps centers
People in group quarters in 2000:
2 people in religious group quarters
Home Mortgage Disclosure Act Aggregated Statistics For Year 2009 (Based on 2 partial tracts)
A) FHA, FSA/RHS & VA Home Purchase Loans
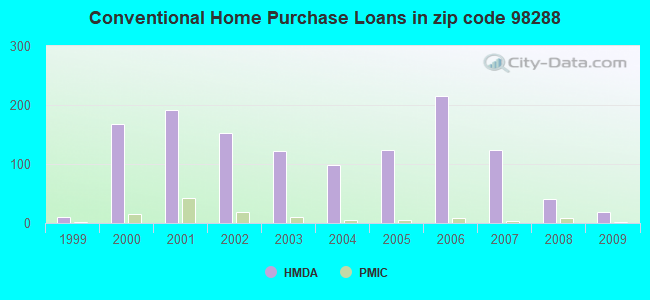
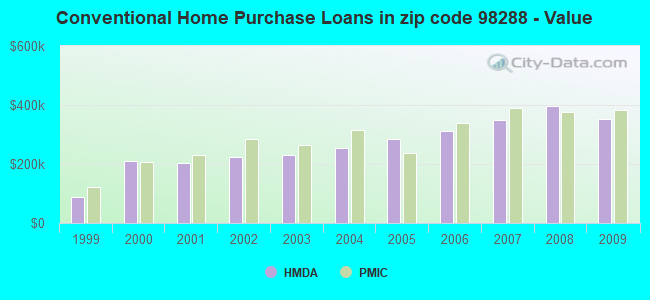
B) Conventional Home Purchase Loans
C) Refinancings
D) Home Improvement Loans
F) Non-occupant Loans on < 5 Family Dwellings (A B C & D)
G) Loans On Manufactured Home Dwelling (A B C & D)
Number
Average Value
Number
Average Value
Number
Average Value
Number
Average Value
Number
Average Value
Number
Average Value
LOANS ORIGINATED
8
$329,395
18
$353,540
172
$310,641
7
$140,773
21
$249,269
7
$199,727
APPLICATIONS APPROVED, NOT ACCEPTED
0
$0
2
$402,070
21
$321,538
0
$0
4
$99,072
1
$426,180
APPLICATIONS DENIED
2
$453,175
6
$193,483
47
$311,396
3
$29,570
5
$149,836
4
$134,748
APPLICATIONS WITHDRAWN
3
$369,610
2
$453,175
37
$292,569
0
$0
2
$189,945
1
$164,880
FILES CLOSED FOR INCOMPLETENESS
1
$260,330
1
$188,020
6
$267,083
0
$0
1
$188,020
1
$129,200
Aggregated Statistics For Year 2008 (Based on 2 partial tracts)
A) FHA, FSA/RHS & VA Home Purchase Loans
B) Conventional Home Purchase Loans
C) Refinancings
D) Home Improvement Loans
F) Non-occupant Loans on < 5 Family Dwellings (A B C & D)
G) Loans On Manufactured Home Dwelling (A B C & D)
Number
Average Value
Number
Average Value
Number
Average Value
Number
Average Value
Number
Average Value
Number
Average Value
LOANS ORIGINATED
6
$416,535
40
$397,034
84
$307,477
9
$174,520
13
$191,653
7
$249,590
APPLICATIONS APPROVED, NOT ACCEPTED
0
$0
7
$444,496
13
$342,810
2
$9,160
1
$83,890
0
$0
APPLICATIONS DENIED
4
$245,148
9
$401,321
38
$290,224
3
$89,350
5
$332,264
5
$193,612
APPLICATIONS WITHDRAWN
2
$113,775
8
$330,841
18
$275,547
4
$372,905
2
$327,345
0
$0
FILES CLOSED FOR INCOMPLETENESS
0
$0
4
$411,472
4
$481,135
1
$144,630
3
$273,510
0
$0
Aggregated Statistics For Year 2007 (Based on 2 partial tracts)
A) FHA, FSA/RHS & VA Home Purchase Loans
B) Conventional Home Purchase Loans
C) Refinancings
D) Home Improvement Loans
F) Non-occupant Loans on < 5 Family Dwellings (A B C & D)
G) Loans On Manufactured Home Dwelling (A B C & D)
Number
Average Value
Number
Average Value
Number
Average Value
Number
Average Value
Number
Average Value
Number
Average Value
LOANS ORIGINATED
3
$259,370
124
$348,278
110
$309,570
11
$177,237
15
$294,274
10
$174,424
APPLICATIONS APPROVED, NOT ACCEPTED
0
$0
18
$287,278
15
$350,776
0
$0
3
$337,790
1
$46,280
APPLICATIONS DENIED
1
$161,020
22
$290,575
48
$365,512
5
$76,558
7
$359,371
4
$281,788
APPLICATIONS WITHDRAWN
0
$0
13
$499,752
19
$361,169
1
$77,140
0
$0
1
$192,840
FILES CLOSED FOR INCOMPLETENESS
0
$0
1
$185,130
4
$144,630
1
$123,420
0
$0
0
$0
Aggregated Statistics For Year 2006 (Based on 2 partial tracts)
A) FHA, FSA/RHS & VA Home Purchase Loans
B) Conventional Home Purchase Loans
C) Refinancings
D) Home Improvement Loans
F) Non-occupant Loans on < 5 Family Dwellings (A B C & D)
G) Loans On Manufactured Home Dwelling (A B C & D)
Number
Average Value
Number
Average Value
Number
Average Value
Number
Average Value
Number
Average Value
Number
Average Value
LOANS ORIGINATED
4
$129,685
215
$311,181
125
$263,635
10
$83,307
35
$222,179
7
$194,769
APPLICATIONS APPROVED, NOT ACCEPTED
0
$0
34
$218,533
21
$206,660
2
$84,370
9
$115,169
4
$130,408
APPLICATIONS DENIED
0
$0
37
$368,533
55
$265,733
11
$43,301
6
$208,428
7
$104,823
APPLICATIONS WITHDRAWN
0
$0
17
$278,257
27
$272,761
1
$94,490
3
$254,550
0
$0
FILES CLOSED FOR INCOMPLETENESS
0
$0
1
$320,110
9
$285,296
0
$0
0
$0
0
$0
Aggregated Statistics For Year 2005 (Based on 2 partial tracts)
A) FHA, FSA/RHS & VA Home Purchase Loans
B) Conventional Home Purchase Loans
C) Refinancings
D) Home Improvement Loans
E) Loans on Dwellings For 5+ Families
F) Non-occupant Loans on < 5 Family Dwellings (A B C & D)
G) Loans On Manufactured Home Dwelling (A B C & D)
Number
Average Value
Number
Average Value
Number
Average Value
Number
Average Value
Number
Average Value
Number
Average Value
Number
Average Value
LOANS ORIGINATED
1
$245,870
124
$285,154
107
$266,579
7
$83,473
1
$219,840
24
$181,310
9
$178,377
APPLICATIONS APPROVED, NOT ACCEPTED
1
$189,950
24
$233,176
24
$290,706
2
$125,830
0
$0
8
$306,012
0
$0
APPLICATIONS DENIED
1
$245,870
17
$279,108
59
$259,370
3
$139,810
0
$0
4
$143,908
1
$166,810
APPLICATIONS WITHDRAWN
1
$96,420
7
$322,043
29
$255,214
6
$207,625
0
$0
0
$0
1
$80,030
FILES CLOSED FOR INCOMPLETENESS
0
$0
2
$97,865
24
$259,611
1
$431,960
0
$0
1
$99,310
2
$161,020
Aggregated Statistics For Year 2004 (Based on 2 partial tracts)
A) FHA, FSA/RHS & VA Home Purchase Loans
B) Conventional Home Purchase Loans
C) Refinancings
D) Home Improvement Loans
F) Non-occupant Loans on < 5 Family Dwellings (A B C & D)
G) Loans On Manufactured Home Dwelling (A B C & D)
Number
Average Value
Number
Average Value
Number
Average Value
Number
Average Value
Number
Average Value
Number
Average Value
LOANS ORIGINATED
1
$241,050
98
$254,746
108
$211,312
6
$312,883
27
$140,166
6
$214,213
APPLICATIONS APPROVED, NOT ACCEPTED
0
$0
17
$235,719
23
$272,072
2
$60,265
2
$238,155
4
$152,102
APPLICATIONS DENIED
1
$98,350
27
$227,301
72
$301,875
6
$65,565
6
$139,167
4
$91,358
APPLICATIONS WITHDRAWN
0
$0
11
$227,288
42
$214,374
4
$49,175
5
$133,638
4
$130,890
FILES CLOSED FOR INCOMPLETENESS
0
$0
4
$275,280
13
$245,426
3
$275,120
2
$188,500
2
$156,200
Aggregated Statistics For Year 2003 (Based on 2 partial tracts)
A) FHA, FSA/RHS & VA Home Purchase Loans
B) Conventional Home Purchase Loans
C) Refinancings
D) Home Improvement Loans
F) Non-occupant Loans on < 5 Family Dwellings (A B C & D)
Number
Average Value
Number
Average Value
Number
Average Value
Number
Average Value
Number
Average Value
LOANS ORIGINATED
7
$179,066
122
$230,341
346
$210,338
5
$32,204
37
$144,187
APPLICATIONS APPROVED, NOT ACCEPTED
2
$224,660
16
$213,209
52
$194,231
3
$9,320
3
$123,097
APPLICATIONS DENIED
3
$131,130
16
$188,079
69
$219,195
3
$14,783
10
$163,721
APPLICATIONS WITHDRAWN
1
$103,170
12
$232,613
61
$215,238
0
$0
5
$118,210
FILES CLOSED FOR INCOMPLETENESS
0
$0
3
$274,477
10
$150,030
0
$0
3
$100,597
Aggregated Statistics For Year 2002 (Based on 2 partial tracts)
A) FHA, FSA/RHS & VA Home Purchase Loans
B) Conventional Home Purchase Loans
C) Refinancings
D) Home Improvement Loans
F) Non-occupant Loans on < 5 Family Dwellings (A B C & D)
Number
Average Value
Number
Average Value
Number
Average Value
Number
Average Value
Number
Average Value
LOANS ORIGINATED
4
$142,220
153
$223,984
270
$219,138
6
$55,602
13
$185,126
APPLICATIONS APPROVED, NOT ACCEPTED
0
$0
18
$227,712
25
$201,595
0
$0
0
$0
APPLICATIONS DENIED
1
$93,530
13
$267,899
39
$189,923
3
$54,637
6
$213,570
APPLICATIONS WITHDRAWN
2
$150,895
12
$186,894
31
$217,412
2
$94,010
4
$95,938
FILES CLOSED FOR INCOMPLETENESS
0
$0
4
$308,785
13
$254,252
1
$50,140
1
$145,590
Aggregated Statistics For Year 2001 (Based on 2 partial tracts)
A) FHA, FSA/RHS & VA Home Purchase Loans
B) Conventional Home Purchase Loans
C) Refinancings
D) Home Improvement Loans
F) Non-occupant Loans on < 5 Family Dwellings (A B C & D)
Number
Average Value
Number
Average Value
Number
Average Value
Number
Average Value
Number
Average Value
LOANS ORIGINATED
9
$170,342
191
$202,341
193
$205,455
11
$30,153
13
$186,165
APPLICATIONS APPROVED, NOT ACCEPTED
1
$166,810
25
$195,887
25
$213,281
3
$34,710
2
$123,900
APPLICATIONS DENIED
2
$121,970
22
$184,864
43
$167,210
4
$55,922
2
$168,735
APPLICATIONS WITHDRAWN
2
$189,945
20
$168,735
31
$215,141
0
$0
3
$140,130
FILES CLOSED FOR INCOMPLETENESS
0
$0
4
$139,328
7
$176,586
1
$40,500
0
$0
Aggregated Statistics For Year 2000 (Based on 2 partial tracts)
A) FHA, FSA/RHS & VA Home Purchase Loans
B) Conventional Home Purchase Loans
C) Refinancings
D) Home Improvement Loans
F) Non-occupant Loans on < 5 Family Dwellings (A B C & D)
Number
Average Value
Number
Average Value
Number
Average Value
Number
Average Value
Number
Average Value
LOANS ORIGINATED
10
$152,151
167
$210,005
44
$146,010
10
$30,951
6
$125,667
APPLICATIONS APPROVED, NOT ACCEPTED
4
$141,498
29
$234,966
11
$123,768
5
$52,646
2
$339,880
APPLICATIONS DENIED
2
$91,600
32
$193,593
29
$160,257
7
$28,376
2
$236,230
APPLICATIONS WITHDRAWN
3
$133,060
20
$241,195
21
$104,822
2
$69,905
2
$159,575
FILES CLOSED FOR INCOMPLETENESS
0
$0
0
$0
7
$174,107
0
$0
0
$0
Aggregated Statistics For Year 1999 (Based on 1 partial tract)
A) FHA, FSA/RHS & VA Home Purchase Loans
B) Conventional Home Purchase Loans
C) Refinancings
D) Home Improvement Loans
F) Non-occupant Loans on < 5 Family Dwellings (A B C & D)
Detailed PMIC statistics for the following Tracts:0328.00
2002 - 2018 National Fire Incident Reporting System (NFIRS) incidents
Based on the data from the years 2002 - 2018 the average number of fires per year is 8. The highest number of fire incidents - 16 took place in 2003, and the least - 0 in 2012. The data has a rising trend.
When looking into fire subcategories, the most incidents belonged to: Mobile Property/Vehicle Fires (43.8%), and Structure Fires (31.5%).
Fire incident types reported to NFIRS in Zip Code 98288


 Nearest zip codes: 98224, 98256, 98068, 98940, 98925, 98251.


 Based on the data from the years 2002 - 2018 the average number of fires per year is 8. The highest number of fire incidents - 16 took place in 2003, and the least - 0 in 2012. The data has a rising trend.
 When looking into fire subcategories, the most incidents belonged to: Mobile Property/Vehicle Fires (43.8%), and Structure Fires (31.5%).