Estimated zip code population in 2022: 1,641 Zip code population in 2010: 1,037 Zip code population in 2000: 2,416
March 2022 cost of living index in zip code 98303: 94.7 (less than average, U.S. average is 100)
Land area: 7.7 sq. mi. Water area: 13.5 sq. mi.
Population density: 212 people per square mile
(very low).
OSM Map
General Map
Google Map
MSN Map
OSM Map
General Map
Google Map
MSN Map
OSM Map
General Map
Google Map
MSN Map
OSM Map
General Map
Google Map
MSN Map
Please wait while loading the map...
Real estate property taxes paid for housing units in 2022:
This zip code:
0.8% ($4,535)
Washington:
0.8% ($4,283)
Median real estate property taxes paid for housing units with mortgages in 2022: $4,822 (0.9%) Median real estate property taxes paid for housing units with no mortgage in 2022: $3,883 (0.8%)
Business Search- 14 Million verified businesses
Males: 899
(54.8%)
Females: 742
(45.2%)
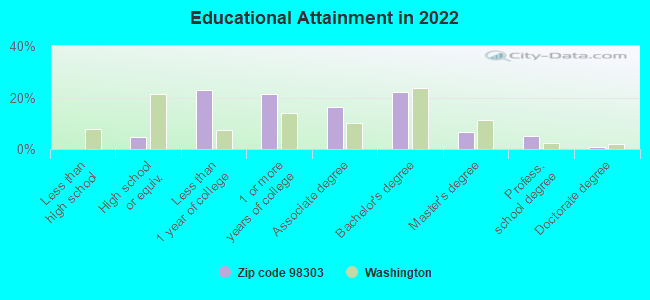
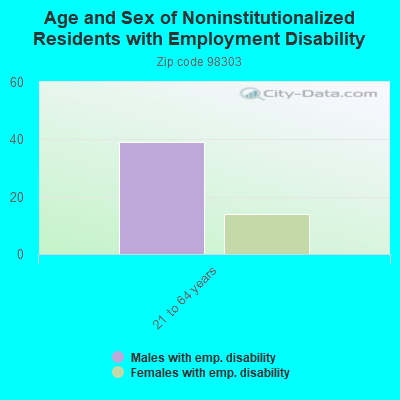
For population 25 years and over in 98303:
High school or higher: 99.1%
Bachelor's degree or higher: 34.6%
Graduate or professional degree: 12.6%
Mean travel time to work (commute): 33.9 minutes
For population 15 years and over in 98303:
Never married: 5.9%
Now married: 78.0%
Separated: 2.5%
Widowed: 3.2%
Divorced: 10.4%
Zip code 98303 compared to state average:
Unemployed percentage significantly below state average.
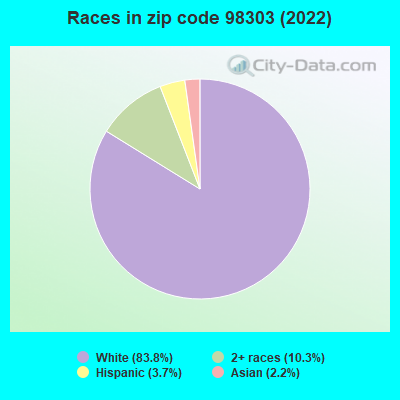
Black race population percentage significantly below state average.
Hispanic race population percentage significantly below state average.
Median age significantly above state average.
Foreign-born population percentage significantly below state average.
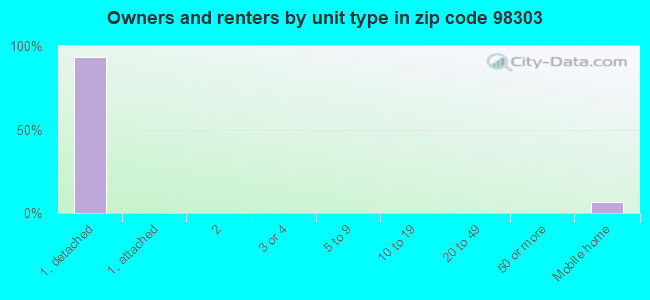
Renting percentage significantly below state average.
Length of stay since moving in significantly above state average.
House age below state average.
Number of college students significantly below state average.
Averages for the 2020 tax year for zip code 98303, filed in 2021:
Average Adjusted Gross Income (AGI) in 2020: $89,703 (Individual Income Tax Returns)
Here:
$89,703
State:
$99,264
Salary/wage: $66,735 (reported on 59.7% of returns)
Here:
$66,735
State:
$80,347
(% of AGI for various income ranges: 838.0% for AGIs below $25k, 2395.5% for AGIs $25k-50k, 3912.9% for AGIs $50k-75k, 5928.0% for AGIs $75k-100k, 11690.0% for AGIs $100k-200k)
Taxable interest for individuals: $1,762 (reported on 47.8% of returns)
This zip code:
$1,762
Washington:
$2,077
(% of AGI for various income ranges: 43.0% for AGIs below $25k, 71.8% for AGIs $25k-50k, 34.3% for AGIs $50k-75k, 74.0% for AGIs $75k-100k, 292.5% for AGIs $100k-200k)
Ordinary dividends: $4,990 (reported on 29.9% of returns)
Here:
$4,990
State:
$10,013
(% of AGI for various income ranges: 51.0% for AGIs below $25k, 80.0% for AGIs $25k-50k, 167.1% for AGIs $50k-75k, 214.0% for AGIs $75k-100k, 597.5% for AGIs $100k-200k)
Net capital gain/loss in AGI: +$26,900 (reported on 31.3% of returns)
Here:
+$26,900
State:
+$40,092
(% of AGI for various income ranges: 56.0% for AGIs below $25k, 27.3% for AGIs $25k-50k, 107.1% for AGIs $50k-75k, 522.0% for AGIs $75k-100k, 1366.2% for AGIs $100k-200k)
Profit/loss from business: +$17,600 (reported on 14.9% of returns)
Here:
+$17,600
State:
+$18,312
(% of AGI for various income ranges: 61.0% for AGIs below $25k, 351.8% for AGIs $25k-50k, 1082.9% for AGIs $50k-75k, 692.5% for AGIs $100k-200k)
Taxable individual retirement arrangement distribution: $32,915 (reported on 19.4% of returns)
98303:
$32,915
Washington:
$24,221
(% of AGI for various income ranges: 451.8% for AGIs $25k-50k, 618.6% for AGIs $50k-75k, 1518.0% for AGIs $75k-100k, 3237.5% for AGIs $100k-200k)
Total itemized deductions: $30,611 (reported on 13.4% of returns)
Here:
$30,611
State:
$39,068
(% of AGI for various income ranges: 1875.7% for AGIs $50k-75k, 1802.5% for AGIs $100k-200k)
Charity contributions: $5,471 (reported on 10.4% of returns)
Here:
$5,471
State:
$15,331
(% of AGI for various income ranges: 137.1% for AGIs $50k-75k, 358.8% for AGIs $100k-200k)
Taxes paid: $7,522 (reported on 13.4% of returns)
98303:
$7,522
State:
$7,774
(% of AGI for various income ranges: 411.4% for AGIs $50k-75k, 486.2% for AGIs $100k-200k)
Earned income credit: $1,150 (reported on 6.0% of returns)
Here:
$1,150
State:
$2,020
(% of AGI for various income ranges: 46.0% for AGIs below $25k)
Percentage of individuals using paid preparers for their 2020 taxes: 91.0%
Here:
91%
State:
93%
(% for various income ranges: 88.2% for AGIs below $25k, 92.9% for AGIs $25k-50k, 90.0% for AGIs $50k-75k, 87.5% for AGIs $75k-100k, 92.3% for AGIs $100k-200k, 100.0% for AGIs over 200k)
Averages for the 2012 tax year for zip code 98303, filed in 2013:
Average Adjusted Gross Income (AGI) in 2012: $60,614 (Individual Income Tax Returns)
Here:
$60,614
State:
$69,533
Salary/wage: $50,728 (reported on 59.2% of returns)
Here:
$50,728
State:
$57,267
(% of AGI for various income ranges: 39.0% for AGIs below $25k, 48.4% for AGIs $25k-50k, 52.4% for AGIs $50k-75k, 52.2% for AGIs $75k-100k, 49.3% for AGIs $100k-200k)
Taxable interest for individuals: $1,169 (reported on 53.1% of returns)
This zip code:
$1,169
Washington:
$1,816
(% of AGI for various income ranges: 2.4% for AGIs below $25k, 0.7% for AGIs $25k-50k, 0.9% for AGIs $50k-75k, 0.5% for AGIs $75k-100k, 1.2% for AGIs $100k-200k)
Ordinary dividends: $4,589 (reported on 36.7% of returns)
Here:
$4,589
State:
$8,163
(% of AGI for various income ranges: 2.7% for AGIs below $25k, 5.0% for AGIs $25k-50k, 2.9% for AGIs $50k-75k, 3.0% for AGIs $100k-200k)
Net capital gain/loss in AGI: +$1,367 (reported on 30.6% of returns)
Here:
+$1,367
State:
+$21,568
(% of AGI for various income ranges: 1.8% for AGIs $100k-200k)
Profit/loss from business: +$15,780 (reported on 20.4% of returns)
Here:
+$15,780
State:
+$16,521
(% of AGI for various income ranges: 19.7% for AGIs below $25k, 3.7% for AGIs $50k-75k, 23.1% for AGIs $75k-100k)
Taxable individual retirement arrangement distribution: $22,610 (reported on 20.4% of returns)
98303:
$22,610
Washington:
$18,648
(% of AGI for various income ranges: 11.1% for AGIs $25k-50k, 7.9% for AGIs $50k-75k, 10.1% for AGIs $75k-100k, 6.9% for AGIs $100k-200k)
Total itemized deductions: $22,082 (25% of AGI, reported on 44.9% of returns)
Here:
$22,082
State:
$23,872
Here:
25.1% of AGI
State:
18.2% of AGI
(% of AGI for various income ranges: 23.6% for AGIs below $25k, 17.7% for AGIs $25k-50k, 18.0% for AGIs $50k-75k, 14.6% for AGIs $75k-100k, 15.1% for AGIs $100k-200k)
Charity contributions: $2,871 (reported on 34.7% of returns)
Here:
$2,871
State:
$4,465
(% of AGI for various income ranges: 2.9% for AGIs $25k-50k, 1.7% for AGIs $50k-75k, 1.0% for AGIs $75k-100k, 1.7% for AGIs $100k-200k)
Taxes paid: $6,768 (reported on 44.9% of returns)
98303:
$6,768
State:
$6,400
(% of AGI for various income ranges: 6.0% for AGIs below $25k, 5.0% for AGIs $25k-50k, 5.8% for AGIs $50k-75k, 4.1% for AGIs $75k-100k, 4.9% for AGIs $100k-200k)
Earned income credit: $1,440 (reported on 10.2% of returns)
Here:
$1,440
State:
$2,073
(% of AGI for various income ranges: 4.0% for AGIs below $25k)
Percentage of individuals using paid preparers for their 2012 taxes: 49.0%
Here:
49%
State:
43%
(% for various income ranges: 43.8% for AGIs below $25k, 40.0% for AGIs $25k-50k, 50.0% for AGIs $50k-75k, 60.0% for AGIs $75k-100k, 60.0% for AGIs $100k-200k)
Averages for the 2004 tax year for zip code 98303, filed in 2005:
Average Adjusted Gross Income (AGI) in 2004: $45,880 (Individual Income Tax Returns)
Here:
$45,880
State:
$54,331
Salary/wage: $39,957 (reported on 63.9% of returns)
Here:
$39,957
State:
$45,761
(% of AGI for various income ranges: 65.2% for AGIs below $10k, 47.1% for AGIs $10k-25k, 52.8% for AGIs $25k-50k, 47.1% for AGIs $50k-75k, 62.9% for AGIs $75k-100k, 61.4% for AGIs over 100k)
Taxable interest for individuals: $1,947 (reported on 60.0% of returns)
This zip code:
$1,947
Washington:
$2,110
(% of AGI for various income ranges: 9.3% for AGIs below $10k, 4.0% for AGIs $10k-25k, 4.9% for AGIs $25k-50k, 2.2% for AGIs $50k-75k, 1.9% for AGIs $75k-100k, 1.0% for AGIs over 100k)
Taxable dividends: $3,878 (reported on 38.7% of returns)
Here:
$3,878
State:
$5,879
(% of AGI for various income ranges: 13.2% for AGIs below $10k, 5.1% for AGIs $10k-25k, 2.8% for AGIs $25k-50k, 3.5% for AGIs $50k-75k, 1.9% for AGIs $75k-100k, 3.3% for AGIs over 100k)
Net capital gain/loss: +$5,788 (reported on 31.2% of returns)
Here:
+$5,788
State:
+$15,835
(% of AGI for various income ranges: -9.3% for AGIs below $10k, -1.5% for AGIs $10k-25k, 0.9% for AGIs $25k-50k, 1.1% for AGIs $50k-75k, 3.7% for AGIs $75k-100k, 10.6% for AGIs over 100k)
Profit/loss from business: +$10,337 (reported on 19.7% of returns)
Here:
+$10,337
State:
+$13,994
(% of AGI for various income ranges: 10.2% for AGIs below $10k, 8.2% for AGIs $10k-25k, 0.5% for AGIs $25k-50k, 9.1% for AGIs $50k-75k, 4.7% for AGIs over 100k)
IRA payment deduction: $3,333 (reported on 2.6% of returns)
98303:
$3,333
Washington:
$3,001
Total itemized deductions: $16,263 (24% of AGI, reported on 44.7% of returns)
Here:
$16,263
State:
$19,669
Here:
24.5% of AGI
State:
20.7% of AGI
(% of AGI for various income ranges: 42.9% for AGIs below $10k, 25.7% for AGIs $10k-25k, 18.4% for AGIs $25k-50k, 15.4% for AGIs $50k-75k, 13.9% for AGIs $75k-100k, 11.5% for AGIs over 100k)
Charity contributions deductions: $2,376 (3% of AGI, reported on 38.0% of returns)
Here:
$2,376
State:
$3,569
Here:
3.2% of AGI
State:
3.5% of AGI
(% of AGI for various income ranges: 3.5% for AGIs $10k-25k, 1.5% for AGIs $25k-50k, 1.8% for AGIs $50k-75k, 1.7% for AGIs $75k-100k, 2.3% for AGIs over 100k)
Total tax: $6,732 (reported on 76.5% of returns)
98303:
$6,732
State:
$9,065
(% of AGI for various income ranges: 3.0% for AGIs below $10k, 3.6% for AGIs $10k-25k, 6.4% for AGIs $25k-50k, 9.7% for AGIs $50k-75k, 11.9% for AGIs $75k-100k, 17.8% for AGIs over 100k)
Earned income credit: $1,667 (reported on 10.3% of returns)
Here:
$1,667
State:
$1,607
Percentage of individuals using paid preparers for their 2004 taxes: 55.1%
Here:
55%
State:
49%
(% for various income ranges: 41.7% for AGIs below $10k, 60.6% for AGIs $10k-25k, 55.6% for AGIs $25k-50k, 52.4% for AGIs $50k-75k, 61.2% for AGIs $75k-100k, 66.7% for AGIs over 100k)
Household received Food Stamps/SNAP in the past 12 months: 45 Household did not receive Food Stamps/SNAP in the past 12 months: 806
Women who did not have a birth in the past 12 months: 47 (47 now married, 0 unmarried)
Housing units in zip code 98303 with a mortgage: 656 (79 second mortgage, 82 both second mortgage and home equity loan) Median monthly owner costs for units with a mortgage: $2,025 Median monthly owner costs for units without a mortgage: $647
Residents with income below the poverty level in 2022:
This zip code:
20.8%
Whole state:
10.0%
Residents with income below 50% of the poverty level in 2022:
This zip code:
0.9%
Whole state:
4.6%
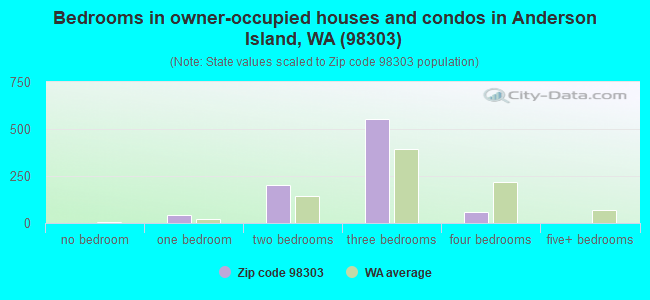
Median number of rooms in houses and condos:
Here:
6.1
State:
6.5
Notable locations in this zip code not listed on our city pages
Notable locations in zip code 98303: Anderson Island Ferry Landing (A), Villa Beach (B), Yoman Dock (C), Pierce County Fire Protection District 27 (D), Johnson Farm Museum (E). Display/hide their locations on the map
Size of family households: 500 2-persons, 58 3-persons, 29 6-persons
Size of nonfamily households: 253 1-person, 14 2-persons
134 married couples with children.
0 single-parent households ().
92.2% of residents of 98303 zip code speak English at home.
2.1% of residents speak Spanish at home (100% very well).
5.8% of residents speak other Indo-European language at home (50% very well, 50% well).
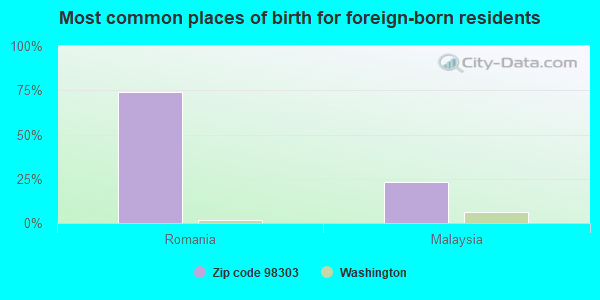
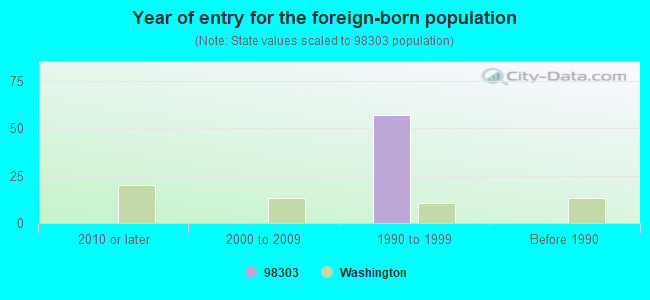
Foreign born population: 61 (3.8%) (76.7% of them are naturalized citizens)
This zip code:
3.8%
Whole state:
15.3%
74%Romania
23%Malaysia
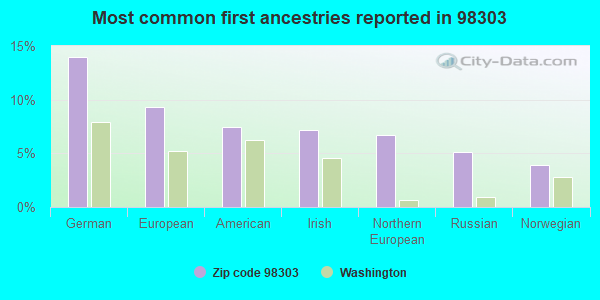
14%German
9%European
7%American
7%Irish
7%Northern European
5%Russian
4%Norwegian
Year of entry for the foreign-born population
02010 or later
02000 to 2009
571990 to 1999
0Before 1990
Facilities with environmental interests located in this zip code:
ANDERSON ISLAND ABANDONED MERCURY SITE (13500 BLK AGATE BEACH RD in ANDERSON ISLAND, WA)
(Resource Conservation and Recovery Act (tracking hazardous waste)) STATE MASTER (Washington State Department of Ecology's Facility/Site identification system) - HAZWASTE-WAH000014514, SQG Organizations: WA ECY (CONTACT/OWNER)
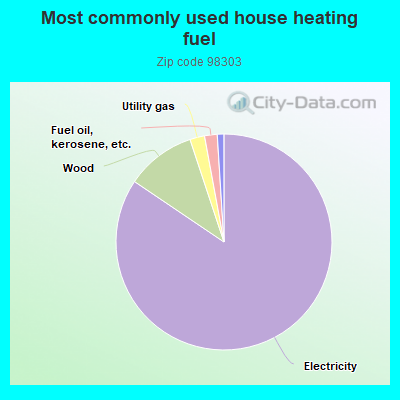
84.8%Electricity
10.5%Wood
2.2%Utility gas
1.9%Fuel oil, kerosene, etc.
1.0%Bottled, tank, or LP gas
Population in 1990: 548. Population change in the 1990s: +1,868 (+340.9%).
Place of birth for U.S.-born residents:
This state: 803
Northeast: 84
Midwest: 122
West: 566
38% of the 98303 zip code residents lived in the same house 5 years ago. Out of people who lived in different houses, 21% lived in this county. Out of people who lived in different counties, 50% lived in Washington.
99% of the 98303 zip code residents lived in the same house 1 year ago. Out of people who lived in different houses, 177% moved from different state.
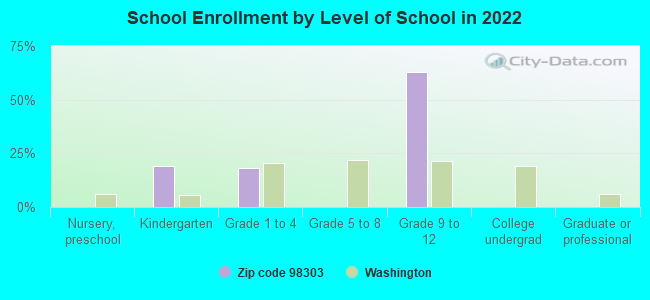
Private vs. public school enrollment:
Students in private schools in grades 1 to 8 (elementary and middle school):
Here:
0.0%
Washington:
12.4%
Students in private schools in grades 9 to 12 (high school):
Here:
0.0%
Washington:
9.2%
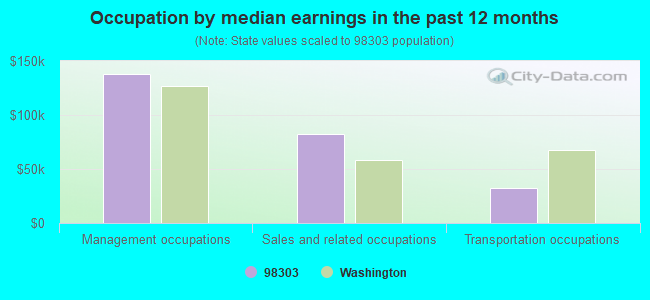
Occupation by median earnings in the past 12 months ($)
137,940Management occupations
82,145Sales and related occupations
32,865Transportation occupations
Companies with federal contracts located in this zip code:
ALEXANDER, PATRICIA (12912 134TH AVE COURT in ANDERSON ISLAN, WA; small business) : $220,864 in 4 contractsfrom 2004 to 2006
$101,762 with Army for Medical/Psychiatric Consultation Services. Signed on 2006-01-04. Completion date: 2005-12-31.
$98,321, same as above.Signed on 2004-12-30. Completion date: 2005-12-31.
$35,624, same as above.Signed on 2004-07-01. Completion date: 2004-12-31.
-$14,843, same as above.Signed on 2004-09-27. Completion date: 2004-12-31.
AMERICAN TOMAHAWK COMPANY, LLC (12509 93RD ST CT in ANDERSON ISLAN, WA; small business) : $101,468 in 2 contractsfrom 2003 to 2004
$90,800 with Army for Individual Equipment. Signed on 2004-02-04. Completion date: 2004-07-15.
$10,668 with Army for Armor, Personal. Signed on 2003-08-12. Completion date: 2003-08-29.
VICKIE R DRIVER (10513 OLYMPIC PLACE in ANDERSON ISLAN, WA; small business) : $44,519 in 2 contractsin 2003
$43,019 with Army for Podiatry Services. Signed on 2003-07-10. Completion date: 2003-08-10.
$1,500, same as above.Signed on 2003-11-05. Completion date: 2003-08-10.
Top industries in this zip code by the number of employees in 2005:
Other Services (except Public Administration): Other Similar Organizations (except Business, Professional, Labor, and Political Organizations) (20-49 employees: 1 establishment)
Construction: New Single-Family Housing Construction (except Operative Builders) (5-9: 1, 1-4: 3)
Real Estate and Rental and Leasing: Truck, Utility Trailer, and RV (Recreational Vehicle) Rental and Leasing (5-9: 1)
Finance and Insurance: Other Direct Insurance (except Life, Health, and Medical) Carriers (5-9: 1)
Accommodation and Food Services: Bed-and-Breakfast Inns (1-4: 1)
Professional, Scientific, and Technical Services: Administrative Management and General Management Consulting Services (1-4: 1)
People in group quarters in 2000:
1,468 people in state prisons
Home Mortgage Disclosure Act Aggregated Statistics For Year 2009 (Based on 2 partial tracts)
A) FHA, FSA/RHS & VA Home Purchase Loans
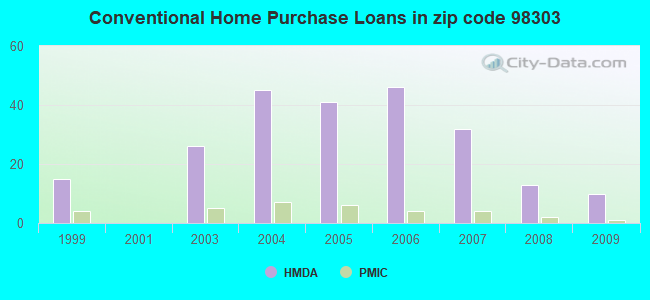
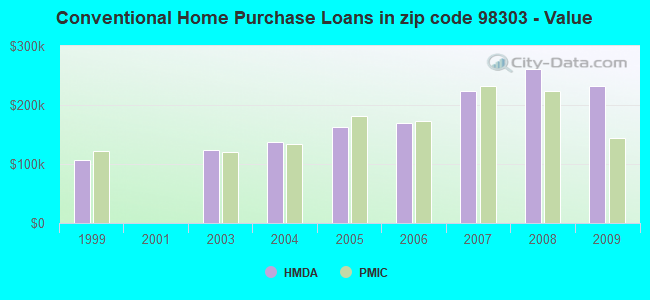
B) Conventional Home Purchase Loans
C) Refinancings
D) Home Improvement Loans
F) Non-occupant Loans on < 5 Family Dwellings (A B C & D)
G) Loans On Manufactured Home Dwelling (A B C & D)
Number
Average Value
Number
Average Value
Number
Average Value
Number
Average Value
Number
Average Value
Number
Average Value
LOANS ORIGINATED
10
$190,887
10
$232,716
47
$212,273
1
$210,950
12
$218,265
9
$142,670
APPLICATIONS APPROVED, NOT ACCEPTED
0
$0
2
$161,245
5
$213,738
1
$11,880
2
$130,520
1
$112,320
APPLICATIONS DENIED
1
$88,560
2
$141,105
22
$239,011
2
$96,565
4
$261,492
4
$185,065
APPLICATIONS WITHDRAWN
0
$0
1
$363,550
11
$238,624
1
$577,080
2
$261,170
2
$151,045
FILES CLOSED FOR INCOMPLETENESS
0
$0
0
$0
2
$198,555
0
$0
0
$0
0
$0
Aggregated Statistics For Year 2008 (Based on 2 partial tracts)
A) FHA, FSA/RHS & VA Home Purchase Loans
B) Conventional Home Purchase Loans
C) Refinancings
D) Home Improvement Loans
F) Non-occupant Loans on < 5 Family Dwellings (A B C & D)
G) Loans On Manufactured Home Dwelling (A B C & D)
Number
Average Value
Number
Average Value
Number
Average Value
Number
Average Value
Number
Average Value
Number
Average Value
LOANS ORIGINATED
6
$218,997
13
$260,226
34
$223,814
3
$61,967
9
$224,807
10
$182,367
APPLICATIONS APPROVED, NOT ACCEPTED
0
$0
2
$329,850
8
$219,502
1
$124,710
2
$324,040
1
$254,590
APPLICATIONS DENIED
2
$235,605
4
$257,682
25
$242,914
5
$128,738
3
$202,773
4
$183,580
APPLICATIONS WITHDRAWN
1
$252,260
2
$276,275
13
$203,839
1
$15,490
3
$166,540
3
$165,937
FILES CLOSED FOR INCOMPLETENESS
0
$0
1
$185,650
3
$253,123
1
$125,490
1
$242,710
0
$0
Aggregated Statistics For Year 2007 (Based on 2 partial tracts)
A) FHA, FSA/RHS & VA Home Purchase Loans
B) Conventional Home Purchase Loans
C) Refinancings
D) Home Improvement Loans
F) Non-occupant Loans on < 5 Family Dwellings (A B C & D)
G) Loans On Manufactured Home Dwelling (A B C & D)
Number
Average Value
Number
Average Value
Number
Average Value
Number
Average Value
Number
Average Value
Number
Average Value
LOANS ORIGINATED
6
$177,598
32
$222,932
51
$213,040
5
$127,240
17
$259,248
18
$156,053
APPLICATIONS APPROVED, NOT ACCEPTED
0
$0
5
$265,482
7
$171,003
0
$0
3
$334,457
1
$118,000
APPLICATIONS DENIED
2
$236,255
12
$188,551
35
$222,369
9
$115,042
5
$174,078
13
$137,799
APPLICATIONS WITHDRAWN
1
$83,660
6
$259,233
15
$200,621
3
$150,617
2
$244,775
3
$127,207
FILES CLOSED FOR INCOMPLETENESS
0
$0
3
$118,513
6
$218,610
0
$0
1
$153,110
1
$72,040
Aggregated Statistics For Year 2006 (Based on 4 partial tracts)
A) FHA, FSA/RHS & VA Home Purchase Loans
B) Conventional Home Purchase Loans
C) Refinancings
D) Home Improvement Loans
F) Non-occupant Loans on < 5 Family Dwellings (A B C & D)
G) Loans On Manufactured Home Dwelling (A B C & D)
Number
Average Value
Number
Average Value
Number
Average Value
Number
Average Value
Number
Average Value
Number
Average Value
LOANS ORIGINATED
6
$181,687
46
$170,216
54
$188,964
8
$97,180
21
$169,010
15
$148,224
APPLICATIONS APPROVED, NOT ACCEPTED
1
$196,490
7
$170,117
10
$233,284
1
$20,660
2
$213,400
4
$136,522
APPLICATIONS DENIED
2
$152,595
12
$170,628
29
$197,211
6
$110,165
4
$149,562
9
$120,063
APPLICATIONS WITHDRAWN
1
$214,050
5
$167,676
22
$215,397
2
$106,765
3
$156,383
3
$134,693
FILES CLOSED FOR INCOMPLETENESS
1
$108,190
2
$165,895
5
$174,182
0
$0
1
$103,800
1
$132,710
Aggregated Statistics For Year 2005 (Based on 2 partial tracts)
A) FHA, FSA/RHS & VA Home Purchase Loans
B) Conventional Home Purchase Loans
C) Refinancings
D) Home Improvement Loans
F) Non-occupant Loans on < 5 Family Dwellings (A B C & D)
G) Loans On Manufactured Home Dwelling (A B C & D)
Number
Average Value
Number
Average Value
Number
Average Value
Number
Average Value
Number
Average Value
Number
Average Value
LOANS ORIGINATED
9
$162,408
41
$162,364
50
$164,551
6
$97,342
18
$164,459
18
$126,618
APPLICATIONS APPROVED, NOT ACCEPTED
1
$176,090
8
$155,565
8
$154,952
2
$81,720
2
$158,920
3
$154,577
APPLICATIONS DENIED
1
$174,540
12
$144,355
32
$142,986
4
$84,238
4
$139,300
8
$116,190
APPLICATIONS WITHDRAWN
1
$168,860
6
$173,898
23
$160,207
3
$137,620
4
$129,292
4
$120,128
FILES CLOSED FOR INCOMPLETENESS
0
$0
2
$178,675
6
$185,302
1
$27,110
0
$0
1
$147,950
Aggregated Statistics For Year 2004 (Based on 2 partial tracts)
A) FHA, FSA/RHS & VA Home Purchase Loans
B) Conventional Home Purchase Loans
C) Refinancings
D) Home Improvement Loans
F) Non-occupant Loans on < 5 Family Dwellings (A B C & D)
G) Loans On Manufactured Home Dwelling (A B C & D)
Number
Average Value
Number
Average Value
Number
Average Value
Number
Average Value
Number
Average Value
Number
Average Value
LOANS ORIGINATED
7
$146,584
45
$138,034
54
$144,501
3
$76,083
19
$140,515
15
$116,827
APPLICATIONS APPROVED, NOT ACCEPTED
2
$111,930
5
$158,070
11
$170,694
1
$75,140
2
$76,555
3
$130,563
APPLICATIONS DENIED
1
$167,830
10
$120,657
32
$146,730
6
$73,285
5
$139,790
7
$128,179
APPLICATIONS WITHDRAWN
1
$112,580
7
$165,284
22
$130,778
3
$50,520
2
$124,710
4
$109,865
FILES CLOSED FOR INCOMPLETENESS
0
$0
1
$232,380
5
$146,400
1
$27,630
1
$83,140
1
$60,940
Aggregated Statistics For Year 2003 (Based on 2 partial tracts)
A) FHA, FSA/RHS & VA Home Purchase Loans
B) Conventional Home Purchase Loans
C) Refinancings
D) Home Improvement Loans
F) Non-occupant Loans on < 5 Family Dwellings (A B C & D)
Number
Average Value
Number
Average Value
Number
Average Value
Number
Average Value
Number
Average Value
LOANS ORIGINATED
5
$126,518
26
$123,201
86
$135,237
2
$24,270
23
$132,210
APPLICATIONS APPROVED, NOT ACCEPTED
1
$117,740
4
$175,640
11
$127,551
1
$19,360
2
$78,105
APPLICATIONS DENIED
0
$0
9
$144,018
25
$129,720
3
$38,300
4
$117,288
APPLICATIONS WITHDRAWN
0
$0
4
$181,258
25
$145,501
1
$7,750
3
$120,493
FILES CLOSED FOR INCOMPLETENESS
0
$0
2
$156,470
3
$117,997
0
$0
1
$74,880
Aggregated Statistics For Year 2001 (Based on 2 partial tracts)
C) Refinancings
Number
Average Value
LOANS ORIGINATED
0
$0
APPLICATIONS APPROVED, NOT ACCEPTED
0
$0
APPLICATIONS DENIED
1
$142,880
APPLICATIONS WITHDRAWN
0
$0
FILES CLOSED FOR INCOMPLETENESS
0
$0
Aggregated Statistics For Year 1999 (Based on 2 partial tracts)
A) FHA, FSA/RHS & VA Home Purchase Loans
B) Conventional Home Purchase Loans
C) Refinancings
D) Home Improvement Loans
F) Non-occupant Loans on < 5 Family Dwellings (A B C & D)
Detailed PMIC statistics for the following Tracts:0726.03
2003 - 2018 National Fire Incident Reporting System (NFIRS) incidents
According to the data from the years 2003 - 2018 the average number of fires per year is 8. The highest number of reported fire incidents - 32 took place in 2006, and the least - 0 in 2004. The data has an increasing trend.
When looking into fire subcategories, the most incidents belonged to: Outside Fires (43.5%), and Structure Fires (38.7%).
Fire incident types reported to NFIRS in Zip Code 98303


 Nearest zip codes: 98388, 98327, 98351, 98333, 98516, 98433.
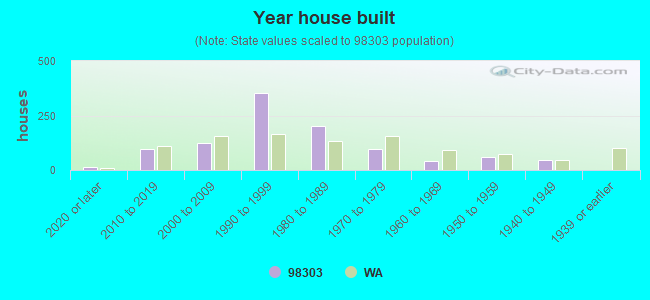


 According to the data from the years 2003 - 2018 the average number of fires per year is 8. The highest number of reported fire incidents - 32 took place in 2006, and the least - 0 in 2004. The data has an increasing trend.
 When looking into fire subcategories, the most incidents belonged to: Outside Fires (43.5%), and Structure Fires (38.7%).