Estimated zip code population in 2022: 33,277 Zip code population in 2010: 29,528 Zip code population in 2000: 25,267
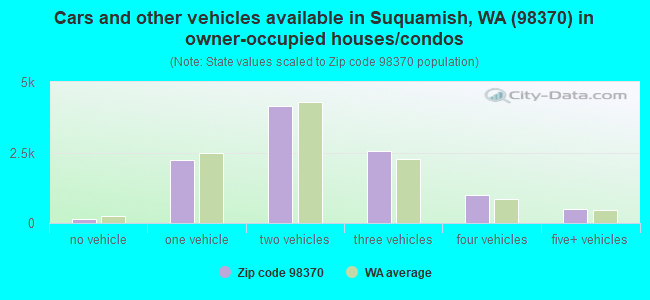
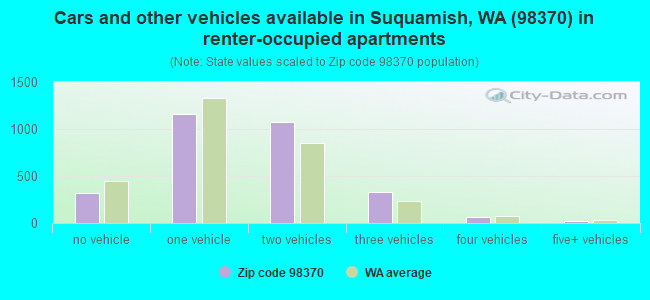
Houses and condos: 14,316 Renter-occupied apartments: 2,989
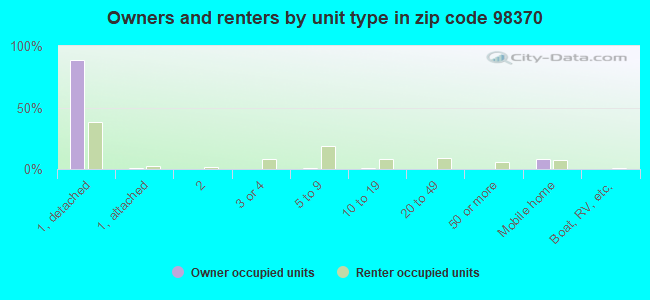
% of renters here:
22%
State:
36%
March 2022 cost of living index in zip code 98370: 108.8 (more than average, U.S. average is 100)
Land area: 56.6 sq. mi. Water area: 9.9 sq. mi.
Population density: 588 people per square mile
(low).
OSM Map
General Map
Google Map
MSN Map
OSM Map
General Map
Google Map
MSN Map
OSM Map
General Map
Google Map
MSN Map
OSM Map
General Map
Google Map
MSN Map
Please wait while loading the map...
Real estate property taxes paid for housing units in 2022:
This zip code:
0.7% ($4,302)
Washington:
0.8% ($4,283)
Median real estate property taxes paid for housing units with mortgages in 2022: $4,227 (0.6%) Median real estate property taxes paid for housing units with no mortgage in 2022: $4,479 (0.7%)
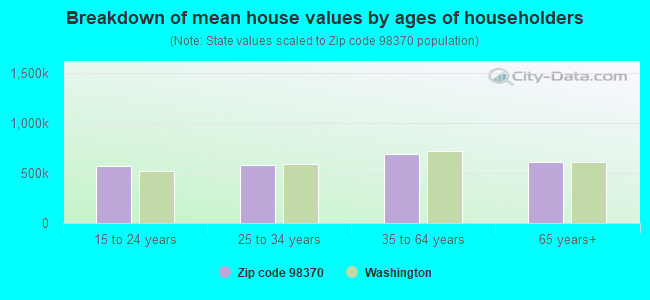
Estimated median house/condo value in 2022: $640,958
98370:
$640,958
Washington:
$569,500
According to our research of Washington and other state lists, there were 11 registered sex offenders living in 98370 zip code as of April 24, 2024. The ratio of all residents to sex offenders in zip code 98370 is 2,718 to 1. The ratio of registered sex offenders to all residents in this zip code is lower than the state average.
Median resident age:
This zip code:
45.4 years
Washington median age:
38.4 years
Average household size:
This zip code:
2.4 people
Washington:
2.5 people
Averages for the 2020 tax year for zip code 98370, filed in 2021:
Average Adjusted Gross Income (AGI) in 2020: $93,143 (Individual Income Tax Returns)
Here:
$93,143
State:
$99,264
Salary/wage: $75,412 (reported on 75.5% of returns)
Here:
$75,412
State:
$80,347
(% of AGI for various income ranges: 1145.6% for AGIs below $25k, 3248.5% for AGIs $25k-50k, 5697.5% for AGIs $50k-75k, 8403.0% for AGIs $75k-100k, 16550.5% for AGIs $100k-200k, 61178.2% for AGIs over 200k)
Taxable interest for individuals: $1,504 (reported on 44.4% of returns)
This zip code:
$1,504
Washington:
$2,077
(% of AGI for various income ranges: 28.9% for AGIs below $25k, 35.2% for AGIs $25k-50k, 75.0% for AGIs $50k-75k, 105.4% for AGIs $75k-100k, 120.9% for AGIs $100k-200k, 986.0% for AGIs over 200k)
Ordinary dividends: $6,629 (reported on 28.5% of returns)
Here:
$6,629
State:
$10,013
(% of AGI for various income ranges: 57.9% for AGIs below $25k, 75.6% for AGIs $25k-50k, 142.8% for AGIs $50k-75k, 228.9% for AGIs $75k-100k, 370.6% for AGIs $100k-200k, 3422.8% for AGIs over 200k)
Net capital gain/loss in AGI: +$26,484 (reported on 27.2% of returns)
Here:
+$26,484
State:
+$40,092
(% of AGI for various income ranges: 26.0% for AGIs below $25k, 54.8% for AGIs $25k-50k, 149.5% for AGIs $50k-75k, 298.3% for AGIs $75k-100k, 660.9% for AGIs $100k-200k, 23058.5% for AGIs over 200k)
Profit/loss from business: +$18,461 (reported on 14.1% of returns)
Here:
+$18,461
State:
+$18,312
(% of AGI for various income ranges: 100.8% for AGIs below $25k, 220.6% for AGIs $25k-50k, 255.7% for AGIs $50k-75k, 354.1% for AGIs $75k-100k, 527.4% for AGIs $100k-200k, 3472.5% for AGIs over 200k)
Taxable individual retirement arrangement distribution: $23,993 (reported on 12.5% of returns)
98370:
$23,993
Washington:
$24,221
(% of AGI for various income ranges: 68.4% for AGIs below $25k, 131.2% for AGIs $25k-50k, 304.4% for AGIs $50k-75k, 460.2% for AGIs $75k-100k, 878.6% for AGIs $100k-200k, 3299.0% for AGIs over 200k)
Self-employed (Keogh) retirement plans: $23,173 (reported on 0.7% of returns)
98370:
$23,173
Washington:
$24,166
(% of AGI for various income ranges: 10.3% for AGIs $25k-50k, 31.8% for AGIs $100k-200k, 403.5% for AGIs over 200k)
Total itemized deductions: $34,585 (reported on 13.1% of returns)
Here:
$34,585
State:
$39,068
(% of AGI for various income ranges: 113.0% for AGIs below $25k, 179.8% for AGIs $25k-50k, 455.2% for AGIs $50k-75k, 699.8% for AGIs $75k-100k, 1032.1% for AGIs $100k-200k, 6600.5% for AGIs over 200k)
Charity contributions: $10,443 (reported on 10.3% of returns)
Here:
$10,443
State:
$15,331
(% of AGI for various income ranges: 5.4% for AGIs below $25k, 17.4% for AGIs $25k-50k, 54.0% for AGIs $50k-75k, 94.6% for AGIs $75k-100k, 194.2% for AGIs $100k-200k, 2575.5% for AGIs over 200k)
Taxes paid: $7,128 (reported on 12.9% of returns)
98370:
$7,128
State:
$7,774
(% of AGI for various income ranges: 19.2% for AGIs below $25k, 38.6% for AGIs $25k-50k, 93.4% for AGIs $50k-75k, 153.7% for AGIs $75k-100k, 237.8% for AGIs $100k-200k, 1176.2% for AGIs over 200k)
Earned income credit: $1,865 (reported on 6.3% of returns)
Here:
$1,865
State:
$2,020
(% of AGI for various income ranges: 43.5% for AGIs below $25k, 35.7% for AGIs $25k-50k, 0.8% for AGIs $50k-75k)
Percentage of individuals using paid preparers for their 2020 taxes: 92.1%
Here:
92%
State:
93%
(% for various income ranges: 90.0% for AGIs below $25k, 92.9% for AGIs $25k-50k, 92.1% for AGIs $50k-75k, 91.5% for AGIs $75k-100k, 93.1% for AGIs $100k-200k, 94.4% for AGIs over 200k)
Averages for the 2012 tax year for zip code 98370, filed in 2013:
Average Adjusted Gross Income (AGI) in 2012: $69,137 (Individual Income Tax Returns)
Here:
$69,137
State:
$69,533
Salary/wage: $58,177 (reported on 78.5% of returns)
Here:
$58,177
State:
$57,267
(% of AGI for various income ranges: 68.3% for AGIs below $25k, 68.0% for AGIs $25k-50k, 67.4% for AGIs $50k-75k, 71.4% for AGIs $75k-100k, 74.7% for AGIs $100k-200k, 43.4% for AGIs over 200k)
Taxable interest for individuals: $1,488 (reported on 45.2% of returns)
This zip code:
$1,488
Washington:
$1,816
(% of AGI for various income ranges: 1.6% for AGIs below $25k, 0.9% for AGIs $25k-50k, 0.9% for AGIs $50k-75k, 0.7% for AGIs $75k-100k, 0.7% for AGIs $100k-200k, 1.7% for AGIs over 200k)
Ordinary dividends: $5,386 (reported on 27.1% of returns)
Here:
$5,386
State:
$8,163
(% of AGI for various income ranges: 2.6% for AGIs below $25k, 1.6% for AGIs $25k-50k, 1.4% for AGIs $50k-75k, 1.6% for AGIs $75k-100k, 1.4% for AGIs $100k-200k, 4.5% for AGIs over 200k)
Net capital gain/loss in AGI: +$12,083 (reported on 22.3% of returns)
Here:
+$12,083
State:
+$21,568
(% of AGI for various income ranges: 0.1% for AGIs $25k-50k, 0.5% for AGIs $50k-75k, 0.9% for AGIs $75k-100k, 1.4% for AGIs $100k-200k, 16.7% for AGIs over 200k)
Profit/loss from business: +$14,762 (reported on 13.5% of returns)
Here:
+$14,762
State:
+$16,521
(% of AGI for various income ranges: 7.8% for AGIs below $25k, 4.6% for AGIs $25k-50k, 2.4% for AGIs $50k-75k, 1.5% for AGIs $75k-100k, 2.1% for AGIs $100k-200k, 3.5% for AGIs over 200k)
Taxable individual retirement arrangement distribution: $18,450 (reported on 13.5% of returns)
98370:
$18,450
Washington:
$18,648
(% of AGI for various income ranges: 3.9% for AGIs below $25k, 3.0% for AGIs $25k-50k, 3.4% for AGIs $50k-75k, 3.6% for AGIs $75k-100k, 3.5% for AGIs $100k-200k, 4.1% for AGIs over 200k)
Self-employment retirement plans: $19,011 (reported on 0.7% of returns)
98370:
$19,011
Washington:
$20,087
(% of AGI for various income ranges: 0.2% for AGIs $25k-50k, 0.1% for AGIs $100k-200k, 0.6% for AGIs over 200k)
Total itemized deductions: $22,678 (21% of AGI, reported on 43.2% of returns)
Here:
$22,678
State:
$23,872
Here:
21.3% of AGI
State:
18.2% of AGI
(% of AGI for various income ranges: 17.0% for AGIs below $25k, 15.1% for AGIs $25k-50k, 15.4% for AGIs $50k-75k, 15.7% for AGIs $75k-100k, 14.5% for AGIs $100k-200k, 10.3% for AGIs over 200k)
Charity contributions: $3,879 (reported on 35.3% of returns)
Here:
$3,879
State:
$4,465
(% of AGI for various income ranges: 0.9% for AGIs below $25k, 1.3% for AGIs $25k-50k, 1.5% for AGIs $50k-75k, 1.6% for AGIs $75k-100k, 2.1% for AGIs $100k-200k, 3.1% for AGIs over 200k)
Taxes paid: $5,834 (reported on 42.8% of returns)
98370:
$5,834
State:
$6,400
(% of AGI for various income ranges: 3.3% for AGIs below $25k, 3.4% for AGIs $25k-50k, 3.8% for AGIs $50k-75k, 4.0% for AGIs $75k-100k, 4.0% for AGIs $100k-200k, 2.7% for AGIs over 200k)
Earned income credit: $1,968 (reported on 9.9% of returns)
Here:
$1,968
State:
$2,073
(% of AGI for various income ranges: 4.0% for AGIs below $25k, 0.8% for AGIs $25k-50k)
Percentage of individuals using paid preparers for their 2012 taxes: 38.7%
Here:
39%
State:
43%
(% for various income ranges: 29.5% for AGIs below $25k, 38.5% for AGIs $25k-50k, 41.3% for AGIs $50k-75k, 42.0% for AGIs $75k-100k, 42.6% for AGIs $100k-200k, 73.3% for AGIs over 200k)
Averages for the 2004 tax year for zip code 98370, filed in 2005:
Average Adjusted Gross Income (AGI) in 2004: $58,527 (Individual Income Tax Returns)
Here:
$58,527
State:
$54,331
Salary/wage: $48,885 (reported on 79.5% of returns)
Here:
$48,885
State:
$45,761
(% of AGI for various income ranges: 156.1% for AGIs below $10k, 66.9% for AGIs $10k-25k, 70.1% for AGIs $25k-50k, 76.6% for AGIs $50k-75k, 78.2% for AGIs $75k-100k, 53.9% for AGIs over 100k)
Taxable interest for individuals: $1,809 (reported on 55.0% of returns)
This zip code:
$1,809
Washington:
$2,110
(% of AGI for various income ranges: 11.1% for AGIs below $10k, 3.2% for AGIs $10k-25k, 2.0% for AGIs $25k-50k, 1.3% for AGIs $50k-75k, 1.2% for AGIs $75k-100k, 1.6% for AGIs over 100k)
Taxable dividends: $5,437 (reported on 31.9% of returns)
Here:
$5,437
State:
$5,879
(% of AGI for various income ranges: 8.3% for AGIs below $10k, 2.4% for AGIs $10k-25k, 1.7% for AGIs $25k-50k, 1.6% for AGIs $50k-75k, 1.1% for AGIs $75k-100k, 4.7% for AGIs over 100k)
Net capital gain/loss: +$10,343 (reported on 26.8% of returns)
Here:
+$10,343
State:
+$15,835
(% of AGI for various income ranges: -2.5% for AGIs below $10k, 0.2% for AGIs $10k-25k, 0.8% for AGIs $25k-50k, 1.1% for AGIs $50k-75k, 1.6% for AGIs $75k-100k, 9.7% for AGIs over 100k)
Profit/loss from business: +$14,155 (reported on 15.2% of returns)
Here:
+$14,155
State:
+$13,994
(% of AGI for various income ranges: -16.5% for AGIs below $10k, 6.4% for AGIs $10k-25k, 3.8% for AGIs $25k-50k, 2.6% for AGIs $50k-75k, 3.1% for AGIs $75k-100k, 4.4% for AGIs over 100k)
IRA payment deduction: $3,117 (reported on 3.5% of returns)
98370:
$3,117
Washington:
$3,001
(% of AGI for various income ranges: 0.5% for AGIs below $10k, 0.2% for AGIs $10k-25k, 0.3% for AGIs $25k-50k, 0.3% for AGIs $50k-75k, 0.2% for AGIs $75k-100k, 0.1% for AGIs over 100k)
Self-employed pension: $13,270 (reported on 1.2% of returns)
Here:
$13,270
Washington:
$14,244
(% of AGI for various income ranges: 0.1% for AGIs $25k-50k, 0.1% for AGIs $50k-75k, 0.2% for AGIs $75k-100k, 0.5% for AGIs over 100k)
Total itemized deductions: $19,655 (22% of AGI, reported on 46.5% of returns)
Here:
$19,655
State:
$19,669
Here:
22.0% of AGI
State:
20.7% of AGI
(% of AGI for various income ranges: 32.8% for AGIs below $10k, 17.6% for AGIs $10k-25k, 16.5% for AGIs $25k-50k, 17.7% for AGIs $50k-75k, 16.6% for AGIs $75k-100k, 13.4% for AGIs over 100k)
Charity contributions deductions: $3,116 (3% of AGI, reported on 40.4% of returns)
Here:
$3,116
State:
$3,569
Here:
3.3% of AGI
State:
3.5% of AGI
(% of AGI for various income ranges: 1.4% for AGIs below $10k, 1.5% for AGIs $10k-25k, 1.5% for AGIs $25k-50k, 1.7% for AGIs $50k-75k, 2.0% for AGIs $75k-100k, 2.7% for AGIs over 100k)
Total tax: $8,515 (reported on 81.2% of returns)
98370:
$8,515
State:
$9,065
(% of AGI for various income ranges: 4.3% for AGIs below $10k, 4.7% for AGIs $10k-25k, 6.9% for AGIs $25k-50k, 8.6% for AGIs $50k-75k, 10.3% for AGIs $75k-100k, 16.6% for AGIs over 100k)
Earned income credit: $1,471 (reported on 8.4% of returns)
Here:
$1,471
State:
$1,607
Percentage of individuals using paid preparers for their 2004 taxes: 46.9%
Here:
47%
State:
49%
(% for various income ranges: 37.6% for AGIs below $10k, 46.9% for AGIs $10k-25k, 50.6% for AGIs $25k-50k, 47.3% for AGIs $50k-75k, 43.5% for AGIs $75k-100k, 54.2% for AGIs over 100k)
Likely homosexual households (counted as self-reported same-sex unmarried-partner households)
Lesbian couples: 0.0% of all households
Gay men: 0.2% of all households
Household received Food Stamps/SNAP in the past 12 months: 1,097 Household did not receive Food Stamps/SNAP in the past 12 months: 12,462
Women who had a birth in the past 12 months: 401 (413 now married, 0 unmarried) Women who did not have a birth in the past 12 months: 6,325 (3,134 now married, 3,181 unmarried)
Housing units in zip code 98370 with a mortgage: 7,143 (632 second mortgage, 137 home equity loan, 443 both second mortgage and home equity loan) Houses without a mortgage: 220
Median monthly owner costs for units with a mortgage: $2,228 Median monthly owner costs for units without a mortgage: $702
Residents with income below the poverty level in 2022:
This zip code:
6.3%
Whole state:
10.0%
Residents with income below 50% of the poverty level in 2022:
This zip code:
3.0%
Whole state:
4.6%
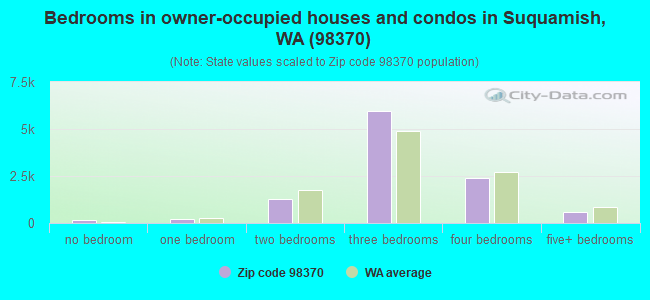
Median number of rooms in houses and condos:
Here:
6.8
State:
6.5
Median number of rooms in apartments:
Here:
4.1
State:
3.9
Notable locations in this zip code not listed on our city pages
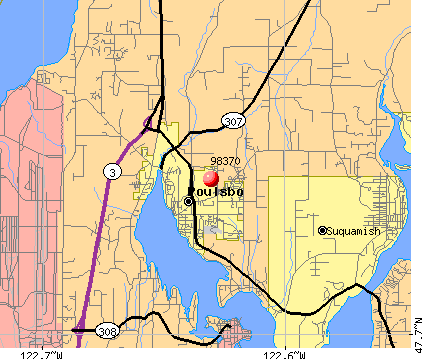
Notable locations in zip code 98370: Agate Pass Park and Ride West (A), Port of Brownsville (B), Port of Poulsbo (C), Sandy Hook Park (D), Bay Marina (E), Liberty Bay Marina (F), Poulsbo Yacht Club (G), Kitsap County Central Kitsap Wastewater Treatment Plant (H), Naval Region Northwest Fire and Emergency Services (I), Kitsap Fire District 18 Poulsbo Fire Department Station 77 - Pioneer Hill (J), Central Kitsap Fire and Rescue Station 42 - Island Lake (K), Kitsap Fire District 18 Poulsbo Fire Department Station 72 Surfrest (L), Kitsap Fire District 18 Poulsbo Fire Department Station 73 Keyport (M), Island Lake Community Center (N), Liberty Shores Assisted Living Facility (O), Montclair Park Assisted Living and Memory Care Community (P), Poulsbo Police Department (Q), Poulsbo Fire Department (R), Poulsbo City Hall (S), Poulsbo Municipal Court (T). Display/hide their locations on the map
Churches in zip code 98370 include: Vinland Church (A), Cornerstone Alliance Church (B), Breidablik Baptist Church (C), Poulsbo Seventh Day Adventist Church (D), Christ Memorial Church (E), North Kitsap Baptist Church (F), North Point Church (G), Olympic Evangelical Free Church (H), First Lutheran Church of Poulsbo (I). Display/hide their locations on the map
Cemeteries: Vinland Lutheran Church Cemetery (1), First Lutheran Church Cemetery (2), Buena Vista Cemetery (3), Breidablik Chapel Cemetery (4), Poulsbo Cemetery (5). Display/hide their locations on the map
4,928 married couples with children.
819 single-parent households (167 men, 652 women).
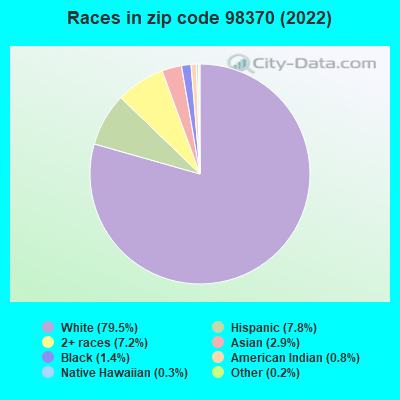
93.2% of residents of 98370 zip code speak English at home.
3.2% of residents speak Spanish at home (69% very well, 23% well, 7% not well, 1% not at all).
1.2% of residents speak other Indo-European language at home (88% very well, 9% well, 2% not well).
1.4% of residents speak Asian or Pacific Island language at home (58% very well, 39% well, 3% not well).
0.6% of residents speak other language at home (48% very well, 52% well).
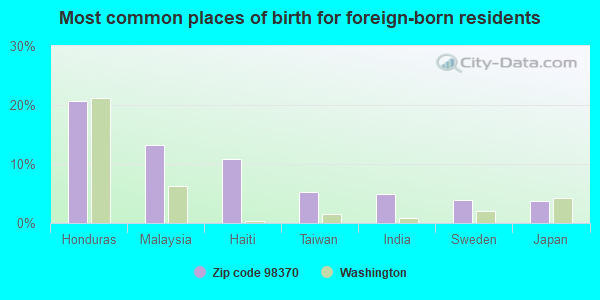
Foreign born population: 1,899 (5.7%) (72.0% of them are naturalized citizens)
Facilities with environmental interests located in this zip code:
CHEVRON BULK PLANT POULSBO (18218 FJORD DR NE in POULSBO, WA)
(Resource Conservation and Recovery Act (tracking hazardous waste)) STATE MASTER (Washington State Department of Ecology's Facility/Site identification system) - TOXICS-, INDEPENDENT CLEANUP, TOXICS CLEANUP, TOXICS-200091, LEAKING STORAGE TANK, UNDERGROUND STORAGE TANK PROGRAM Business SIC classification: PETROLEUM BULK STATIONS AND TERMINALS; NONCLASSIFIABLE ESTABLISHMENTS Organizations: CHEVRON PRODUCTS CO (CONTACT/ HAZARDOUS WASTE)
, UNOCAL (CONTACT/OPERATOR)
Alternative names: Anderson Property
CENTRAL KITSAP WWTP (12330 HWY 303 NE in POULSBO, WA)
Conditionally Exempt Small Quantity Generators, less than 100 kg/month of hazardous waste (Resource Conservation and Recovery Act (tracking hazardous waste)) STATE MASTER (Washington State Department of Ecology's Facility/Site identification system) - TOXICS-11068, LEAKING STORAGE TANK, UNDERGROUND STORAGE TANK PROGRAM, HAZWASTE-WAD988506291, CESQG Business SIC classification: AIR AND WATER RESOURCE AND SOLID WASTE MANAGEMENT Organizations: WA ECY (CONTACT/ HAZARDOUS WASTE)
, BRIDGETT HOOVER (CONTACT/OPERATOR)
Alternative names: CENTRAL KITSAP WWT PLANT
A& L TOPSOIL (GUNDERSON RD in POULSBO, WA)
National Pollutant Discharge Elimination System NON-MAJOR (Tracking pollutant discharge elimination systems) - permit STATE MASTER (Washington State Department of Ecology's Facility/Site identification system) - WATQUAL-WAG503332, National Pollutant Discharge Elimination System Permit Business SIC classification: CONSTRUCTION SAND AND GRAVEL Organizations: A AND L TOPSOIL (CONTACT/OPERATOR)
National Pollutant Discharge Elimination System NON-MAJOR (Tracking pollutant discharge elimination systems) - permit STATE MASTER (Washington State Department of Ecology's Facility/Site identification system) - WATQUAL-WAG503319, National Pollutant Discharge Elimination System Permit, WATQUAL-, FORMAL ENFORCEMENT ACTION Business SIC classification: CRUSHED AND BROKEN STONE; CONSTRUCTION SAND AND GRAVEL Organizations: ARNESS INC (CONTACT/OPERATOR)
CHEVRON 94265 (18764 HWY 305 in POULSBO, WA)
(Resource Conservation and Recovery Act (tracking hazardous waste)) STATE MASTER (Washington State Department of Ecology's Facility/Site identification system) - TOXICS-5157, LEAKING STORAGE TANK, UNDERGROUND STORAGE TANK PROGRAM, HAZWASTE-WAD988489647, EPCRA, HAZARDOUS WASTE PROGRAM, SQG, TOXICS-NW1321, VOLUNTARY CLEAN UP PROGRAM Business SIC classification: GASOLINE SERVICE STATIONS Organizations: BETH ALLEN (CONTACT/OPERATOR)
, CHEVRON PRODUCTS COMPANY (CONTACT/OWNER)
Alternative names: CHEVRON SS 94265
A & L TOPSOIL INC (23997 MILLER BAY RD NE in POULSBO, WA)
National Pollutant Discharge Elimination System NON-MAJOR (Tracking pollutant discharge elimination systems) - permit STATE MASTER (Washington State Department of Ecology's Facility/Site identification system) - WATQUAL-SO3002723, NPDES STORMWATER PERMIT Business SIC classification: CRUSHED AND BROKEN STONE; MISCELLANEOUS NONMETALLIC MINERALS, EXCEPT FUELS; SAWMILLS AND PLANING MILLS, GENERAL; LUMBER AND OTHER BUILDING MATERIALS DEALERS Organizations: A AND L TOPSOIL (CONTACT/OWNER)
CAMERON ENTERPRISES IV (15244 SILVERDALE WAY NW in POULSBO, WA)
Conditionally Exempt Small Quantity Generators, less than 100 kg/month of hazardous waste (Resource Conservation and Recovery Act (tracking hazardous waste)) STATE MASTER (Washington State Department of Ecology's Facility/Site identification system) - TOXICS-, UNDERGROUND STORAGE TANK PROGRAM, HAZWASTE-WAH000001578, EPCRA, CESQG Business SIC classification: GASOLINE SERVICE STATIONS Organizations: ARCO (CONTACT/OPERATOR)
Alternative names: ARCO 5929 PSI 5465
BREIDABLIK ELEMENTARY (25142 WAGHORN RD NW in POULSBO, WA)
(National Center for Education Statistics) - STATE ID-4358 Organizations: NORTH KITSAP SCH DIST 400 (SCHOOL DISTRICT)
AUTO BODY EXPRESS (3203-A NE TOTTEN ROAD in POULSBO, WA) . Tribal Land
AIR MINOR (AIRS/AFS) Business SIC classification: NONCLASSIFIABLE ESTABLISHMENTS
Housing units lacking complete plumbing facilities: 0.8% Housing units lacking complete kitchen facilities: 1.5%
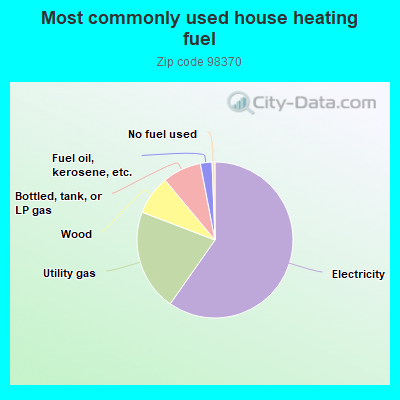
59.5%Electricity
21.0%Utility gas
8.1%Wood
8.0%Bottled, tank, or LP gas
2.4%Fuel oil, kerosene, etc.
0.6%No fuel used
Population in 1990: 20,554. Population change in the 1990s: +4,713 (+22.9%).
Place of birth for U.S.-born residents:
This state: 14,977
Northeast: 1,931
Midwest: 3,314
South: 2,366
West: 7,670
55% of the 98370 zip code residents lived in the same house 5 years ago. Out of people who lived in different houses, 51% lived in this county. Out of people who lived in different counties, 50% lived in Washington.
89% of the 98370 zip code residents lived in the same house 1 year ago. Out of people who lived in different houses, 44% moved from this county. Out of people who lived in different houses, 19% moved from different county within same state. Out of people who lived in different houses, 40% moved from different state. Out of people who lived in different houses, 1% moved from abroad.
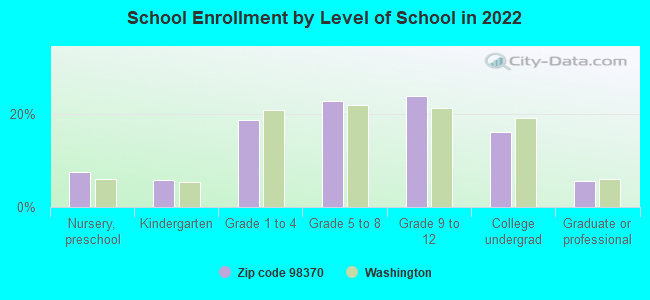
Private vs. public school enrollment:
Students in private schools in grades 1 to 8 (elementary and middle school): 367
Here:
13.2%
Washington:
12.4%
Students in private schools in grades 9 to 12 (high school): 274
Here:
17.0%
Washington:
9.2%
Students in private undergraduate colleges: 62
Here:
5.8%
Washington:
16.5%
Occupation by median earnings in the past 12 months ($)
131,452Computer and mathematical occupations
123,201Law enforcement workers including supervisors
120,250Architecture and engineering occupations
107,775Legal occupations
100,619Management occupations
88,825Health diagnosing and treating practitioners and other technical occupations
Companies with biggest federal contracts located in this zip code (POULSBO, WA):
RAYTHEON COMPANY (1050 NE HOSTMARK STREET) : $223,805,612 in 2235 contractsfrom 1999 to 2006
Contracts for Engineering and Technical Services, Program Management/Support Services, Maintenance, Repair and Rebuilding of Equipment -- Weapons, Degaussing and Mine Sweeping Equipment, and moreby Navy, United States Coast Guard (disused code: now 7008), U.S. Coast Guard, Defense Logistics Agency, and others Signed by year:2000: $23,114,564; 2001: $36,227,220; 2002: $44,056,548; 2003: $54,346,414; 2004: $29,983,913; 2005: $17,929,095; 2006: $12,869,861.
Biggest contracts:
$11,074,546 with Navy for Engineering and Technical Services. Signed on 2001-06-28. Completion date: 2002-05-31.
$10,428,174 with Navy for Program Management/Support Services. Taking place in DC. Signed on 2003-08-19. Completion date: 2005-01-19.
$9,213,593 with Navy for Maintenance, Repair and Rebuilding of Equipment -- Weapons. Taking place in HI. Signed on 2006-04-21. Completion date: 2006-11-15.
$4,334,058 with Navy for Degaussing and Mine Sweeping Equipment. Signed on 2005-01-20. Completion date: 2007-10-20.
GENERAL CONSTRUCTION COMPANY (19472 POWDER HILL PLACE) : $110,003,643 in 81 contractsfrom 2000 to 2006
Contracts for Construction of Structures and Facilities -- Other Non-Building Facilities, Construction of Structures and Facilities -- Dredging, Maintenance, Repair or Alteration of Real Property -- Other Non-Building Facilities, Maintenance, Repair or Alteration of Real Property -- Dredging, and moreby Navy, U.S. Army Corps of Engineers - civil program financing only, Army, United States Coast Guard (disused code: now 7008), and others Signed by year:2000: $33,209,789; 2001: $13,008,843; 2002: $26,221,165; 2003: $32,843,412; 2004: $937,759; 2005: $3,820,268; 2006: -$37,593.
Biggest contracts:
$31,018,000 with Navy for Construction of Structures and Facilities -- Other Non-Building Facilities. Signed on 2003-12-30. Completion date: 2005-04-30.
$26,857,000 with Navy for Construction of Structures and Facilities -- Dredging. Signed on 2000-11-30. Completion date: 2002-09-16.
$21,612,000, same as above.Signed on 2002-01-15. Completion date: 2002-09-16.
$8,745,173 with Navy for Maintenance, Repair or Alteration of Real Property -- Other Non-Building Facilities. Taking place in CA. Signed on 2001-08-21. Completion date: 2003-09-04.
RAYTHEON COMPANY (1050 NE HOSTMARK ST) : $97,307,047 in 4 contractsfrom 2003 to 2005
$54,708,181 with Navy for Logistics Support Services. Signed on 2004-03-09. Completion date: 2005-03-31.
$42,555,739, same as above.Signed on 2005-03-31. Completion date: 2006-03-30.
$26,154 with Navy for Torpedo Maintenance, Repair, and Checkout Specialized Equipment. Signed on 2003-03-04. Completion date: 2003-04-04.
$16,973 with Navy for Ammunition and Nuclear Ordnance Boxes, Packages and Special Containers. Signed on 2005-05-04. Completion date: 2005-06-02.
TETRA TECH FW, INC (1050 NE HOST MARK STE 202) : $6,648,701 in 47 contractsfrom 2003 to 2004
Contracts for Maintenance, Repair or Alteration of Real Property -- Other Non-Building Facilities, Maintenance, Repair or Alteration of Real Property -- Restoration of real property by Navy Signed by year:2000: $0; 2001: $0; 2002: $0; 2003: $19,000; 2004: $6,629,701; 2005: $0; 2006: $0.
Biggest contracts:
$1,153,295 with Navy for Maintenance, Repair or Alteration of Real Property -- Other Non-Building Facilities. Signed on 2004-09-30. Completion date: 2006-04-28.
$969,483, same as above.Signed on 2004-02-26. Completion date: 2005-11-29.
$918,202 with Navy for Maintenance, Repair or Alteration of Real Property -- Other Non-Building Facilities. Taking place in AK. Signed on 2004-02-25. Completion date: 2005-02-08.
$895,376 with Navy for Maintenance, Repair or Alteration of Real Property -- Other Non-Building Facilities. Signed on 2004-05-14. Completion date: 2005-05-13.
WIEDEMANN CONSULTING (28935 BEACH DRIVE NE; small business) : $5,270,022 in 11 contractsfrom 2000 to 2006
Contracts for Lease or Rental of Facilities -- Electronic and Communications Facilities, Systems Engineering Services, Modification of Equipment -- Communication, Detection, and Coherent Radiation Equipment by Air Force Signed by year:2000: $270,000; 2001: $108,000; 2002: $378,925; 2003: $278,358; 2004: $2,450,680; 2005: $1,735,389; 2006: $48,670.
Biggest contracts:
$2,166,687 with Air Force for Lease or Rental of Facilities -- Electronic and Communications Facilities. Signed on 2004-10-01. Completion date: 2005-09-30.
$1,444,012, same as above.Signed on 2005-09-27. Completion date: 2006-09-30.
$292,023 with Air Force for Systems Engineering Services. Signed on 2005-05-17. Completion date: 2006-05-31.
$283,993, same as above.Signed on 2004-05-07. Completion date: 2005-05-31.
FOSTER WHEELER ENVIRONMENTAL C (1050 NE HOSTMARK ST STE 20) : $3,768,428 in 17 contractsfrom 2003 to 2004
Contracts for Maintenance, Repair or Alteration of Real Property -- Other Non-Building Facilities, Maintenance, Repair or Alteration of Real Property -- Restoration of real property by Navy Signed by year:2000: $0; 2001: $0; 2002: $0; 2003: $531,057; 2004: $3,237,371; 2005: $0; 2006: $0.
Biggest contracts:
$2,347,468 with Navy for Maintenance, Repair or Alteration of Real Property -- Other Non-Building Facilities. Signed on 2004-01-23. Completion date: 2004-11-29.
$909,928, same as above.Signed on 2004-02-17. Completion date: 2004-12-18.
$422,874, same as above.Signed on 2004-02-12. Completion date: 2004-06-30.
$398,569, same as above.Signed on 2003-12-02. Completion date: 2003-10-30.
SYSTEMS SOLUTIONS COMPUTER ENG (19689 7TH AVE NE; small business) : $893,192 in 3 contractsin 2000
$576,174 with Navy for Fire Control Designating and Indicating Equipment. Signed on 2000-02-25. Completion date: 2000-06-23.
$192,058, same as above.Signed on 2000-04-13. Completion date: 2000-07-20.
$124,960 with Navy for Invalid code: AC67. Signed on 2000-03-02. Completion date: 2000-09-30.
EVERGREEN COMPUTER SERVICES (11879 CENTRAL VALLEY RD N; small business) : $295,137 in 5 contractsfrom 2000 to 2004
Contracts for Maintenance, Repair and Rebuilding of Equipment -- Automatic Data Processing Equipment (Including Firmware), Software, Supplies and Support Equipment, Miscellaneous Items by Navy Signed by year:2000: $68,253; 2001: $89,500; 2002: $78,000; 2003: $54,816; 2004: $4,568; 2005: $0; 2006: $0.
Biggest contracts:
$89,500 with Navy for Maintenance, Repair and Rebuilding of Equipment -- Automatic Data Processing Equipment (Including Firmware), Software, Supplies and Support Equipment. Signed on 2001-10-01. Completion date: 2002-09-30.
$78,000, same as above.Signed on 2002-10-01. Completion date: 2003-09-30.
$68,253, same as above.Signed on 2000-10-01. Completion date: 2001-09-30.
$54,816 with Navy for Miscellaneous Items. Signed on 2003-10-01. Completion date: 2004-09-30.
PUBLIC UTILITY DIST #1 OF KITS (1431 NW FINN HILL ROAD) : $143,303 in 3 contractsfrom 2001 to 2004
$57,200 with Navy for Industrial Investigation Surveys and Technical Support Related to Water Pollution. Signed on 2003-04-16. Completion date: 2003-09-30.
$44,103 with Navy for Maintenance, Repair or Alteration of Real Property -- Water Supply Facilities. Signed on 2004-02-04. Completion date: 2004-04-01.
$42,000 with Navy for Other Special Studies and Analyses. Signed on 2001-09-18. Completion date: 2002-09-30.
NATIVE6 INC (19053 THIRD AVE; small business) : $113,120 in 4 contractsfrom 2004 to 2005
$62,870 with Army for Electronic Modules. Signed on 2005-12-15. Completion date: 2006-12-12.
$20,250 with Army for Educational Services. Signed on 2004-03-17. Completion date: 2004-04-16.
$18,000, same as above.Signed on 2004-01-13. Completion date: 2004-02-20.
$12,000, same as above.Signed on 2004-01-21. Completion date: 2004-02-20.
Top industries in this zip code by the number of employees in 2005:
Health Care and Social Assistance: Nursing Care Facilities (250-499 employees: 1 establishment)
2003 - 2018 National Fire Incident Reporting System (NFIRS) incidents
According to the data from the years 2003 - 2018 the average number of fires per year is 77. The highest number of fire incidents - 154 took place in 2006, and the least - 29 in 2012. The data has a rising trend.
When looking into fire subcategories, the most incidents belonged to: Structure Fires (50.0%), and Outside Fires (33.0%).
Fire incident types reported to NFIRS in Zip Code 98370


 Nearest zip codes: 98345, 98392, 98315, 98364, 98342, 98346.


 According to the data from the years 2003 - 2018 the average number of fires per year is 77. The highest number of fire incidents - 154 took place in 2006, and the least - 29 in 2012. The data has a rising trend.
 When looking into fire subcategories, the most incidents belonged to: Structure Fires (50.0%), and Outside Fires (33.0%).