Estimated zip code population in 2022: 6,913 Zip code population in 2010: 6,133 Zip code population in 2000: 4,483
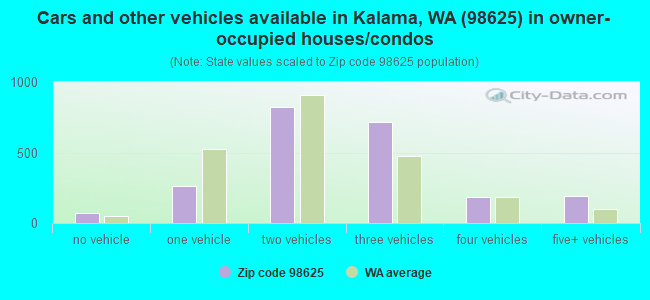
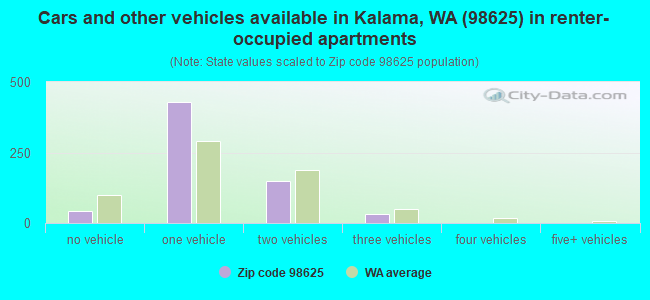
Houses and condos: 3,124 Renter-occupied apartments: 641
% of renters here:
22%
State:
36%
March 2022 cost of living index in zip code 98625: 92.5 (less than average, U.S. average is 100)
Land area: 80.5 sq. mi. Water area: 1.8 sq. mi.
Population density: 86 people per square mile
(very low).
OSM Map
General Map
Google Map
MSN Map
OSM Map
General Map
Google Map
MSN Map
OSM Map
General Map
Google Map
MSN Map
OSM Map
General Map
Google Map
MSN Map
Please wait while loading the map...
Real estate property taxes paid for housing units in 2022:
This zip code:
0.6% ($3,170)
Washington:
0.8% ($4,283)
Median real estate property taxes paid for housing units with mortgages in 2022: $3,516 (0.6%) Median real estate property taxes paid for housing units with no mortgage in 2022: $2,325 (0.7%)
Business Search- 14 Million verified businesses
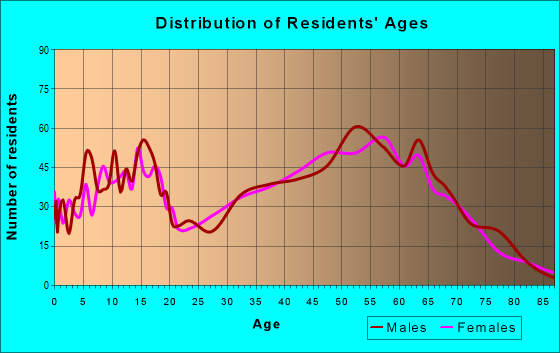
Males: 3,603
(52.1%)
Females: 3,310
(47.9%)
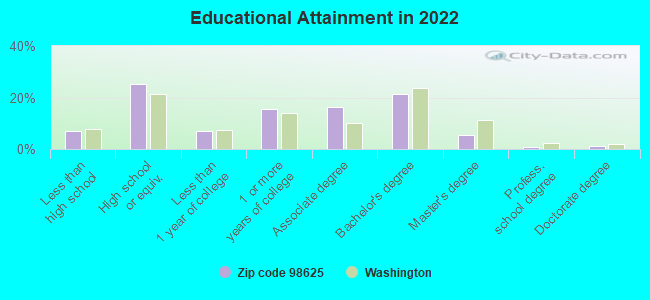
For population 25 years and over in 98625:
High school or higher: 92.4%
Bachelor's degree or higher: 28.7%
Graduate or professional degree: 7.3%
Unemployed: 3.5%
Mean travel time to work (commute): 25.4 minutes
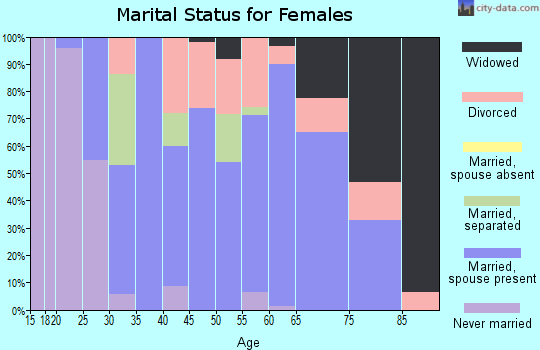
For population 15 years and over in 98625:
Never married: 23.2%
Now married: 59.7%
Separated: 0.6%
Widowed: 7.3%
Divorced: 9.1%
Zip code 98625 compared to state average:
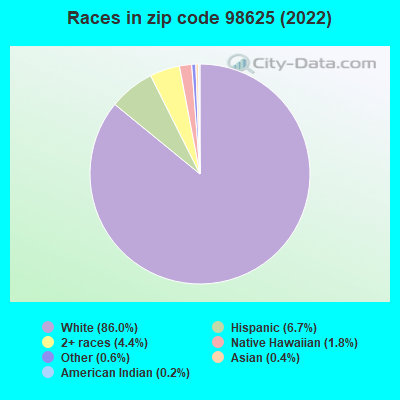
Black race population percentage significantly below state average.
Hispanic race population percentage below state average.
Median age significantly above state average.
Foreign-born population percentage significantly below state average.
Renting percentage below state average.
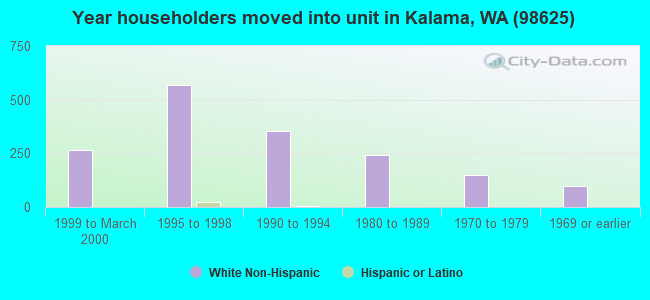
Length of stay since moving in above state average.
Estimated median house/condo value in 2022: $495,395
98625:
$495,395
Washington:
$569,500
According to our research of Washington and other state lists, there was 1 registered sex offender living in 98625 zip code as of April 25, 2024. The ratio of all residents to sex offenders in zip code 98625 is 6,944 to 1. The ratio of registered sex offenders to all residents in this zip code is much lower than the state average.
Median resident age:
This zip code:
51.4 years
Washington median age:
38.4 years
Average household size:
This zip code:
2.4 people
Washington:
2.5 people
Averages for the 2020 tax year for zip code 98625, filed in 2021:
Average Adjusted Gross Income (AGI) in 2020: $91,094 (Individual Income Tax Returns)
Here:
$91,094
State:
$99,264
Salary/wage: $74,237 (reported on 77.5% of returns)
Here:
$74,237
State:
$80,347
(% of AGI for various income ranges: 933.5% for AGIs below $25k, 3134.0% for AGIs $25k-50k, 5927.3% for AGIs $50k-75k, 9172.9% for AGIs $75k-100k, 17581.0% for AGIs $100k-200k, 80840.0% for AGIs over 200k)
Taxable interest for individuals: $1,507 (reported on 38.9% of returns)
This zip code:
$1,507
Washington:
$2,077
(% of AGI for various income ranges: 18.2% for AGIs below $25k, 29.3% for AGIs $25k-50k, 54.1% for AGIs $50k-75k, 67.9% for AGIs $75k-100k, 105.7% for AGIs $100k-200k, 1548.3% for AGIs over 200k)
Ordinary dividends: $6,223 (reported on 17.2% of returns)
Here:
$6,223
State:
$10,013
(% of AGI for various income ranges: 28.2% for AGIs below $25k, 38.8% for AGIs $25k-50k, 71.0% for AGIs $50k-75k, 77.9% for AGIs $75k-100k, 199.2% for AGIs $100k-200k, 3415.0% for AGIs over 200k)
Net capital gain/loss in AGI: +$19,250 (reported on 17.2% of returns)
Here:
+$19,250
State:
+$40,092
(% of AGI for various income ranges: 8.7% for AGIs below $25k, 35.5% for AGIs $25k-50k, 83.4% for AGIs $50k-75k, 42.4% for AGIs $75k-100k, 541.0% for AGIs $100k-200k, 14863.3% for AGIs over 200k)
Profit/loss from business: +$13,955 (reported on 12.6% of returns)
Here:
+$13,955
State:
+$18,312
(% of AGI for various income ranges: 105.2% for AGIs below $25k, 109.2% for AGIs $25k-50k, 90.5% for AGIs $50k-75k, 338.8% for AGIs $75k-100k, 417.3% for AGIs $100k-200k, 2841.7% for AGIs over 200k)
Taxable individual retirement arrangement distribution: $27,180 (reported on 11.8% of returns)
98625:
$27,180
Washington:
$24,221
(% of AGI for various income ranges: 95.3% for AGIs below $25k, 168.7% for AGIs $25k-50k, 258.0% for AGIs $50k-75k, 515.9% for AGIs $75k-100k, 1062.9% for AGIs $100k-200k, 3925.0% for AGIs over 200k)
Total itemized deductions: $32,329 (reported on 11.3% of returns)
Here:
$32,329
State:
$39,068
(% of AGI for various income ranges: 248.7% for AGIs $25k-50k, 470.7% for AGIs $50k-75k, 594.7% for AGIs $75k-100k, 868.2% for AGIs $100k-200k, 6466.7% for AGIs over 200k)
Charity contributions: $6,125 (reported on 7.5% of returns)
Here:
$6,125
State:
$15,331
(% of AGI for various income ranges: 15.3% for AGIs $25k-50k, 30.7% for AGIs $50k-75k, 68.8% for AGIs $75k-100k, 146.9% for AGIs $100k-200k, 905.0% for AGIs over 200k)
Taxes paid: $6,656 (reported on 11.0% of returns)
98625:
$6,656
State:
$7,774
(% of AGI for various income ranges: 33.7% for AGIs $25k-50k, 96.8% for AGIs $50k-75k, 135.9% for AGIs $75k-100k, 201.2% for AGIs $100k-200k, 1136.7% for AGIs over 200k)
Earned income credit: $1,991 (reported on 8.8% of returns)
Here:
$1,991
State:
$2,020
(% of AGI for various income ranges: 66.2% for AGIs below $25k, 43.3% for AGIs $25k-50k)
Percentage of individuals using paid preparers for their 2020 taxes: 91.4%
Here:
91%
State:
93%
(% for various income ranges: 89.2% for AGIs below $25k, 90.9% for AGIs $25k-50k, 89.7% for AGIs $50k-75k, 89.8% for AGIs $75k-100k, 95.2% for AGIs $100k-200k, 95.5% for AGIs over 200k)
Averages for the 2012 tax year for zip code 98625, filed in 2013:
Average Adjusted Gross Income (AGI) in 2012: $62,920 (Individual Income Tax Returns)
Here:
$62,920
State:
$69,533
Salary/wage: $53,703 (reported on 81.4% of returns)
Here:
$53,703
State:
$57,267
(% of AGI for various income ranges: 68.6% for AGIs below $25k, 70.0% for AGIs $25k-50k, 71.5% for AGIs $50k-75k, 76.8% for AGIs $75k-100k, 77.1% for AGIs $100k-200k, 42.8% for AGIs over 200k)
Taxable interest for individuals: $1,405 (reported on 40.4% of returns)
This zip code:
$1,405
Washington:
$1,816
(% of AGI for various income ranges: 0.9% for AGIs below $25k, 0.8% for AGIs $25k-50k, 1.1% for AGIs $50k-75k, 0.8% for AGIs $75k-100k, 0.5% for AGIs $100k-200k, 1.6% for AGIs over 200k)
Ordinary dividends: $4,515 (reported on 16.8% of returns)
Here:
$4,515
State:
$8,163
(% of AGI for various income ranges: 1.9% for AGIs below $25k, 0.8% for AGIs $25k-50k, 1.1% for AGIs $50k-75k, 0.8% for AGIs $75k-100k, 1.0% for AGIs $100k-200k, 2.4% for AGIs over 200k)
Net capital gain/loss in AGI: +$14,030 (reported on 14.3% of returns)
Here:
+$14,030
State:
+$21,568
(% of AGI for various income ranges: 0.8% for AGIs $50k-75k, 1.2% for AGIs $75k-100k, 1.3% for AGIs $100k-200k, 16.0% for AGIs over 200k)
Profit/loss from business: +$9,042 (reported on 13.6% of returns)
Here:
+$9,042
State:
+$16,521
(% of AGI for various income ranges: 5.5% for AGIs below $25k, 1.8% for AGIs $25k-50k, 1.6% for AGIs $50k-75k, 1.2% for AGIs $75k-100k, 2.8% for AGIs $100k-200k)
Taxable individual retirement arrangement distribution: $16,814 (reported on 13.2% of returns)
98625:
$16,814
Washington:
$18,648
(% of AGI for various income ranges: 4.1% for AGIs below $25k, 4.3% for AGIs $25k-50k, 4.0% for AGIs $50k-75k, 4.0% for AGIs $75k-100k, 4.3% for AGIs $100k-200k)
Total itemized deductions: $20,907 (21% of AGI, reported on 36.8% of returns)
Here:
$20,907
State:
$23,872
Here:
20.7% of AGI
State:
18.2% of AGI
(% of AGI for various income ranges: 13.2% for AGIs below $25k, 11.7% for AGIs $25k-50k, 12.8% for AGIs $50k-75k, 14.5% for AGIs $75k-100k, 12.7% for AGIs $100k-200k, 8.0% for AGIs over 200k)
Charity contributions: $2,662 (reported on 27.9% of returns)
Here:
$2,662
State:
$4,465
(% of AGI for various income ranges: 0.6% for AGIs below $25k, 0.7% for AGIs $25k-50k, 0.9% for AGIs $50k-75k, 1.9% for AGIs $75k-100k, 1.3% for AGIs $100k-200k, 0.9% for AGIs over 200k)
Taxes paid: $5,100 (reported on 36.1% of returns)
98625:
$5,100
State:
$6,400
(% of AGI for various income ranges: 2.2% for AGIs below $25k, 2.3% for AGIs $25k-50k, 2.6% for AGIs $50k-75k, 3.3% for AGIs $75k-100k, 3.3% for AGIs $100k-200k, 2.7% for AGIs over 200k)
Earned income credit: $2,113 (reported on 13.9% of returns)
Here:
$2,113
State:
$2,073
(% of AGI for various income ranges: 5.4% for AGIs below $25k, 1.0% for AGIs $25k-50k)
Percentage of individuals using paid preparers for their 2012 taxes: 42.1%
Here:
42%
State:
43%
(% for various income ranges: 36.0% for AGIs below $25k, 37.7% for AGIs $25k-50k, 47.7% for AGIs $50k-75k, 44.4% for AGIs $75k-100k, 48.8% for AGIs $100k-200k, 71.4% for AGIs over 200k)
Averages for the 2004 tax year for zip code 98625, filed in 2005:
Average Adjusted Gross Income (AGI) in 2004: $67,975 (Individual Income Tax Returns)
Here:
$67,975
State:
$54,331
Salary/wage: $44,752 (reported on 84.1% of returns)
Here:
$44,752
State:
$45,761
(% of AGI for various income ranges: 124.2% for AGIs below $10k, 69.6% for AGIs $10k-25k, 75.9% for AGIs $25k-50k, 77.2% for AGIs $50k-75k, 84.4% for AGIs $75k-100k, 30.3% for AGIs over 100k)
Taxable interest for individuals: $1,430 (reported on 53.2% of returns)
This zip code:
$1,430
Washington:
$2,110
(% of AGI for various income ranges: 6.9% for AGIs below $10k, 2.5% for AGIs $10k-25k, 1.4% for AGIs $25k-50k, 1.0% for AGIs $50k-75k, 1.1% for AGIs $75k-100k, 0.8% for AGIs over 100k)
Taxable dividends: $2,359 (reported on 19.0% of returns)
Here:
$2,359
State:
$5,879
(% of AGI for various income ranges: 2.3% for AGIs below $10k, 1.0% for AGIs $10k-25k, 1.2% for AGIs $25k-50k, 0.6% for AGIs $50k-75k, 0.7% for AGIs $75k-100k, 0.5% for AGIs over 100k)
Net capital gain/loss: +$23,796 (reported on 19.2% of returns)
Here:
+$23,796
State:
+$15,835
(% of AGI for various income ranges: -1.9% for AGIs below $10k, -0.1% for AGIs $10k-25k, 1.4% for AGIs $25k-50k, 1.5% for AGIs $50k-75k, 2.2% for AGIs $75k-100k, 12.2% for AGIs over 100k)
Profit/loss from business: +$8,914 (reported on 15.6% of returns)
Here:
+$8,914
State:
+$13,994
(% of AGI for various income ranges: -3.0% for AGIs below $10k, 5.5% for AGIs $10k-25k, 2.2% for AGIs $25k-50k, 3.1% for AGIs $50k-75k, 2.7% for AGIs $75k-100k, 1.2% for AGIs over 100k)
IRA payment deduction: $3,145 (reported on 2.5% of returns)
98625:
$3,145
Washington:
$3,001
Self-employed pension: $11,071 (reported on 0.6% of returns)
Here:
$11,071
Washington:
$14,244
Total itemized deductions: $19,143 (17% of AGI, reported on 40.3% of returns)
Here:
$19,143
State:
$19,669
Here:
16.7% of AGI
State:
20.7% of AGI
(% of AGI for various income ranges: 18.2% for AGIs below $10k, 13.8% for AGIs $10k-25k, 13.1% for AGIs $25k-50k, 14.8% for AGIs $50k-75k, 15.4% for AGIs $75k-100k, 8.0% for AGIs over 100k)
Charity contributions deductions: $2,846 (3% of AGI, reported on 33.1% of returns)
Here:
$2,846
State:
$3,569
Here:
2.9% of AGI
State:
3.5% of AGI
(% of AGI for various income ranges: 1.3% for AGIs below $10k, 1.2% for AGIs $10k-25k, 0.9% for AGIs $25k-50k, 1.9% for AGIs $50k-75k, 1.4% for AGIs $75k-100k, 1.4% for AGIs over 100k)
Total tax: $8,302 (reported on 78.6% of returns)
98625:
$8,302
State:
$9,065
(% of AGI for various income ranges: 2.5% for AGIs below $10k, 3.9% for AGIs $10k-25k, 6.4% for AGIs $25k-50k, 8.6% for AGIs $50k-75k, 10.2% for AGIs $75k-100k, 11.3% for AGIs over 100k)
Earned income credit: $1,566 (reported on 11.8% of returns)
Here:
$1,566
State:
$1,607
Percentage of individuals using paid preparers for their 2004 taxes: 47.0%
Here:
47%
State:
49%
(% for various income ranges: 31.9% for AGIs below $10k, 42.3% for AGIs $10k-25k, 48.1% for AGIs $25k-50k, 52.0% for AGIs $50k-75k, 48.9% for AGIs $75k-100k, 65.7% for AGIs over 100k)
Household received Food Stamps/SNAP in the past 12 months: 223 Household did not receive Food Stamps/SNAP in the past 12 months: 2,674
Women who had a birth in the past 12 months: 72 (54 now married, 17 unmarried) Women who did not have a birth in the past 12 months: 1,118 (543 now married, 573 unmarried)
Housing units in zip code 98625 with a mortgage: 1,602 (100 second mortgage, 103 both second mortgage and home equity loan) Houses without a mortgage: 25
Median monthly owner costs for units with a mortgage: $1,943 Median monthly owner costs for units without a mortgage: $459
Residents with income below the poverty level in 2022:
This zip code:
8.1%
Whole state:
10.0%
Residents with income below 50% of the poverty level in 2022:
This zip code:
3.7%
Whole state:
4.6%
Median number of rooms in houses and condos:
Here:
6.8
State:
6.5
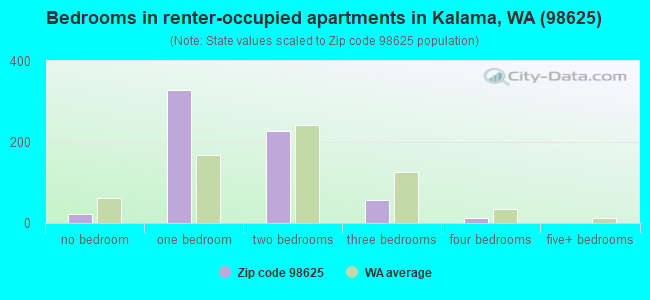
Median number of rooms in apartments:
Here:
2.6
State:
3.9
Notable locations in this zip code not listed on our city pages
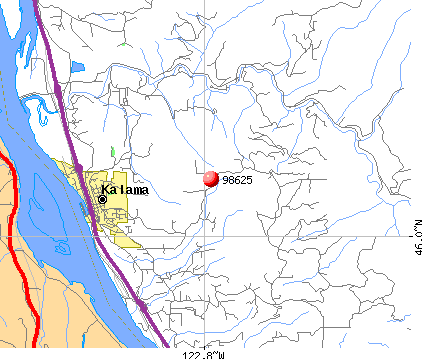
Notable locations in zip code 98625: Cloverdale (A), Kalama Falls Salmon Hatchery (B), Hoffman Landing (C), Port of Kalama Marina (D), Cowlitz County Fire District 5 Station 53 (E), Cowlitz County Fire District 5 Station 52 (F), Cowlitz County Fire District 5 Station 51 (G). Display/hide their locations on the map
Rivers and creeks: Kalama River (A), Arnold Creek (B), Bear Creek (C), Bybee Creek (D), Cedar Creek (E), Gobar Creek (F), Hatchery Creek (G), Indian Creek (H), Italian Creek (I). Display/hide their locations on the map
In group quarters: 1 (-1 institutionalized population)
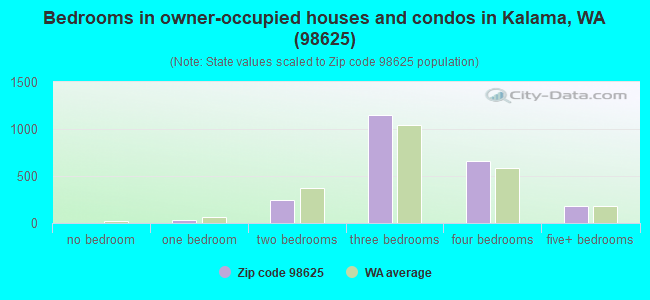
Size of family households: 1,114 2-persons, 362 3-persons, 263 4-persons, 176 5-persons, 35 6-persons, 69 7-or-more-persons
Size of nonfamily households: 654 1-person, 220 2-persons, 5 5-persons
1,027 married couples with children.
166 single-parent households (58 men, 108 women).
92.9% of residents of 98625 zip code speak English at home.
5.6% of residents speak Spanish at home (64% very well, 20% well, 14% not well, 2% not at all).
0.7% of residents speak other Indo-European language at home (38% very well, 62% well).
0.4% of residents speak Asian or Pacific Island language at home (43% well, 57% not well).
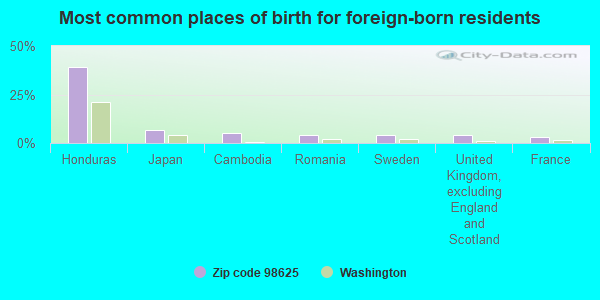
Foreign born population: 414 (6.0%) (58.1% of them are naturalized citizens)
This zip code:
6.0%
Whole state:
15.3%
39%Honduras
7%Japan
5%Cambodia
4%Romania
4%Sweden
4%United Kingdom, excluding England and Scotland
3%France
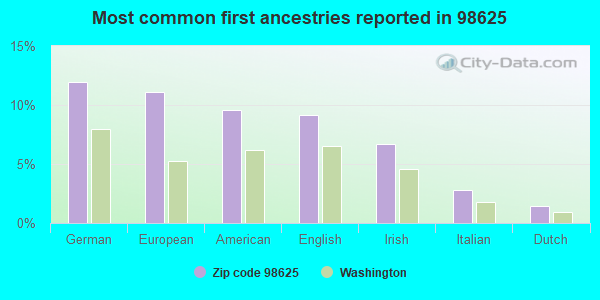
12%German
11%European
10%American
9%English
7%Irish
3%Italian
1%Dutch
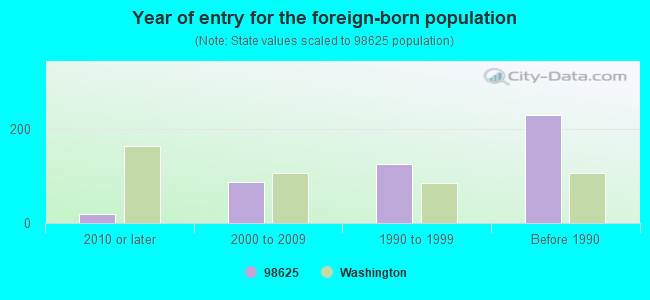
Year of entry for the foreign-born population
192010 or later
882000 to 2009
1271990 to 1999
231Before 1990
Facilities with environmental interests located in this zip code:
CHEMTRADE LOGISTICS INC (404 HENDRICKSON DRIVE in KALAMA, WA)
ENFORCEMENT/COMPLIANCE ACTIVITY (Integrated Compliance Information System) CRITERIA AND HAZARDOUS AIR POLLUTANT INVENTORY (Inventory of air pollution sources) National Pollutant Discharge Elimination System NON-MAJOR (Tracking pollutant discharge elimination systems) - permit National Pollutant Discharge Elimination System NON-MAJOR (Tracking pollutant discharge elimination systems) - permit Large Quantity Generators, more that 1000 kg of hazardous waste/month (Resource Conservation and Recovery Act (tracking hazardous waste)) TRI REPORTER (Tracking of toxic chemicals releasing facilities) STATE MASTER (Washington State Department of Ecology's Facility/Site identification system) - WATQUAL-SO3005585, NPDES STORMWATER PERMIT, TOXICS-SW0492, VOLUNTARY CLEAN UP PROGRAM, WATQUAL-WA0000353, NPDES NON-MAJOR, HAZWASTE-WAD047082060, EPCRA, TRI REPORTER, HAZARDOUS WASTE PROGRAM, Business SIC classification: MALT BEVERAGES; INDUSTRIAL INORGANIC CHEMICALS Organizations: CHEMTRADE PERFORMANCE CHEMICAL (CONTACT/OPERATOR)
Alternative names: CHEMTRADE PERFOMANCE CHEMICALS L.L.C., CHEMTRADE PERFOMANCE CHEMICALS LLC, CHEMTRADE PERFORMANCE CHEMICAL, CLARIANT CORP, CLARIANT CORP, HOECHST CELANESE
ALL PURE CHEMICAL (1285 NW 3RD AVENUE in KALAMA, WA)
COMPLIANCE ACTIVITY (Tracking inspections of insecticide, fungicide, and rodenticide, and toxic substances) (Resource Conservation and Recovery Act (tracking hazardous waste)) TRI REPORTER (Tracking of toxic chemicals releasing facilities) STATE MASTER (Washington State Department of Ecology's Facility/Site identification system) - HAZWASTE-, TRI REPORTER, HAZWASTE-WAH000006023, EPCRA, HAZARDOUS WASTE PROGRAM, SQG Business SIC classification: ALKALIES AND CHLORINE; INDUSTRIAL GASES; SPECIALTY CLEANING, POLISHING, AND SANITATION PREPARATIONS Business NAICS classification: ALKALIES AND CHLORINE MANUFACTURING.; ALKALIES AND CHLORINE MANUFACTURING. Organizations: ALL PURE CHEMICAL CO (CONTACT/OPERATOR)
Alternative names: ALL PURE CHEMICAL CO KALAMA, ALL PURE CHEMICAL CO
ARCH WOOD PROTECTION INCORPORATED (532 HENDRICKSON DRIVE in KALAMA, WA)
ENFORCEMENT/COMPLIANCE ACTIVITY (Integrated Compliance Information System) COMPLIANCE ACTIVITY (Tracking inspections of insecticide, fungicide, and rodenticide, and toxic substances) HAZARDOUS WASTE BIENNIAL REPORTER (Resource Conservation and Recovery Act (tracking hazardous waste)) Large Quantity Generators, more that 1000 kg of hazardous waste/month (Resource Conservation and Recovery Act (tracking hazardous waste)) STATE MASTER (Washington State Department of Ecology's Facility/Site identification system) - HAZWASTE-WAD982653313, EPCRA, HAZARDOUS WASTE PROGRAM, LQG, WATQUAL-SO3000125, NPDES STORMWATER PERMIT Business SIC classification: INDUSTRIAL INORGANIC CHEMICALS; PESTICIDES AND AGRICULTURAL CHEMICALS Alternative names: HICKSON CORP, HICKSON CORP KALAMA
COLUMBIA FIBER LTD LONGVW FIBER YD (1253 NW 3RD ST in KALAMA, WA)
National Pollutant Discharge Elimination System NON-MAJOR (Tracking pollutant discharge elimination systems) - permit STATE MASTER (Washington State Department of Ecology's Facility/Site identification system) - TOXICS-101719, LEAKING STORAGE TANK, UNDERGROUND STORAGE TANK PROGRAM, WATQUAL-SO3002102, NPDES STORMWATER PERMIT Business SIC classification: SAWMILLS AND PLANING MILLS, GENERAL Organizations: COLUMBIA FIBRE LTD (CONTACT/OPERATOR)
Alternative names: COLUMBIA FIBRE LTD, COLUMBIA FIBRE LTD LONGVW FIBER YD
CALGON CORP (PO BOX 900 in KALAMA, WA)
COMPLIANCE ACTIVITY (Tracking inspections of insecticide, fungicide, and rodenticide, and toxic substances)
Housing units lacking complete plumbing facilities: 2.9% Housing units lacking complete kitchen facilities: 1.9%
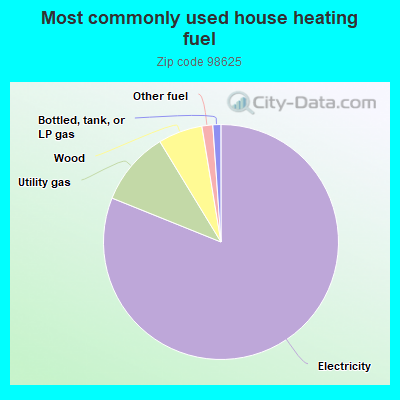
81.1%Electricity
10.2%Utility gas
6.1%Wood
1.5%Other fuel
1.1%Bottled, tank, or LP gas
Population in 1990: 3,627. Population change in the 1990s: +856 (+23.6%).
Place of birth for U.S.-born residents:
This state: 2,438
Northeast: 460
Midwest: 681
South: 134
West: 2,692
58% of the 98625 zip code residents lived in the same house 5 years ago. Out of people who lived in different houses, 56% lived in this county. Out of people who lived in different counties, 50% lived in Washington.
93% of the 98625 zip code residents lived in the same house 1 year ago. Out of people who lived in different houses, 54% moved from this county. Out of people who lived in different houses, 10% moved from different county within same state. Out of people who lived in different houses, 43% moved from different state.
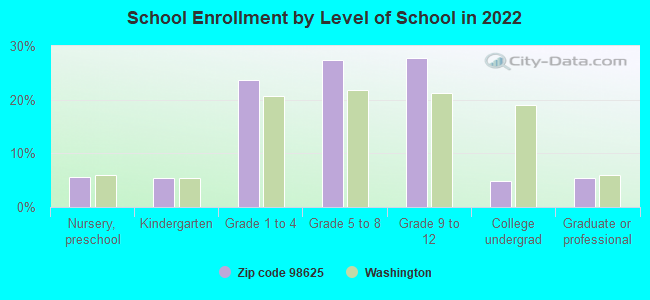
Private vs. public school enrollment:
Students in private schools in grades 1 to 8 (elementary and middle school): 85
Here:
14.0%
Washington:
12.4%
Students in private schools in grades 9 to 12 (high school):
Here:
0.0%
Washington:
9.2%
Students in private undergraduate colleges: 15
Here:
26.4%
Washington:
16.5%
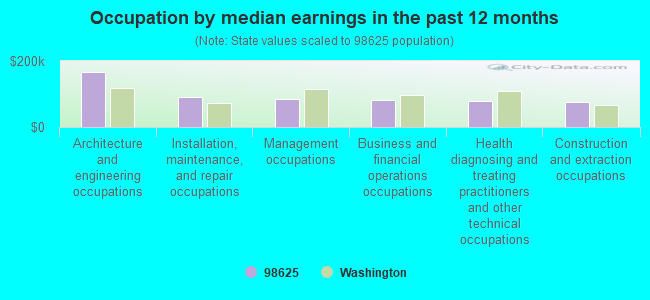
Occupation by median earnings in the past 12 months ($)
167,103Architecture and engineering occupations
92,278Installation, maintenance, and repair occupations
84,925Management occupations
81,540Business and financial operations occupations
79,208Health diagnosing and treating practitioners and other technical occupations
74,966Construction and extraction occupations
Companies with federal contracts located in this zip code:
APPLIED MECHNICAL TECHNOLOGY, (110 W. MARINE DR. in KALAMA, WA; small business)
$74,300 with U.S. Army Corps of Engineers - civil program financing only for Maintenance, Repair or Alteration of Real Property -- Dams. Taking place in OR. Signed on 2000-08-02. Completion date: 2000-09-26.
RUBY, JEANNE (308 TODD RD in KALAMA, WA; small business) : $26,500 in 9 contractsfrom 2003 to 2005
Contracts for Custodial Janitorial Services, Facilities Operations Support Services by U.S. Army Corps of Engineers - civil program financing only, Army Signed by year:2000: $0; 2001: $0; 2002: $0; 2003: $12,090; 2004: $0; 2005: $14,410; 2006: $0.
Biggest contracts:
$11,450 with U.S. Army Corps of Engineers - civil program financing only for Custodial Janitorial Services. Taking place in IA. Signed on 2003-01-30. Completion date: 2004-03-31.
$6,765 with U.S. Army Corps of Engineers - civil program financing only for Facilities Operations Support Services. Taking place in NE. Signed on 2005-01-21. Completion date: 2005-09-30.
$6,765 with Army for Facilities Operations Support Services. Taking place in NE. Signed on 2005-01-21. Completion date: 2005-09-30.
$880, same as above.Signed on 2005-10-13. Completion date: 2005-09-30.
Top industries in this zip code by the number of employees in 2005:
Wholesale Trade: Grain and Field Bean Merchant Wholesalers (50-99 employees: 1 establishment, 1-4 employees: 1 establishment)
Accommodation and Food Services: Full-Service Restaurants (10-19: 2, 5-9: 1)
Construction: New Single-Family Housing Construction (except Operative Builders) (10-19: 1, 5-9: 1, 1-4: 6)
Fatal accident statistics in 2014:
Fatal accident count: 1
Vehicles involved in fatal accidents: 1
Fatal accidents caused by drunken drivers: 0
Fatalities: 1
Persons involved in fatal accidents: 1
Pedestrians involved in fatal accidents: 1
Fatal accident statistics in 2012:
Fatal accident count: 1
Vehicles involved in fatal accidents: 1
Fatal accidents caused by drunken drivers: 1
Fatalities: 1
Persons involved in fatal accidents: 2
Pedestrians involved in fatal accidents: 0
Home Mortgage Disclosure Act Aggregated Statistics For Year 2009 (Based on 4 partial tracts)
A) FHA, FSA/RHS & VA Home Purchase Loans
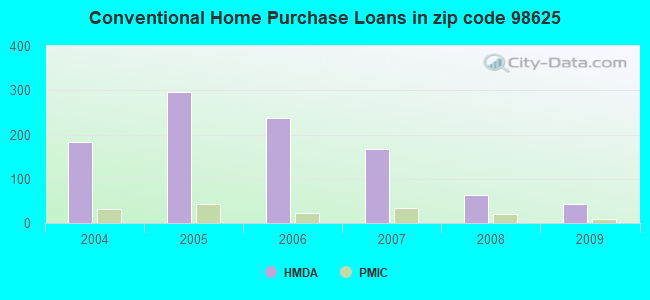
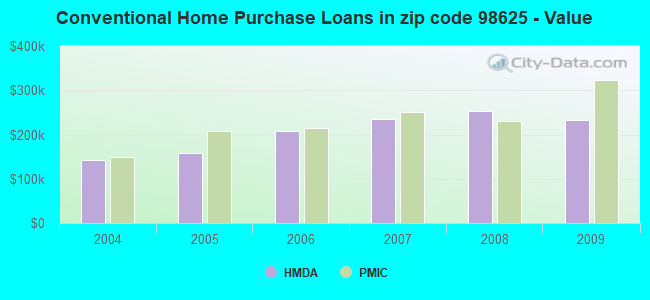
B) Conventional Home Purchase Loans
C) Refinancings
D) Home Improvement Loans
F) Non-occupant Loans on < 5 Family Dwellings (A B C & D)
G) Loans On Manufactured Home Dwelling (A B C & D)
Number
Average Value
Number
Average Value
Number
Average Value
Number
Average Value
Number
Average Value
Number
Average Value
LOANS ORIGINATED
51
$193,676
44
$233,197
386
$205,669
15
$119,119
13
$219,997
74
$156,892
APPLICATIONS APPROVED, NOT ACCEPTED
0
$0
7
$222,726
44
$251,138
3
$75,650
5
$170,380
3
$100,870
APPLICATIONS DENIED
3
$117,863
23
$252,840
169
$232,541
7
$69,779
12
$190,362
39
$103,315
APPLICATIONS WITHDRAWN
10
$206,562
8
$161,171
130
$214,380
5
$157,224
8
$184,606
18
$153,770
FILES CLOSED FOR INCOMPLETENESS
3
$195,707
7
$215,913
12
$278,760
2
$31,245
0
$0
5
$74,336
Aggregated Statistics For Year 2008 (Based on 2 partial tracts)
A) FHA, FSA/RHS & VA Home Purchase Loans
B) Conventional Home Purchase Loans
C) Refinancings
D) Home Improvement Loans
F) Non-occupant Loans on < 5 Family Dwellings (A B C & D)
G) Loans On Manufactured Home Dwelling (A B C & D)
Number
Average Value
Number
Average Value
Number
Average Value
Number
Average Value
Number
Average Value
Number
Average Value
LOANS ORIGINATED
31
$232,844
64
$252,523
265
$207,915
46
$81,014
28
$181,317
72
$164,643
APPLICATIONS APPROVED, NOT ACCEPTED
8
$210,098
8
$295,822
58
$209,970
7
$59,206
7
$243,166
12
$159,938
APPLICATIONS DENIED
5
$196,694
30
$266,370
211
$227,991
25
$112,885
12
$232,300
33
$123,544
APPLICATIONS WITHDRAWN
2
$196,530
20
$264,287
94
$196,337
5
$208,206
16
$226,544
13
$145,484
FILES CLOSED FOR INCOMPLETENESS
0
$0
5
$250,966
12
$259,024
2
$41,115
3
$400,733
0
$0
Aggregated Statistics For Year 2007 (Based on 4 partial tracts)
A) FHA, FSA/RHS & VA Home Purchase Loans
B) Conventional Home Purchase Loans
C) Refinancings
D) Home Improvement Loans
F) Non-occupant Loans on < 5 Family Dwellings (A B C & D)
G) Loans On Manufactured Home Dwelling (A B C & D)
Number
Average Value
Number
Average Value
Number
Average Value
Number
Average Value
Number
Average Value
Number
Average Value
LOANS ORIGINATED
10
$146,698
168
$235,119
342
$199,616
61
$73,522
31
$231,252
77
$139,172
APPLICATIONS APPROVED, NOT ACCEPTED
3
$188,580
26
$191,533
86
$231,334
12
$90,864
8
$324,191
23
$153,734
APPLICATIONS DENIED
2
$174,330
43
$202,351
216
$238,876
25
$273,859
25
$278,595
38
$124,024
APPLICATIONS WITHDRAWN
7
$188,894
12
$276,156
84
$226,739
8
$331,388
3
$263,683
15
$118,631
FILES CLOSED FOR INCOMPLETENESS
0
$0
2
$251,625
23
$283,658
5
$163,802
2
$312,475
0
$0
Aggregated Statistics For Year 2006 (Based on 4 partial tracts)
A) FHA, FSA/RHS & VA Home Purchase Loans
B) Conventional Home Purchase Loans
C) Refinancings
D) Home Improvement Loans
F) Non-occupant Loans on < 5 Family Dwellings (A B C & D)
G) Loans On Manufactured Home Dwelling (A B C & D)
Number
Average Value
Number
Average Value
Number
Average Value
Number
Average Value
Number
Average Value
Number
Average Value
LOANS ORIGINATED
16
$186,354
237
$207,192
350
$196,294
56
$114,593
54
$174,876
63
$143,387
APPLICATIONS APPROVED, NOT ACCEPTED
0
$0
44
$276,442
79
$239,883
7
$108,181
7
$397,053
12
$157,471
APPLICATIONS DENIED
7
$183,490
40
$167,930
201
$191,113
46
$109,509
17
$111,486
51
$135,309
APPLICATIONS WITHDRAWN
3
$225,310
41
$176,975
109
$196,537
7
$131,099
15
$201,409
13
$140,929
FILES CLOSED FOR INCOMPLETENESS
0
$0
8
$246,895
26
$144,725
2
$57,560
2
$56,740
0
$0
Aggregated Statistics For Year 2005 (Based on 4 partial tracts)
A) FHA, FSA/RHS & VA Home Purchase Loans
B) Conventional Home Purchase Loans
C) Refinancings
D) Home Improvement Loans
E) Loans on Dwellings For 5+ Families
F) Non-occupant Loans on < 5 Family Dwellings (A B C & D)
G) Loans On Manufactured Home Dwelling (A B C & D)
Number
Average Value
Number
Average Value
Number
Average Value
Number
Average Value
Number
Average Value
Number
Average Value
Number
Average Value
LOANS ORIGINATED
20
$148,508
296
$158,004
321
$161,356
28
$119,292
2
$96,210
41
$119,133
74
$118,500
APPLICATIONS APPROVED, NOT ACCEPTED
5
$150,316
72
$148,791
58
$108,373
10
$67,264
0
$0
16
$121,289
20
$102,294
APPLICATIONS DENIED
2
$136,500
99
$148,313
174
$147,816
23
$70,650
0
$0
16
$156,237
61
$115,904
APPLICATIONS WITHDRAWN
0
$0
72
$154,661
141
$153,158
15
$167,969
0
$0
13
$101,712
26
$93,995
FILES CLOSED FOR INCOMPLETENESS
0
$0
7
$183,020
31
$151,940
2
$28,780
0
$0
0
$0
0
$0
Aggregated Statistics For Year 2004 (Based on 4 partial tracts)
A) FHA, FSA/RHS & VA Home Purchase Loans
B) Conventional Home Purchase Loans
C) Refinancings
D) Home Improvement Loans
E) Loans on Dwellings For 5+ Families
F) Non-occupant Loans on < 5 Family Dwellings (A B C & D)
G) Loans On Manufactured Home Dwelling (A B C & D)
Detailed PMIC statistics for the following Tracts:0003.00
, 0016.00
2002 - 2018 National Fire Incident Reporting System (NFIRS) incidents
Based on the data from the years 2002 - 2018 the average number of fire incidents per year is 41. The highest number of fire incidents - 94 took place in 2009, and the least - 8 in 2002. The data has a growing trend.
When looking into fire subcategories, the most reports belonged to: Outside Fires (42.0%), and Structure Fires (28.6%).
Fire incident types reported to NFIRS in Zip Code 98625


 Nearest zip codes: 98674, 98626, 97018, 98629, 98642, 97054.
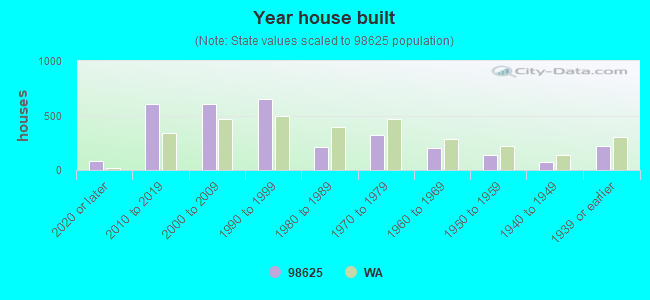


 Based on the data from the years 2002 - 2018 the average number of fire incidents per year is 41. The highest number of fire incidents - 94 took place in 2009, and the least - 8 in 2002. The data has a growing trend.
 When looking into fire subcategories, the most reports belonged to: Outside Fires (42.0%), and Structure Fires (28.6%).