Estimated zip code population in 2022: 25,494 Zip code population in 2010: 22,014 Zip code population in 2000: 20,108
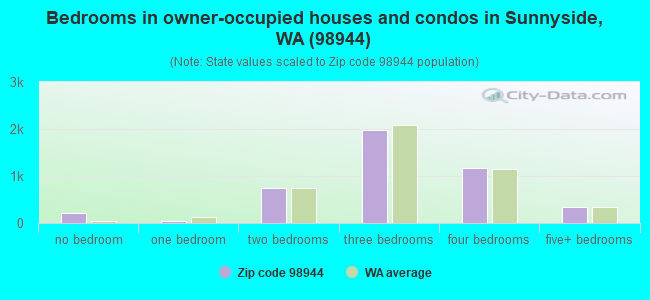
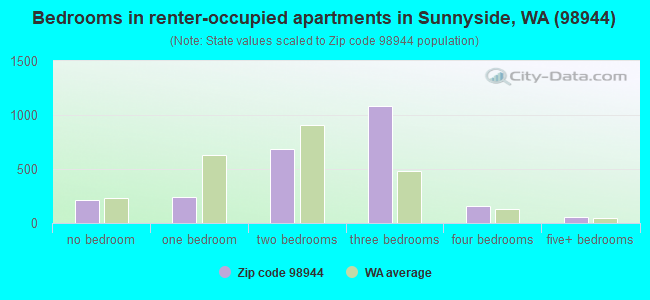
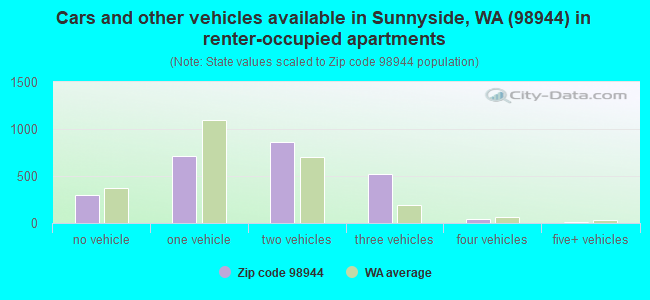
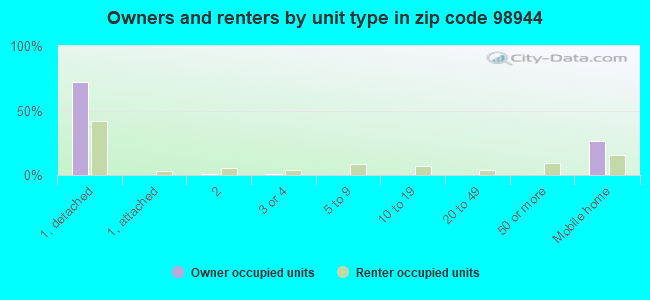
Houses and condos: 7,177 Renter-occupied apartments: 2,488
% of renters here:
36%
State:
36%
March 2022 cost of living index in zip code 98944: 93.9 (less than average, U.S. average is 100)
Land area: 578.1 sq. mi. Water area: 10.6 sq. mi.
Population density: 44 people per square mile
(very low).
OSM Map
General Map
Google Map
MSN Map
OSM Map
General Map
Google Map
MSN Map
OSM Map
General Map
Google Map
MSN Map
OSM Map
General Map
Google Map
MSN Map
Please wait while loading the map...
Real estate property taxes paid for housing units in 2022:
This zip code:
0.7% ($1,572)
Washington:
0.8% ($4,283)
Median real estate property taxes paid for housing units with mortgages in 2022: $1,712 (0.6%) Median real estate property taxes paid for housing units with no mortgage in 2022: $1,344 (0.7%)
Estimated median house/condo value in 2022: $240,239
98944:
$240,239
Washington:
$569,500
According to our research of Washington and other state lists, there were 10 registered sex offenders living in 98944 zip code as of April 23, 2024. The ratio of all residents to sex offenders in zip code 98944 is 2,288 to 1. The ratio of registered sex offenders to all residents in this zip code is lower than the state average.
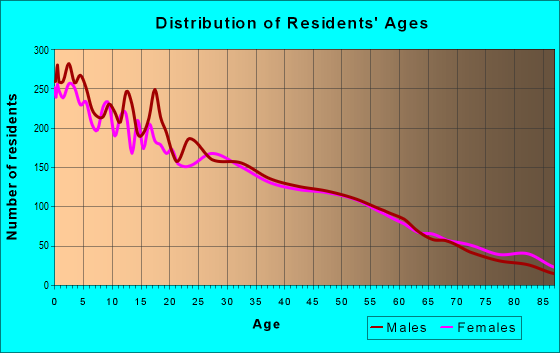
Median resident age:
This zip code:
27.3 years
Washington median age:
38.4 years
Average household size:
This zip code:
3.6 people
Washington:
2.5 people
Averages for the 2020 tax year for zip code 98944, filed in 2021:
Average Adjusted Gross Income (AGI) in 2020: $44,157 (Individual Income Tax Returns)
Here:
$44,157
State:
$99,264
Salary/wage: $37,286 (reported on 91.5% of returns)
Here:
$37,286
State:
$80,347
(% of AGI for various income ranges: 1671.4% for AGIs below $25k, 4036.3% for AGIs $25k-50k, 6916.9% for AGIs $50k-75k, 9682.4% for AGIs $75k-100k, 17805.1% for AGIs $100k-200k, 54810.0% for AGIs over 200k)
Taxable interest for individuals: $3,004 (reported on 12.1% of returns)
This zip code:
$3,004
Washington:
$2,077
(% of AGI for various income ranges: 6.3% for AGIs below $25k, 8.1% for AGIs $25k-50k, 52.7% for AGIs $50k-75k, 50.2% for AGIs $75k-100k, 231.7% for AGIs $100k-200k, 5973.3% for AGIs over 200k)
Ordinary dividends: $4,182 (reported on 4.9% of returns)
Here:
$4,182
State:
$10,013
(% of AGI for various income ranges: 7.6% for AGIs below $25k, 7.3% for AGIs $25k-50k, 24.2% for AGIs $50k-75k, 67.8% for AGIs $75k-100k, 136.0% for AGIs $100k-200k, 2216.7% for AGIs over 200k)
Net capital gain/loss in AGI: +$30,500 (reported on 5.0% of returns)
Here:
+$30,500
State:
+$40,092
(% of AGI for various income ranges: 3.1% for AGIs below $25k, 9.7% for AGIs $25k-50k, 48.8% for AGIs $50k-75k, 120.2% for AGIs $75k-100k, 658.6% for AGIs $100k-200k, 41403.3% for AGIs over 200k)
Profit/loss from business: +$11,700 (reported on 7.9% of returns)
Here:
+$11,700
State:
+$18,312
(% of AGI for various income ranges: 50.4% for AGIs below $25k, 65.3% for AGIs $25k-50k, 131.8% for AGIs $50k-75k, 190.4% for AGIs $75k-100k, 431.7% for AGIs $100k-200k, 8813.3% for AGIs over 200k)
Taxable individual retirement arrangement distribution: $18,726 (reported on 2.6% of returns)
98944:
$18,726
Washington:
$24,221
(% of AGI for various income ranges: 12.3% for AGIs below $25k, 19.4% for AGIs $25k-50k, 70.4% for AGIs $50k-75k, 169.8% for AGIs $75k-100k, 749.4% for AGIs $100k-200k)
Total itemized deductions: $38,574 (reported on 1.8% of returns)
Here:
$38,574
State:
$39,068
(% of AGI for various income ranges: 43.5% for AGIs $25k-50k, 80.6% for AGIs $50k-75k, 167.6% for AGIs $75k-100k, 392.0% for AGIs $100k-200k, 10316.7% for AGIs over 200k)
Charity contributions: $18,236 (reported on 1.3% of returns)
Here:
$18,236
State:
$15,331
(% of AGI for various income ranges: 9.3% for AGIs $25k-50k, 18.4% for AGIs $50k-75k, 36.0% for AGIs $75k-100k, 134.9% for AGIs $100k-200k, 4853.3% for AGIs over 200k)
Taxes paid: $4,384 (reported on 1.8% of returns)
98944:
$4,384
State:
$7,774
(% of AGI for various income ranges: 5.3% for AGIs $25k-50k, 9.8% for AGIs $50k-75k, 31.8% for AGIs $75k-100k, 53.7% for AGIs $100k-200k, 820.0% for AGIs over 200k)
Earned income credit: $2,618 (reported on 23.7% of returns)
Here:
$2,618
State:
$2,020
(% of AGI for various income ranges: 134.5% for AGIs below $25k, 97.5% for AGIs $25k-50k, 1.6% for AGIs $50k-75k)
Percentage of individuals using paid preparers for their 2020 taxes: 92.8%
Here:
93%
State:
93%
(% for various income ranges: 92.4% for AGIs below $25k, 92.2% for AGIs $25k-50k, 94.0% for AGIs $50k-75k, 93.5% for AGIs $75k-100k, 95.0% for AGIs $100k-200k, 92.3% for AGIs over 200k)
Averages for the 2012 tax year for zip code 98944, filed in 2013:
Average Adjusted Gross Income (AGI) in 2012: $36,277 (Individual Income Tax Returns)
Here:
$36,277
State:
$69,533
Salary/wage: $29,952 (reported on 91.9% of returns)
Here:
$29,952
State:
$57,267
(% of AGI for various income ranges: 86.7% for AGIs below $25k, 89.1% for AGIs $25k-50k, 82.8% for AGIs $50k-75k, 78.1% for AGIs $75k-100k, 69.0% for AGIs $100k-200k, 29.2% for AGIs over 200k)
Taxable interest for individuals: $2,625 (reported on 15.0% of returns)
This zip code:
$2,625
Washington:
$1,816
(% of AGI for various income ranges: 0.5% for AGIs below $25k, 0.4% for AGIs $25k-50k, 0.9% for AGIs $50k-75k, 0.6% for AGIs $75k-100k, 2.6% for AGIs $100k-200k, 2.4% for AGIs over 200k)
Ordinary dividends: $4,800 (reported on 6.0% of returns)
Here:
$4,800
State:
$8,163
(% of AGI for various income ranges: 0.5% for AGIs below $25k, 0.3% for AGIs $25k-50k, 0.6% for AGIs $50k-75k, 1.0% for AGIs $75k-100k, 0.9% for AGIs $100k-200k, 2.2% for AGIs over 200k)
Net capital gain/loss in AGI: +$22,009 (reported on 5.3% of returns)
Here:
+$22,009
State:
+$21,568
(% of AGI for various income ranges: 0.8% for AGIs $50k-75k, 2.1% for AGIs $75k-100k, 5.3% for AGIs $100k-200k, 16.2% for AGIs over 200k)
Profit/loss from business: +$9,327 (reported on 8.9% of returns)
Here:
+$9,327
State:
+$16,521
(% of AGI for various income ranges: 3.3% for AGIs below $25k, 1.5% for AGIs $25k-50k, 1.2% for AGIs $50k-75k, 1.7% for AGIs $75k-100k, 6.6% for AGIs $100k-200k)
Taxable individual retirement arrangement distribution: $12,474 (reported on 3.8% of returns)
98944:
$12,474
Washington:
$18,648
(% of AGI for various income ranges: 0.7% for AGIs below $25k, 0.7% for AGIs $25k-50k, 1.2% for AGIs $50k-75k, 1.6% for AGIs $75k-100k, 5.1% for AGIs $100k-200k)
Self-employment retirement plans: $20,050 (reported on 0.2% of returns)
98944:
$20,050
Washington:
$20,087
Total itemized deductions: $19,100 (21% of AGI, reported on 11.3% of returns)
Here:
$19,100
State:
$23,872
Here:
21.0% of AGI
State:
18.2% of AGI
(% of AGI for various income ranges: 3.4% for AGIs below $25k, 4.3% for AGIs $25k-50k, 8.0% for AGIs $50k-75k, 7.9% for AGIs $75k-100k, 9.1% for AGIs $100k-200k, 6.1% for AGIs over 200k)
Charity contributions: $6,414 (reported on 7.1% of returns)
Here:
$6,414
State:
$4,465
(% of AGI for various income ranges: 0.2% for AGIs below $25k, 0.4% for AGIs $25k-50k, 1.1% for AGIs $50k-75k, 1.6% for AGIs $75k-100k, 2.6% for AGIs $100k-200k, 3.2% for AGIs over 200k)
Taxes paid: $3,491 (reported on 10.9% of returns)
98944:
$3,491
State:
$6,400
(% of AGI for various income ranges: 0.6% for AGIs below $25k, 0.6% for AGIs $25k-50k, 1.5% for AGIs $50k-75k, 1.4% for AGIs $75k-100k, 1.8% for AGIs $100k-200k, 1.2% for AGIs over 200k)
Earned income credit: $2,767 (reported on 32.3% of returns)
Here:
$2,767
State:
$2,073
(% of AGI for various income ranges: 9.6% for AGIs below $25k, 2.0% for AGIs $25k-50k)
Percentage of individuals using paid preparers for their 2012 taxes: 65.0%
Here:
65%
State:
43%
(% for various income ranges: 63.1% for AGIs below $25k, 68.3% for AGIs $25k-50k, 62.2% for AGIs $50k-75k, 62.2% for AGIs $75k-100k, 68.8% for AGIs $100k-200k, 87.5% for AGIs over 200k)
Averages for the 2004 tax year for zip code 98944, filed in 2005:
Average Adjusted Gross Income (AGI) in 2004: $30,846 (Individual Income Tax Returns)
Here:
$30,846
State:
$54,331
Salary/wage: $26,202 (reported on 90.4% of returns)
Here:
$26,202
State:
$45,761
(% of AGI for various income ranges: 163.2% for AGIs below $10k, 86.4% for AGIs $10k-25k, 88.1% for AGIs $25k-50k, 82.1% for AGIs $50k-75k, 77.4% for AGIs $75k-100k, 38.3% for AGIs over 100k)
Taxable interest for individuals: $2,509 (reported on 27.7% of returns)
This zip code:
$2,509
Washington:
$2,110
(% of AGI for various income ranges: 6.2% for AGIs below $10k, 1.8% for AGIs $10k-25k, 1.1% for AGIs $25k-50k, 2.1% for AGIs $50k-75k, 1.8% for AGIs $75k-100k, 4.2% for AGIs over 100k)
Taxable dividends: $2,631 (reported on 11.1% of returns)
Here:
$2,631
State:
$5,879
(% of AGI for various income ranges: 3.6% for AGIs below $10k, 0.5% for AGIs $10k-25k, 0.5% for AGIs $25k-50k, 0.9% for AGIs $50k-75k, 0.9% for AGIs $75k-100k, 1.8% for AGIs over 100k)
Net capital gain/loss: +$15,734 (reported on 9.7% of returns)
Here:
+$15,734
State:
+$15,835
(% of AGI for various income ranges: 3.7% for AGIs below $10k, 0.3% for AGIs $10k-25k, 0.4% for AGIs $25k-50k, 1.0% for AGIs $50k-75k, 1.2% for AGIs $75k-100k, 21.1% for AGIs over 100k)
Profit/loss from business: +$11,839 (reported on 11.2% of returns)
Here:
+$11,839
State:
+$13,994
(% of AGI for various income ranges: -0.3% for AGIs below $10k, 2.8% for AGIs $10k-25k, 2.7% for AGIs $25k-50k, 4.5% for AGIs $50k-75k, 3.7% for AGIs $75k-100k, 8.7% for AGIs over 100k)
IRA payment deduction: $3,593 (reported on 1.3% of returns)
98944:
$3,593
Washington:
$3,001
Self-employed pension: $12,303 (reported on 0.5% of returns)
Here:
$12,303
Washington:
$14,244
Total itemized deductions: $15,895 (24% of AGI, reported on 12.8% of returns)
Here:
$15,895
State:
$19,669
Here:
23.6% of AGI
State:
20.7% of AGI
(% of AGI for various income ranges: 8.6% for AGIs below $10k, 3.4% for AGIs $10k-25k, 5.3% for AGIs $25k-50k, 9.3% for AGIs $50k-75k, 9.1% for AGIs $75k-100k, 7.7% for AGIs over 100k)
Charity contributions deductions: $4,469 (6% of AGI, reported on 10.2% of returns)
Here:
$4,469
State:
$3,569
Here:
6.1% of AGI
State:
3.5% of AGI
(% of AGI for various income ranges: 0.5% for AGIs below $10k, 0.6% for AGIs $10k-25k, 0.7% for AGIs $25k-50k, 1.4% for AGIs $50k-75k, 2.1% for AGIs $75k-100k, 3.2% for AGIs over 100k)
Total tax: $5,050 (reported on 51.0% of returns)
98944:
$5,050
State:
$9,065
(% of AGI for various income ranges: 3.5% for AGIs below $10k, 2.1% for AGIs $10k-25k, 4.4% for AGIs $25k-50k, 8.3% for AGIs $50k-75k, 11.1% for AGIs $75k-100k, 19.1% for AGIs over 100k)
Earned income credit: $2,156 (reported on 33.9% of returns)
Here:
$2,156
State:
$1,607
Percentage of individuals using paid preparers for their 2004 taxes: 63.6%
Here:
64%
State:
49%
(% for various income ranges: 57.9% for AGIs below $10k, 64.2% for AGIs $10k-25k, 63.9% for AGIs $25k-50k, 67.3% for AGIs $50k-75k, 66.7% for AGIs $75k-100k, 80.2% for AGIs over 100k)
Household received Food Stamps/SNAP in the past 12 months: 2,077 Household did not receive Food Stamps/SNAP in the past 12 months: 4,897
Women who had a birth in the past 12 months: 323 (188 now married, 126 unmarried) Women who did not have a birth in the past 12 months: 5,305 (2,291 now married, 3,016 unmarried)
Housing units in zip code 98944 with a mortgage: 2,425 (155 second mortgage, 16 home equity loan, 133 both second mortgage and home equity loan) Houses without a mortgage: 87
Median monthly owner costs for units with a mortgage: $1,332 Median monthly owner costs for units without a mortgage: $479
Residents with income below the poverty level in 2022:
This zip code:
13.9%
Whole state:
10.0%
Residents with income below 50% of the poverty level in 2022:
This zip code:
7.0%
Whole state:
4.6%
Median number of rooms in houses and condos:
Here:
6.0
State:
6.5
Median number of rooms in apartments:
Here:
4.8
State:
3.9
Notable locations in this zip code not listed on our city pages
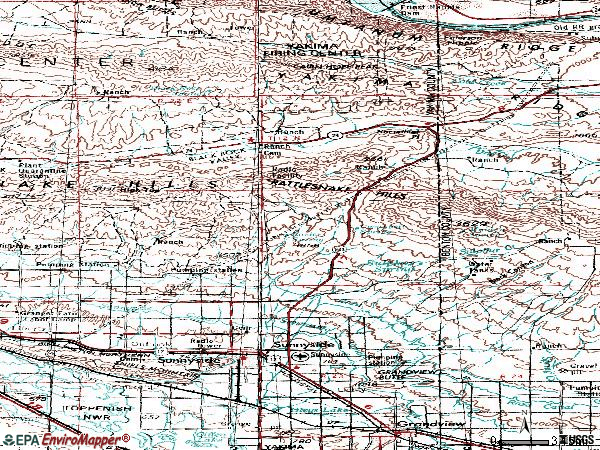
Notable locations in zip code 98944: Airport Ranch (A), Benson Ranch (B), Beynaud Ranch (C), Lower Valley Golf Club (D), Midway Substation (E), Pump Station Number 10 (F), Pumping Station Number 12 (G), Pumping Station Number 13 (H), Sunny-Grand Speedway (I), Three Hundred North Radioactive Waste Dump (J), Wye Radioactive Waste Dump (K), Grandview Substation (L), Emerson Nipple (M), Gravel Pit (N), Hanford Road Barricade (O), Riverland (P), Hanford Site (Q), Sulphur Creek Ranch (R), Wye Barricade (S), Cold Creek (T). Display/hide their locations on the map
5,638 married couples with children.
2,090 single-parent households (1,005 men, 1,085 women).
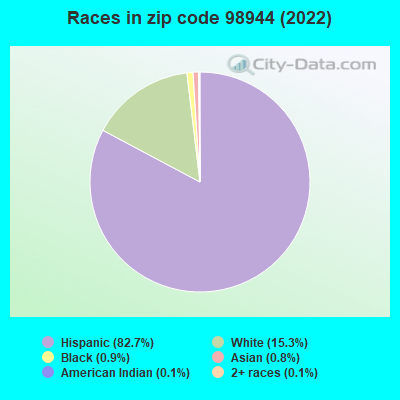
28.6% of residents of 98944 zip code speak English at home.
71.9% of residents speak Spanish at home (53% very well, 12% well, 17% not well, 17% not at all).
0.7% of residents speak Asian or Pacific Island language at home (31% very well, 69% well).
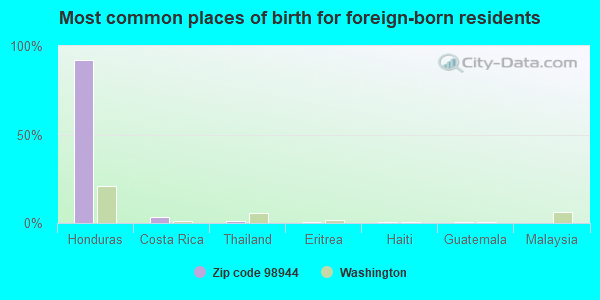
Foreign born population: 8,236 (32.3%) (24.1% of them are naturalized citizens)
This zip code:
32.3%
Whole state:
15.3%
92%Honduras
3%Costa Rica
1%Thailand
1%Eritrea
1%Haiti
0%Guatemala
0%Malaysia
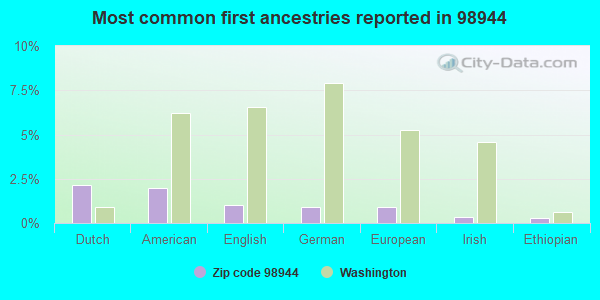
2%Dutch
2%American
1%English
1%German
1%European
0%Irish
0%Ethiopian
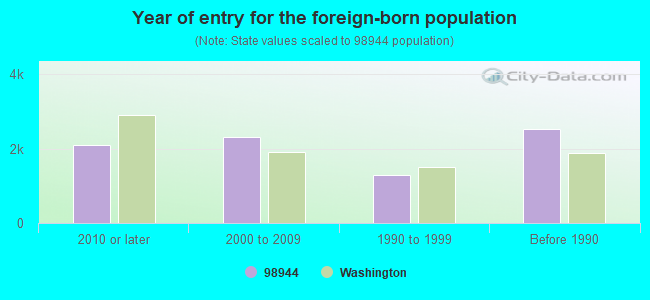
Year of entry for the foreign-born population
2,0982010 or later
2,2982000 to 2009
1,2851990 to 1999
2,513Before 1990
Facilities with environmental interests located in this zip code:
BLEYHL FARM SERVICE (1720 EASTWAY DRIVE in SUNNYSIDE, WA)
COMPLIANCE ACTIVITY (Tracking inspections of insecticide, fungicide, and rodenticide, and toxic substances) (Resource Conservation and Recovery Act (tracking hazardous waste)) STATE MASTER (Washington State Department of Ecology's Facility/Site identification system) - TOXICS-3413, LEAKING STORAGE TANK, UNDERGROUND STORAGE TANK PROGRAM, HAZWASTE-CRK000045150, EPCRA, HAZWASTE-WAD027526631, TOXICS-, GROUND WATER PROGRAM STATE MASTER (Washington State Department of Ecology's Facility/Site identification system) - HAZWASTE-WAD027526631, HAZARDOUS WASTE PROGRAM STATE MASTER (Washington State Department of Ecology's Facility/Site identification system) - HAZWASTE-CRK000019220, EPCRA Business SIC classification: FARM SUPPLIES; MOTORCYCLE DEALERS Organizations: BLEYHL FARM SERVICE INC (CONTACT/OPERATOR)
Alternative names: BLEYHL FARM SERVICE INC SUNNYSIDE 1, BLEYHL FARM SERVICE INC SUNNYSIDE 2A, BLEYHL FARM SERVICE INC, BLEYHL FARM SERVICE SUNNYSIDE
CANAM STEEL CORPORATION SUNNYSIDE WA PLANT (2002 MORGAN RD. in SUNNYSIDE, WA)
AIR MAJOR (AIRS/AFS) CRITERIA AND HAZARDOUS AIR POLLUTANT INVENTORY (Inventory of air pollution sources) National Pollutant Discharge Elimination System NON-MAJOR (Tracking pollutant discharge elimination systems) - permit HAZARDOUS WASTE BIENNIAL REPORTER (Resource Conservation and Recovery Act (tracking hazardous waste)) Large Quantity Generators, more that 1000 kg of hazardous waste/month (Resource Conservation and Recovery Act (tracking hazardous waste)) - notification TRI REPORTER (Tracking of toxic chemicals releasing facilities) STATE MASTER (Washington State Department of Ecology's Facility/Site identification system) - HAZWASTE-WAH000001495, LQG, AIRQUAL-G 077 0059, AIR MAJOR, WATQUAL-SO3002955, NPDES STORMWATER PERMIT, HAZWASTE-WAH000001495, EPCRA, TRI REPORTER, HAZARDOUS WASTE PROGRAM Business SIC classification: FISH HATCHERIES AND PRESERVES; FABRICATED STRUCTURAL METAL; PREFABRICATED METAL BUILDINGS AND COMPONENTS Business NAICS classification: FABRICATED STRUCTURAL METAL MANUFACTURING.; FABRICATED STRUCTURAL METAL MANUFACTURING.; FABRICATED STRUCTURAL METAL MANUFACTURING. Organizations: SUN STEEL BUILDINGS INC (CONTACT/OWNER)
Alternative names: CANAM STEEL CORP SUNNYSIDE PLANT, CANAM STEEL CORP SUNNYSIDE PLANT, CANAM STEEL CORP. SUNNYSIDE WA PLANT, CANAM/SUN STEEL BUILDINGS, SUN STEEL BLDGS INC
CHIEF KAMIAKIN ELEMENTARY SCHOOL (1110 S 6TH ST in SUNNYSIDE, WA)
(National Center for Education Statistics) - STATE ID-4000 (National Center for Education Statistics) - STATE ID-2717 Organizations: SUNNYSIDE SCH DIST 201 (SCHOOL DISTRICT)
ANDRUS & ROBERTS PRODUCE (101 WANETA ROAD in SUNNYSIDE, WA)
National Pollutant Discharge Elimination System NON-MAJOR (Tracking pollutant discharge elimination systems) - permit STATE MASTER (Washington State Department of Ecology's Facility/Site identification system) - HAZWASTE-CRK000040210, EPCRA, WATQUAL-WAG435054, NPDES NON-MAJOR, WATQUAL-, FORMAL ENFORCEMENT ACTION Business SIC classification: CROP PREPARATION SERVICES FOR MARKET, EXCEPT COTTON GINNING; REFRIGERATED WAREHOUSING AND STORAGE; NONCLASSIFIABLE ESTABLISHMENTS Organizations: ANDRUS AND ROBERTS PRODUCE CO (CONTACT/OWNER)
ARCO 5939 PSI 5481 (1850 WANETA RD in SUNNYSIDE, WA)
Small Quantity Generators, between 100 kg and 1000 kg of hazardous waste/month (Resource Conservation and Recovery Act (tracking hazardous waste)) STATE MASTER (Washington State Department of Ecology's Facility/Site identification system) - TOXICS-, UNDERGROUND STORAGE TANK PROGRAM, HAZWASTE-WA0000230292, EPCRA, SQG Business SIC classification: GASOLINE SERVICE STATIONS Organizations: BP WEST COAST PRODUCTS LLC (CONTACT/OPERATOR)
Alternative names: ARCO 05939
C SPECK MOTORS INC (600 S 6TH ST in SUNNYSIDE, WA)
(Resource Conservation and Recovery Act (tracking hazardous waste))
CENTRAL PREMIX_CONCRETE COMPANY (112 FACTORY ROAD in SUNNYSIDE, WA) . Tribal Land
AIR MINOR (AIRS/AFS) Business SIC classification: NONCLASSIFIABLE ESTABLISHMENTS Alternative names: GRAHAM AND MORRIS
Housing units lacking complete plumbing facilities: 1.9% Housing units lacking complete kitchen facilities: 3.8%
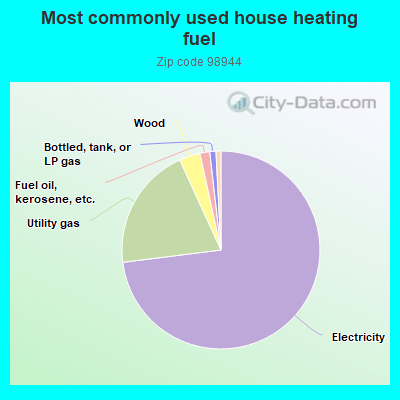
72.8%Electricity
20.1%Utility gas
3.4%Wood
1.6%Fuel oil, kerosene, etc.
1.0%Bottled, tank, or LP gas
0.8%Other fuel
Population in 1990: 16,774. Population change in the 1990s: +3,334 (+19.9%).
Place of birth for U.S.-born residents:
This state: 14,156
Northeast: 2
Midwest: 546
South: 818
West: 1,736
48% of the 98944 zip code residents lived in the same house 5 years ago. Out of people who lived in different houses, 80% lived in this county. Out of people who lived in different counties, 50% lived in Washington.
93% of the 98944 zip code residents lived in the same house 1 year ago. Out of people who lived in different houses, 64% moved from this county. Out of people who lived in different houses, 18% moved from different county within same state. Out of people who lived in different houses, 8% moved from different state. Out of people who lived in different houses, 14% moved from abroad.
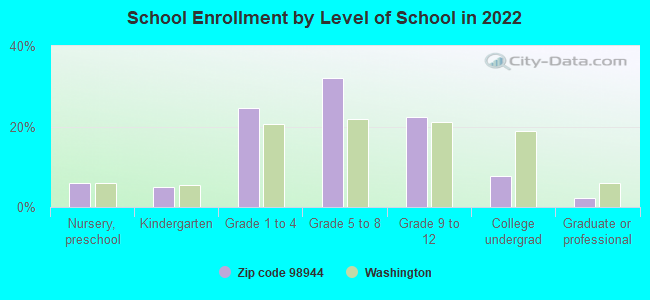
Private vs. public school enrollment:
Students in private schools in grades 1 to 8 (elementary and middle school): 73
Here:
1.7%
Washington:
12.4%
Students in private schools in grades 9 to 12 (high school): 102
Here:
6.1%
Washington:
9.2%
Students in private undergraduate colleges: 159
Here:
26.7%
Washington:
16.5%
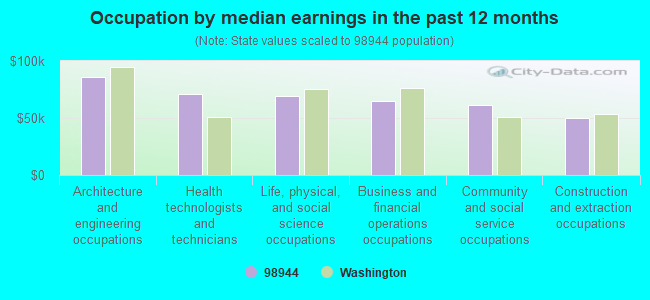
Occupation by median earnings in the past 12 months ($)
85,633Architecture and engineering occupations
71,352Health technologists and technicians
68,921Life, physical, and social science occupations
64,665Business and financial operations occupations
61,564Community and social service occupations
49,869Construction and extraction occupations
Companies with federal contracts located in this zip code:
BMS PROPERTIES (1403 HIGHWAY 12 in SUNNYSIDE, WA; small business) : $636,823 in 35 contractsfrom 1999 to 2004
Contracts for Lease or Rental of Facilities -- Office Buildings by Public Buildings Service Signed by year:2000: $104,000; 2001: $104,000; 2002: $130,674; 2003: $245,812; 2004: $26,337; 2005: $0; 2006: $0.
Biggest contracts:
$26,337 with Public Buildings Service for Lease or Rental of Facilities -- Office Buildings. Signed on 2003-06-15. Completion date: 2003-06-15.
$26,337, same as above.Signed on 2003-03-15. Completion date: 2003-03-15.
$26,337, same as above.Signed on 2003-09-15. Completion date: 2003-09-15.
$26,337, same as above.Signed on 2002-12-15. Completion date: 2002-12-15.
ROZA IRRIGATION DISTRICT (125 S 13TH ST in SUNNYSIDE, WA) : $246,752 in 7 contractsfrom 2000 to 2006
Contracts for Water Services by Army Signed by year:2000: $38,598; 2001: $38,598; 2002: $41,044; 2003: $42,022; 2004: $0; 2005: $42,022; 2006: $44,468.
Biggest contracts:
$44,468 with Army for Water Services. Signed on 2006-01-26. Completion date: 2006-02-24.
$42,022, same as above.Signed on 2005-01-01. Completion date: 2005-12-31.
$42,022, same as above.Signed on 2003-02-04. Completion date: 2003-02-04.
$41,044, same as above.Signed on 2002-04-10. Completion date: 2002-04-10.
Top industries in this zip code by the number of employees in 2005:
Health Care and Social Assistance: General Medical and Surgical Hospitals (250-499 employees: 1 establishment)
2002 - 2018 National Fire Incident Reporting System (NFIRS) incidents
Based on the data from the years 2002 - 2018 the average number of fire incidents per year is 125. The highest number of reported fire incidents - 169 took place in 2009, and the least - 61 in 2002. The data has a rising trend.
When looking into fire subcategories, the most reports belonged to: Outside Fires (33.7%), and Structure Fires (27.3%).
Fire incident types reported to NFIRS in Zip Code 98944


 Nearest zip codes: 99349, 99320, 99353, 99350, 98930, 99354.


 Based on the data from the years 2002 - 2018 the average number of fire incidents per year is 125. The highest number of reported fire incidents - 169 took place in 2009, and the least - 61 in 2002. The data has a rising trend.
 When looking into fire subcategories, the most reports belonged to: Outside Fires (33.7%), and Structure Fires (27.3%).