Estimated zip code population in 2022: 10,185 Zip code population in 2010: 9,174 Zip code population in 2000: 8,533
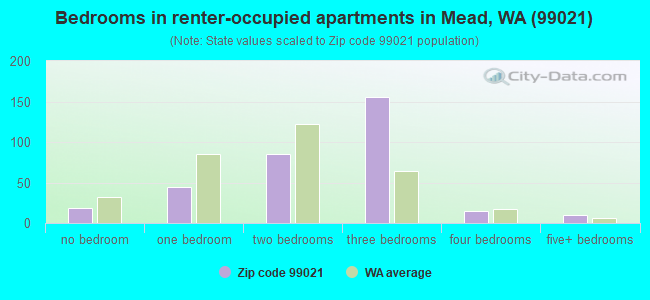
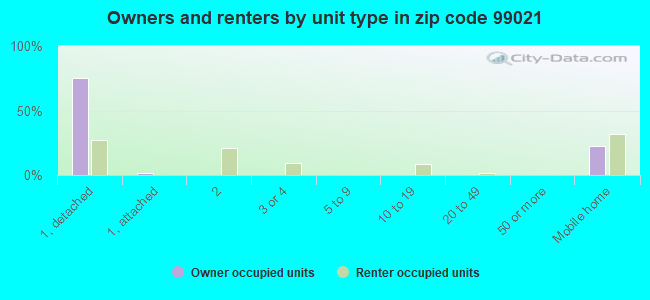
Houses and condos: 3,917 Renter-occupied apartments: 332
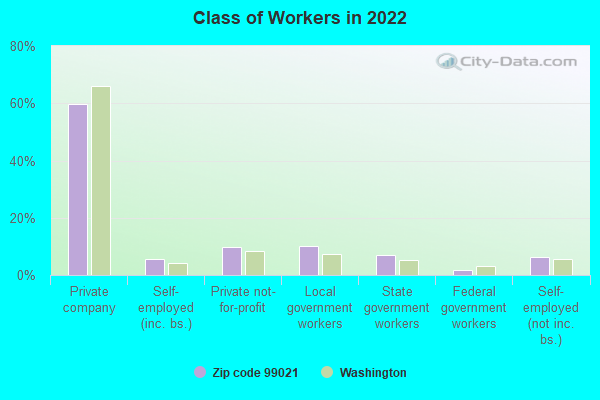
% of renters here:
9%
State:
36%
March 2022 cost of living index in zip code 99021: 96.0 (near average, U.S. average is 100)
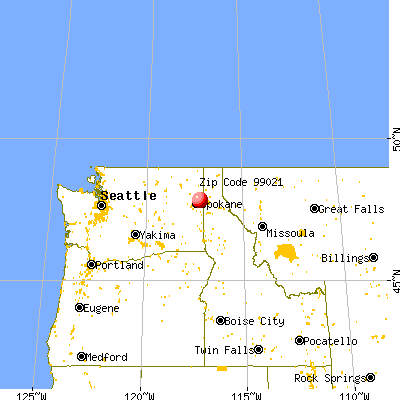
Land area: 84.2 sq. mi. Water area: 0.0 sq. mi.
Population density: 121 people per square mile
(very low).
OSM Map
General Map
Google Map
MSN Map
OSM Map
General Map
Google Map
MSN Map
OSM Map
General Map
Google Map
MSN Map
OSM Map
General Map
Google Map
MSN Map
Please wait while loading the map...
Real estate property taxes paid for housing units in 2022:
This zip code:
0.7% ($3,457)
Washington:
0.8% ($4,283)
Median real estate property taxes paid for housing units with mortgages in 2022: $3,780 (0.7%) Median real estate property taxes paid for housing units with no mortgage in 2022: $2,924 (0.8%)
Business Search- 14 Million verified businesses
Males: 4,947
(48.6%)
Females: 5,237
(51.4%)
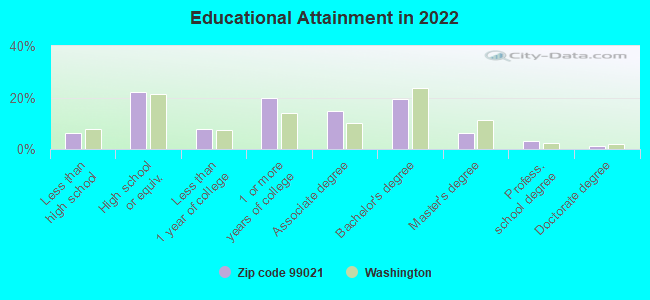
For population 25 years and over in 99021:
High school or higher: 92.8%
Bachelor's degree or higher: 29.3%
Graduate or professional degree: 10.2%
Unemployed: 6.8%
Mean travel time to work (commute): 25.0 minutes
For population 15 years and over in 99021:
Never married: 22.8%
Now married: 58.5%
Separated: 1.1%
Widowed: 4.5%
Divorced: 13.1%
Zip code 99021 compared to state average:
Black race population percentage significantly below state average.
Hispanic race population percentage below state average.
Median age above state average.
Foreign-born population percentage significantly below state average.
Renting percentage significantly below state average.
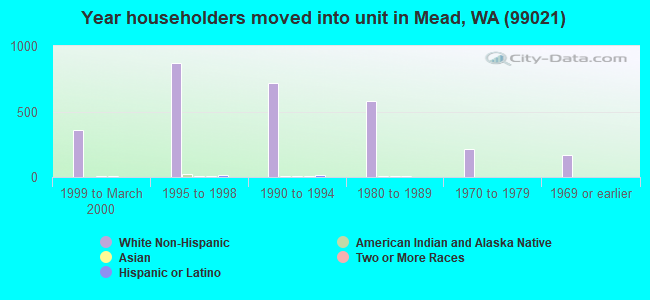
Length of stay since moving in significantly above state average.
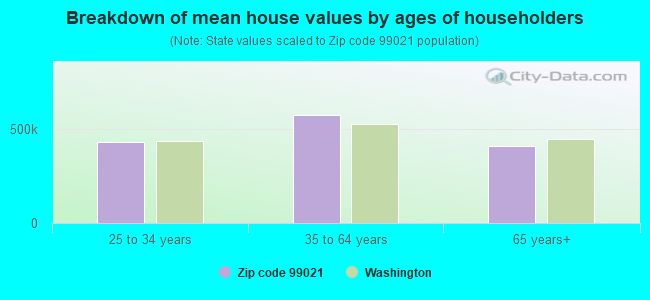
Estimated median house/condo value in 2022: $461,230
99021:
$461,230
Washington:
$569,500
According to our research of Washington and other state lists, there were 2 registered sex offenders living in 99021 zip code as of April 18, 2024. The ratio of all residents to sex offenders in zip code 99021 is 4,445 to 1. The ratio of registered sex offenders to all residents in this zip code is much lower than the state average.
Median resident age:
This zip code:
43.5 years
Washington median age:
38.4 years
Average household size:
This zip code:
2.9 people
Washington:
2.5 people
Averages for the 2020 tax year for zip code 99021, filed in 2021:
Average Adjusted Gross Income (AGI) in 2020: $76,745 (Individual Income Tax Returns)
Here:
$76,745
State:
$99,264
Salary/wage: $64,092 (reported on 79.7% of returns)
Here:
$64,092
State:
$80,347
(% of AGI for various income ranges: 1082.8% for AGIs below $25k, 3237.3% for AGIs $25k-50k, 5979.6% for AGIs $50k-75k, 8875.3% for AGIs $75k-100k, 17414.6% for AGIs $100k-200k, 63115.0% for AGIs over 200k)
Taxable interest for individuals: $1,250 (reported on 44.3% of returns)
This zip code:
$1,250
Washington:
$2,077
(% of AGI for various income ranges: 26.3% for AGIs below $25k, 20.9% for AGIs $25k-50k, 47.6% for AGIs $50k-75k, 75.9% for AGIs $75k-100k, 183.4% for AGIs $100k-200k, 900.0% for AGIs over 200k)
Ordinary dividends: $4,632 (reported on 19.9% of returns)
Here:
$4,632
State:
$10,013
(% of AGI for various income ranges: 29.6% for AGIs below $25k, 41.9% for AGIs $25k-50k, 77.4% for AGIs $50k-75k, 70.6% for AGIs $75k-100k, 273.8% for AGIs $100k-200k, 2050.0% for AGIs over 200k)
Net capital gain/loss in AGI: +$21,019 (reported on 19.5% of returns)
Here:
+$21,019
State:
+$40,092
(% of AGI for various income ranges: 6.0% for AGIs below $25k, 69.4% for AGIs $25k-50k, 116.4% for AGIs $50k-75k, 221.2% for AGIs $75k-100k, 608.0% for AGIs $100k-200k, 17940.0% for AGIs over 200k)
Profit/loss from business: +$13,816 (reported on 13.3% of returns)
Here:
+$13,816
State:
+$18,312
(% of AGI for various income ranges: 82.6% for AGIs below $25k, 129.9% for AGIs $25k-50k, 207.4% for AGIs $50k-75k, 340.0% for AGIs $75k-100k, 694.1% for AGIs $100k-200k, 1053.8% for AGIs over 200k)
Taxable individual retirement arrangement distribution: $19,153 (reported on 10.1% of returns)
99021:
$19,153
Washington:
$24,221
(% of AGI for various income ranges: 70.1% for AGIs below $25k, 127.6% for AGIs $25k-50k, 192.6% for AGIs $50k-75k, 379.1% for AGIs $75k-100k, 684.1% for AGIs $100k-200k, 1900.0% for AGIs over 200k)
Total itemized deductions: $37,384 (reported on 7.7% of returns)
Here:
$37,384
State:
$39,068
(% of AGI for various income ranges: 142.3% for AGIs $25k-50k, 229.8% for AGIs $50k-75k, 251.8% for AGIs $75k-100k, 834.3% for AGIs $100k-200k, 7378.7% for AGIs over 200k)
Charity contributions: $12,341 (reported on 6.0% of returns)
Here:
$12,341
State:
$15,331
(% of AGI for various income ranges: 9.1% for AGIs $25k-50k, 35.8% for AGIs $50k-75k, 51.8% for AGIs $75k-100k, 270.9% for AGIs $100k-200k, 2033.7% for AGIs over 200k)
Taxes paid: $7,117 (reported on 7.5% of returns)
99021:
$7,117
State:
$7,774
(% of AGI for various income ranges: 24.1% for AGIs $25k-50k, 47.8% for AGIs $50k-75k, 50.9% for AGIs $75k-100k, 195.2% for AGIs $100k-200k, 1056.2% for AGIs over 200k)
Earned income credit: $1,980 (reported on 10.6% of returns)
Here:
$1,980
State:
$2,020
(% of AGI for various income ranges: 53.6% for AGIs below $25k, 57.5% for AGIs $25k-50k)
Percentage of individuals using paid preparers for their 2020 taxes: 93.2%
Here:
93%
State:
93%
(% for various income ranges: 92.3% for AGIs below $25k, 94.6% for AGIs $25k-50k, 94.1% for AGIs $50k-75k, 91.8% for AGIs $75k-100k, 92.9% for AGIs $100k-200k, 92.6% for AGIs over 200k)
Averages for the 2012 tax year for zip code 99021, filed in 2013:
Average Adjusted Gross Income (AGI) in 2012: $59,778 (Individual Income Tax Returns)
Here:
$59,778
State:
$69,533
Salary/wage: $52,266 (reported on 83.7% of returns)
Here:
$52,266
State:
$57,267
(% of AGI for various income ranges: 73.8% for AGIs below $25k, 74.6% for AGIs $25k-50k, 77.6% for AGIs $50k-75k, 77.7% for AGIs $75k-100k, 79.3% for AGIs $100k-200k, 53.0% for AGIs over 200k)
Taxable interest for individuals: $1,130 (reported on 40.3% of returns)
This zip code:
$1,130
Washington:
$1,816
(% of AGI for various income ranges: 1.1% for AGIs below $25k, 0.9% for AGIs $25k-50k, 0.6% for AGIs $50k-75k, 0.7% for AGIs $75k-100k, 0.6% for AGIs $100k-200k, 1.0% for AGIs over 200k)
Ordinary dividends: $4,073 (reported on 20.0% of returns)
Here:
$4,073
State:
$8,163
(% of AGI for various income ranges: 1.7% for AGIs below $25k, 1.1% for AGIs $25k-50k, 0.7% for AGIs $50k-75k, 1.0% for AGIs $75k-100k, 0.8% for AGIs $100k-200k, 3.4% for AGIs over 200k)
Net capital gain/loss in AGI: +$6,654 (reported on 16.1% of returns)
Here:
+$6,654
State:
+$21,568
(% of AGI for various income ranges: 0.2% for AGIs $50k-75k, 1.1% for AGIs $75k-100k, 1.4% for AGIs $100k-200k, 6.5% for AGIs over 200k)
Profit/loss from business: +$10,437 (reported on 14.5% of returns)
Here:
+$10,437
State:
+$16,521
(% of AGI for various income ranges: 5.5% for AGIs below $25k, 3.1% for AGIs $25k-50k, 1.7% for AGIs $50k-75k, 1.6% for AGIs $75k-100k, 2.4% for AGIs $100k-200k, 2.6% for AGIs over 200k)
Taxable individual retirement arrangement distribution: $15,800 (reported on 9.8% of returns)
99021:
$15,800
Washington:
$18,648
(% of AGI for various income ranges: 3.8% for AGIs below $25k, 3.1% for AGIs $25k-50k, 2.6% for AGIs $50k-75k, 2.4% for AGIs $75k-100k, 3.6% for AGIs $100k-200k)
Total itemized deductions: $20,315 (20% of AGI, reported on 33.8% of returns)
Here:
$20,315
State:
$23,872
Here:
20.1% of AGI
State:
18.2% of AGI
(% of AGI for various income ranges: 8.6% for AGIs below $25k, 11.9% for AGIs $25k-50k, 13.0% for AGIs $50k-75k, 13.2% for AGIs $75k-100k, 12.0% for AGIs $100k-200k, 8.3% for AGIs over 200k)
Charity contributions: $4,506 (reported on 27.0% of returns)
Here:
$4,506
State:
$4,465
(% of AGI for various income ranges: 0.7% for AGIs below $25k, 1.1% for AGIs $25k-50k, 2.0% for AGIs $50k-75k, 2.4% for AGIs $75k-100k, 2.0% for AGIs $100k-200k, 3.0% for AGIs over 200k)
Taxes paid: $5,134 (reported on 33.3% of returns)
99021:
$5,134
State:
$6,400
(% of AGI for various income ranges: 1.5% for AGIs below $25k, 2.4% for AGIs $25k-50k, 3.1% for AGIs $50k-75k, 3.3% for AGIs $75k-100k, 3.3% for AGIs $100k-200k, 2.3% for AGIs over 200k)
Earned income credit: $2,117 (reported on 13.8% of returns)
Here:
$2,117
State:
$2,073
(% of AGI for various income ranges: 4.9% for AGIs below $25k, 1.0% for AGIs $25k-50k)
Percentage of individuals using paid preparers for their 2012 taxes: 42.2%
Here:
42%
State:
43%
(% for various income ranges: 35.5% for AGIs below $25k, 42.4% for AGIs $25k-50k, 44.4% for AGIs $50k-75k, 40.4% for AGIs $75k-100k, 50.0% for AGIs $100k-200k, 83.3% for AGIs over 200k)
Averages for the 2004 tax year for zip code 99021, filed in 2005:
Average Adjusted Gross Income (AGI) in 2004: $47,650 (Individual Income Tax Returns)
Here:
$47,650
State:
$54,331
Salary/wage: $43,291 (reported on 85.6% of returns)
Here:
$43,291
State:
$45,761
(% of AGI for various income ranges: 205.4% for AGIs below $10k, 76.5% for AGIs $10k-25k, 78.7% for AGIs $25k-50k, 83.4% for AGIs $50k-75k, 84.8% for AGIs $75k-100k, 67.3% for AGIs over 100k)
Taxable interest for individuals: $1,166 (reported on 48.9% of returns)
This zip code:
$1,166
Washington:
$2,110
(% of AGI for various income ranges: 8.4% for AGIs below $10k, 1.9% for AGIs $10k-25k, 1.3% for AGIs $25k-50k, 1.0% for AGIs $50k-75k, 0.6% for AGIs $75k-100k, 1.2% for AGIs over 100k)
Taxable dividends: $2,228 (reported on 23.9% of returns)
Here:
$2,228
State:
$5,879
(% of AGI for various income ranges: 10.1% for AGIs below $10k, 1.2% for AGIs $10k-25k, 1.1% for AGIs $25k-50k, 0.8% for AGIs $50k-75k, 0.8% for AGIs $75k-100k, 1.2% for AGIs over 100k)
Net capital gain/loss: +$8,936 (reported on 22.0% of returns)
Here:
+$8,936
State:
+$15,835
(% of AGI for various income ranges: 1.7% for AGIs below $10k, 0.0% for AGIs $10k-25k, 0.9% for AGIs $25k-50k, 0.9% for AGIs $50k-75k, 1.1% for AGIs $75k-100k, 10.1% for AGIs over 100k)
Profit/loss from business: +$8,597 (reported on 15.1% of returns)
Here:
+$8,597
State:
+$13,994
(% of AGI for various income ranges: -7.0% for AGIs below $10k, 3.2% for AGIs $10k-25k, 2.8% for AGIs $25k-50k, 2.2% for AGIs $50k-75k, 1.8% for AGIs $75k-100k, 3.6% for AGIs over 100k)
IRA payment deduction: $3,186 (reported on 2.9% of returns)
99021:
$3,186
Washington:
$3,001
(% of AGI for various income ranges: 0.2% for AGIs $10k-25k, 0.3% for AGIs $25k-50k, 0.3% for AGIs $50k-75k, 0.1% for AGIs $75k-100k, 0.1% for AGIs over 100k)
Self-employed pension: $7,238 (reported on 0.5% of returns)
Here:
$7,238
Washington:
$14,244
Total itemized deductions: $16,869 (22% of AGI, reported on 36.8% of returns)
Here:
$16,869
State:
$19,669
Here:
21.5% of AGI
State:
20.7% of AGI
(% of AGI for various income ranges: 22.1% for AGIs below $10k, 10.6% for AGIs $10k-25k, 13.1% for AGIs $25k-50k, 15.3% for AGIs $50k-75k, 14.8% for AGIs $75k-100k, 11.1% for AGIs over 100k)
Charity contributions deductions: $2,957 (4% of AGI, reported on 32.3% of returns)
Here:
$2,957
State:
$3,569
Here:
3.6% of AGI
State:
3.5% of AGI
(% of AGI for various income ranges: 1.7% for AGIs below $10k, 0.9% for AGIs $10k-25k, 1.5% for AGIs $25k-50k, 2.4% for AGIs $50k-75k, 2.3% for AGIs $75k-100k, 2.1% for AGIs over 100k)
Total tax: $6,836 (reported on 76.2% of returns)
99021:
$6,836
State:
$9,065
(% of AGI for various income ranges: 5.0% for AGIs below $10k, 4.1% for AGIs $10k-25k, 6.0% for AGIs $25k-50k, 7.7% for AGIs $50k-75k, 9.9% for AGIs $75k-100k, 17.5% for AGIs over 100k)
Earned income credit: $1,579 (reported on 12.3% of returns)
Here:
$1,579
State:
$1,607
Percentage of individuals using paid preparers for their 2004 taxes: 44.2%
Here:
44%
State:
49%
(% for various income ranges: 35.7% for AGIs below $10k, 41.7% for AGIs $10k-25k, 47.5% for AGIs $25k-50k, 44.8% for AGIs $50k-75k, 44.4% for AGIs $75k-100k, 58.5% for AGIs over 100k)
Likely homosexual households (counted as self-reported same-sex unmarried-partner households)
Lesbian couples: 1.0% of all households
Gay men: 0.0% of all households
Household received Food Stamps/SNAP in the past 12 months: 437 Household did not receive Food Stamps/SNAP in the past 12 months: 3,137
Women who had a birth in the past 12 months: 119 (96 now married, 23 unmarried) Women who did not have a birth in the past 12 months: 1,893 (881 now married, 1,011 unmarried)
Housing units in zip code 99021 with a mortgage: 1,665 (140 second mortgage, 141 both second mortgage and home equity loan) Houses without a mortgage: 22
Median monthly owner costs for units with a mortgage: $1,837 Median monthly owner costs for units without a mortgage: $649
Residents with income below the poverty level in 2022:
This zip code:
12.0%
Whole state:
10.0%
Residents with income below 50% of the poverty level in 2022:
This zip code:
8.9%
Whole state:
4.6%
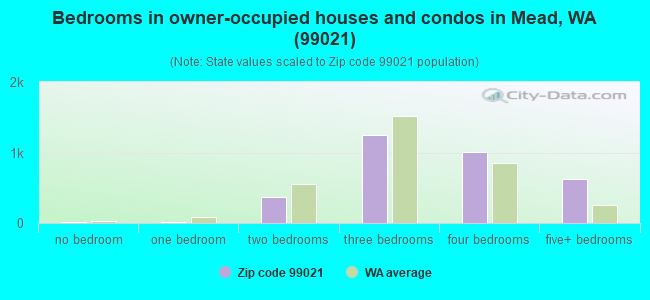
Median number of rooms in houses and condos:
Here:
7.7
State:
6.5
Median number of rooms in apartments:
Here:
5.2
State:
3.9
Notable locations in this zip code not listed on our city pages
Notable locations in zip code 99021: Green Bluff Substation (A), Camp Fosseen (B), Cooks Cabin (C), Mount Spokane Fire Station (D), Morgan Acres (E), Spokane County Fire District 4 Station 44 Colbert (F), Spokane County Fire District 4 Station 48 Mount Spokane (G), Spokane County Fire District 9 Station 92 (H). Display/hide their locations on the map
Tourist attractions (not listed on the city page) : Cat Tales Zoological Park (Cultural Attractions- Events- & Facilities; 17020 North Newport Highway) (1), Endangered Species Conservation Park (Cultural Attractions- Events- & Facilities; 17020 North Newport Highway) (2). Display/hide their approximate locations on the map
In group quarters: 8 (-1 institutionalized population)
Size of family households: 1,323 2-persons, 389 3-persons, 547 4-persons, 276 5-persons, 98 6-persons, 107 7-or-more-persons
Size of nonfamily households: 655 1-person, 139 2-persons, 11 3-persons
2,074 married couples with children.
413 single-parent households (161 men, 252 women).
95.4% of residents of 99021 zip code speak English at home.
0.9% of residents speak Spanish at home (57% very well, 26% well, 17% not well).
2.3% of residents speak other Indo-European language at home (86% very well, 9% well, 5% not well).
0.9% of residents speak Asian or Pacific Island language at home (85% very well, 15% well).
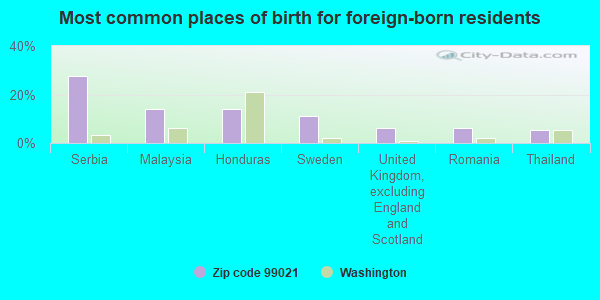
Foreign born population: 253 (2.5%) (76.9% of them are naturalized citizens)
This zip code:
2.5%
Whole state:
15.3%
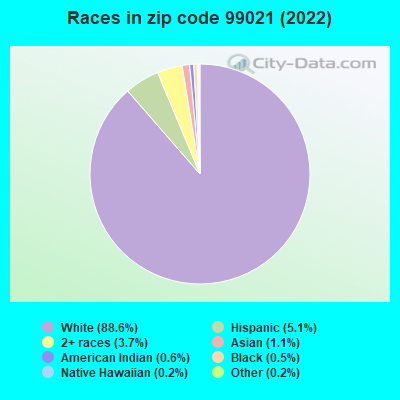
27%Serbia
14%Malaysia
14%Honduras
11%Sweden
6%United Kingdom, excluding England and Scotland
6%Romania
5%Thailand
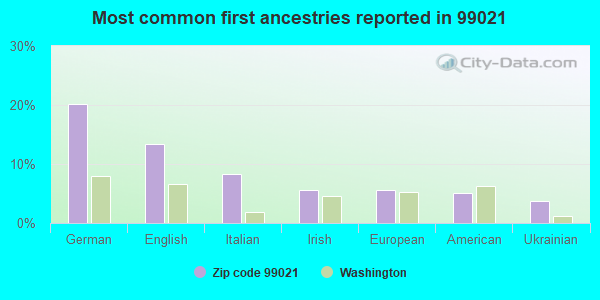
20%German
13%English
8%Italian
6%Irish
6%European
5%American
4%Ukrainian
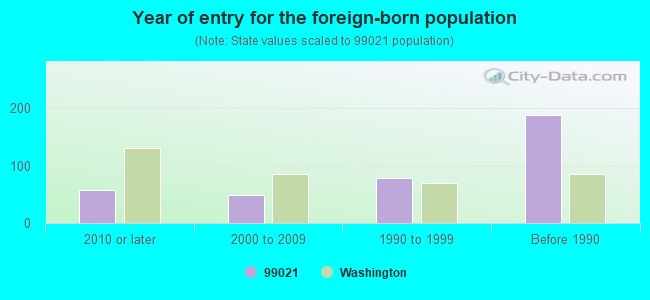
Year of entry for the foreign-born population
572010 or later
482000 to 2009
781990 to 1999
188Before 1990
Facilities with environmental interests located in this zip code:
CDC MEAD LLC (2111 E HAWTHORNE ROAD in MEAD, WA)
AIR MAJOR (AIRS/AFS) SUPERFUND NPL (Superfund database) COMPLIANCE ACTIVITY (Tracking inspections of insecticide, fungicide, and rodenticide, and toxic substances) CRITERIA AND HAZARDOUS AIR POLLUTANT INVENTORY (Inventory of air pollution sources) National Pollutant Discharge Elimination System MAJOR (Tracking pollutant discharge elimination systems) - permit HAZARDOUS WASTE BIENNIAL REPORTER (Resource Conservation and Recovery Act (tracking hazardous waste)) Small Quantity Generators, between 100 kg and 1000 kg of hazardous waste/month (Resource Conservation and Recovery Act (tracking hazardous waste)) TSD (Resource Conservation and Recovery Act (tracking hazardous waste)) TRI REPORTER (Tracking of toxic chemicals releasing facilities) STATE MASTER (Washington State Department of Ecology's Facility/Site identification system) - TOXICS-9673, UNDERGROUND STORAGE TANK PROGRAM, SWFAP-, INDUSTRIAL SITES, AIRQUAL-S0630016, AIR MAJOR, WATQUAL-WA0000876, NPDES MAJOR, HAZWASTE-WAD000065508, EPCRA, TRI REPORTER, TOXICS-WAD000065508, SUPERFUND NPL, HAZWASTE-WAD000065508, HAZARDOUS WASTE PROGRAM, INDUSTRIAL-, FORMAL ENFORCEMENT ACTION, ENFORCEMENT/COMPLIANCE ACTIVITY, HAZWASTE-WAD000065508, SQG, LQG, SWFAP-, FORMAL ENFORCEMENT ACTION Business SIC classification: PRIMARY PRODUCTION OF ALUMINUM; NONCLASSIFIABLE ESTABLISHMENTS Business NAICS classification: PRIMARY ALUMINUM PRODUCTION.; PRIMARY ALUMINUM PRODUCTION.; PRIMARY ALUMINUM PRODUCTION. Organizations: KAISER ALUMINUM & CHEMICAL CORP (CONTACT/OPERATOR)
Alternative names: KAISER ALUMINUM, KAISER ALUMINUM & CHEMICAL, KAISER ALUMINUM & CHEMICAL CORP MEAD, KAISER ALUMINUM & CHEM CORP - MEAD WORKS, KAISER ALUMINUM (MEAD WORKS), Mead Works
BONNEVILLE POWER ADMINISTRATION BELL MAINTENANCE HEADQUARTER (2410 EAST HAWTHORNE ROAD in MEAD, WA) . Federal Facility. DOE - POWER ADMINISTRATIONS
COMPLIANCE ACTIVITY (Tracking inspections of insecticide, fungicide, and rodenticide, and toxic substances) HAZARDOUS WASTE BIENNIAL REPORTER (Resource Conservation and Recovery Act (tracking hazardous waste)) Small Quantity Generators, between 100 kg and 1000 kg of hazardous waste/month (Resource Conservation and Recovery Act (tracking hazardous waste)) TRANSPORTER (Resource Conservation and Recovery Act (tracking hazardous waste)) STATE MASTER (Washington State Department of Ecology's Facility/Site identification system) - TOXICS-2859, UNDERGROUND STORAGE TANK PROGRAM, HAZWASTE-CRK000045590, EPCRA STATE MASTER (Washington State Department of Ecology's Facility/Site identification system) - HAZWASTE-WA6891406336, HAZARDOUS WASTE PROGRAM, CESQG, TOXICS-, INDEPENDENT CLEANUP, TOXICS-102468, UNDERGROUND STORAGE TANK PROGRAM Business SIC classification: POWER, DISTRIBUTION, AND SPECIALTY TRANSFORMERS; ELECTRIC SERVICES; GENERAL GOVERNMENT Business NAICS classification: ELECTRIC BULK POWER TRANSMISSION AND CONTROL.; ELECTRIC BULK POWER TRANSMISSION AND CONTROL. Organizations: US DOE BPA (CONTACT/OWNER)
Alternative names: BONNEVILLE POWER ADMINISTRATION MAINTENANCE HEADQUARTER, BONNEVILLE POWER MUNRO CONTROL UST102468, BPA BELL SUBSTATION, BPA UST 2859, US DOE BPA BELL MAINTENANCE HQ, USDOE BPA BELL MAINTENANCE HEADQUARTER, USDOE BPA BELL SUBSTATION
Housing units lacking complete plumbing facilities: 1.7%
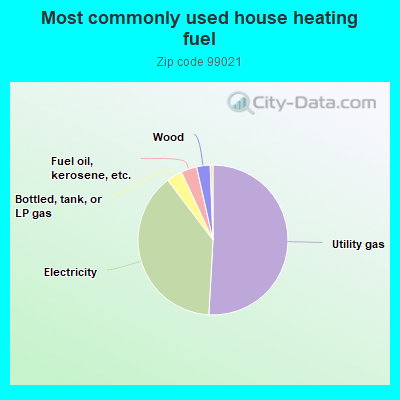
50.9%Utility gas
38.8%Electricity
3.4%Bottled, tank, or LP gas
3.4%Fuel oil, kerosene, etc.
2.9%Wood
Population in 1990: 5,903. Population change in the 1990s: +2,630 (+44.6%).
Place of birth for U.S.-born residents:
This state: 5,990
Northeast: 354
Midwest: 627
South: 388
West: 2,396
64% of the 99021 zip code residents lived in the same house 5 years ago. Out of people who lived in different houses, 60% lived in this county. Out of people who lived in different counties, 50% lived in Washington.
93% of the 99021 zip code residents lived in the same house 1 year ago. Out of people who lived in different houses, 81% moved from this county. Out of people who lived in different houses, 9% moved from different county within same state. Out of people who lived in different houses, 2% moved from different state. Out of people who lived in different houses, 11% moved from abroad.
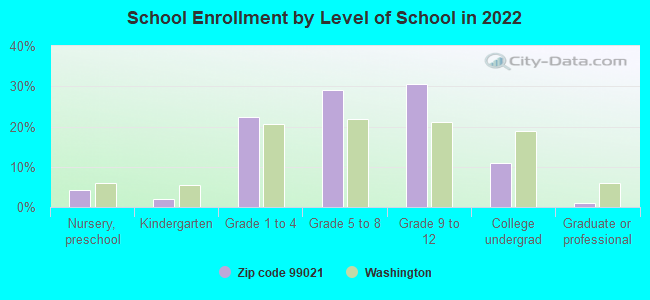
Private vs. public school enrollment:
Students in private schools in grades 1 to 8 (elementary and middle school): 315
Here:
25.9%
Washington:
12.4%
Students in private schools in grades 9 to 12 (high school): 91
Here:
12.7%
Washington:
9.2%
Students in private undergraduate colleges: 59
Here:
23.2%
Washington:
16.5%
Occupation by median earnings in the past 12 months ($)
118,955Life, physical, and social science occupations
113,507Computer and mathematical occupations
85,429Law enforcement workers including supervisors
80,080Health technologists and technicians
73,793Management occupations
72,629Community and social service occupations
Companies with federal contracts located in this zip code:
ACUSIGHT (E 5711 NANCY LANE in MEAD, WA; small business) : $68,800 in 2 contractsin 2004
$51,600 with Navy for Guns, through 30 mm. Signed on 2004-03-02. Completion date: 2004-04-01.
$17,200 with Army for Miscellaneous Weapons. Signed on 2004-04-22. Completion date: 2004-05-12.
Top industries in this zip code by the number of employees in 2005:
Educational Services: Sports and Recreation Instruction (100-249 employees: 1 establishment)
2002 - 2018 National Fire Incident Reporting System (NFIRS) incidents
Based on the data from the years 2002 - 2018 the average number of fires per year is 29. The highest number of reported fire incidents - 45 took place in 2003, and the least - 7 in 2013. The data has a decreasing trend.
When looking into fire subcategories, the most incidents belonged to: Outside Fires (47.4%), and Structure Fires (32.2%).
Fire incident types reported to NFIRS in Zip Code 99021


 Nearest zip codes: 99003, 99025, 99217, 99027, 99216, 99005.
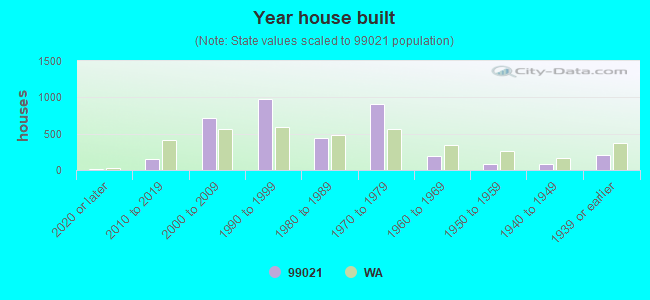


 Based on the data from the years 2002 - 2018 the average number of fires per year is 29. The highest number of reported fire incidents - 45 took place in 2003, and the least - 7 in 2013. The data has a decreasing trend.
 When looking into fire subcategories, the most incidents belonged to: Outside Fires (47.4%), and Structure Fires (32.2%).