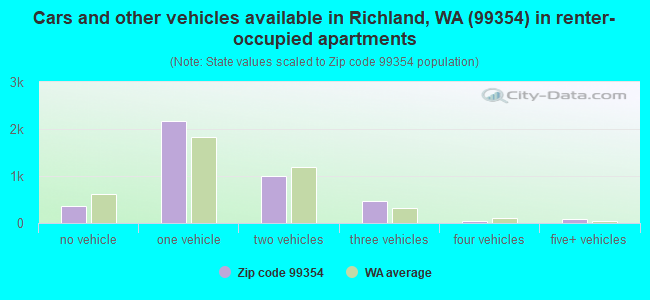
Houses and condos: 11,098 Renter-occupied apartments: 4,116
% of renters here:
39%
State:
36%
March 2022 cost of living index in zip code 99354: 88.7 (less than average, U.S. average is 100)
Land area: 20.3 sq. mi. Water area: 0.1 sq. mi.
Population density: 1,280 people per square mile
(low).
OSM Map
Google Map
MSN Map
OSM Map
General Map
Google Map
MSN Map
OSM Map
Google Map
MSN Map
OSM Map
Google Map
MSN Map
Please wait while loading the map...
Real estate property taxes paid for housing units in 2022:
This zip code:
0.7% ($2,918)
Washington:
0.8% ($4,283)
Median real estate property taxes paid for housing units with mortgages in 2022: $2,818 (0.7%) Median real estate property taxes paid for housing units with no mortgage in 2022: $3,084 (0.9%)
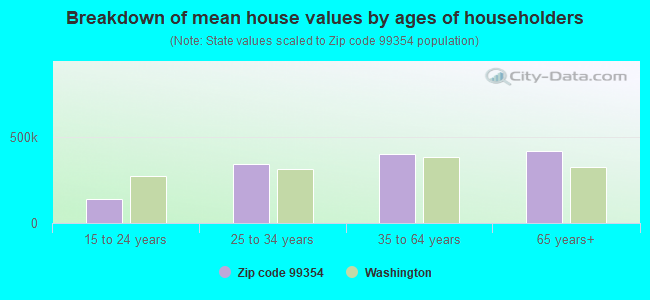
Estimated median house/condo value in 2022: $395,065
99354:
$395,065
Washington:
$569,500
According to our research of Washington and other state lists, there were 10 registered sex offenders living in 99354 zip code as of April 25, 2024. The ratio of all residents to sex offenders in zip code 99354 is 2,324 to 1. The ratio of registered sex offenders to all residents in this zip code is lower than the state average.
Median resident age:
This zip code:
34.4 years
Washington median age:
38.4 years
Average household size:
This zip code:
2.5 people
Washington:
2.5 people
Averages for the 2020 tax year for zip code 99354, filed in 2021:
Average Adjusted Gross Income (AGI) in 2020: $75,790 (Individual Income Tax Returns)
Here:
$75,790
State:
$99,264
Salary/wage: $63,606 (reported on 80.9% of returns)
Here:
$63,606
State:
$80,347
(% of AGI for various income ranges: 1143.5% for AGIs below $25k, 3344.8% for AGIs $25k-50k, 6174.5% for AGIs $50k-75k, 9090.7% for AGIs $75k-100k, 16170.6% for AGIs $100k-200k, 52334.5% for AGIs over 200k)
Taxable interest for individuals: $1,528 (reported on 35.6% of returns)
This zip code:
$1,528
Washington:
$2,077
(% of AGI for various income ranges: 12.5% for AGIs below $25k, 22.0% for AGIs $25k-50k, 53.8% for AGIs $50k-75k, 68.4% for AGIs $75k-100k, 169.9% for AGIs $100k-200k, 874.1% for AGIs over 200k)
Ordinary dividends: $7,069 (reported on 21.9% of returns)
Here:
$7,069
State:
$10,013
(% of AGI for various income ranges: 18.2% for AGIs below $25k, 38.8% for AGIs $25k-50k, 107.3% for AGIs $50k-75k, 175.5% for AGIs $75k-100k, 472.3% for AGIs $100k-200k, 3327.3% for AGIs over 200k)
Net capital gain/loss in AGI: +$14,388 (reported on 20.3% of returns)
Here:
+$14,388
State:
+$40,092
(% of AGI for various income ranges: 8.8% for AGIs below $25k, 28.1% for AGIs $25k-50k, 64.3% for AGIs $50k-75k, 165.2% for AGIs $75k-100k, 609.8% for AGIs $100k-200k, 10142.3% for AGIs over 200k)
Profit/loss from business: +$14,175 (reported on 9.7% of returns)
Here:
+$14,175
State:
+$18,312
(% of AGI for various income ranges: 74.0% for AGIs below $25k, 64.9% for AGIs $25k-50k, 137.3% for AGIs $50k-75k, 108.5% for AGIs $75k-100k, 265.1% for AGIs $100k-200k, 2910.9% for AGIs over 200k)
Taxable individual retirement arrangement distribution: $28,082 (reported on 11.7% of returns)
99354:
$28,082
Washington:
$24,221
(% of AGI for various income ranges: 58.2% for AGIs below $25k, 103.2% for AGIs $25k-50k, 235.9% for AGIs $50k-75k, 456.5% for AGIs $75k-100k, 1228.1% for AGIs $100k-200k, 4825.9% for AGIs over 200k)
Self-employed (Keogh) retirement plans: $15,033 (reported on 0.3% of returns)
99354:
$15,033
Washington:
$24,166
(% of AGI for various income ranges: 34.2% for AGIs $100k-200k)
Total itemized deductions: $34,195 (reported on 7.1% of returns)
Here:
$34,195
State:
$39,068
(% of AGI for various income ranges: 41.6% for AGIs below $25k, 87.6% for AGIs $25k-50k, 195.8% for AGIs $50k-75k, 334.6% for AGIs $75k-100k, 798.8% for AGIs $100k-200k, 4108.2% for AGIs over 200k)
Charity contributions: $14,812 (reported on 5.9% of returns)
Here:
$14,812
State:
$15,331
(% of AGI for various income ranges: 4.4% for AGIs below $25k, 16.3% for AGIs $25k-50k, 38.8% for AGIs $50k-75k, 72.6% for AGIs $75k-100k, 305.2% for AGIs $100k-200k, 2007.7% for AGIs over 200k)
Taxes paid: $6,055 (reported on 7.0% of returns)
99354:
$6,055
State:
$7,774
(% of AGI for various income ranges: 4.8% for AGIs below $25k, 12.0% for AGIs $25k-50k, 38.1% for AGIs $50k-75k, 73.0% for AGIs $75k-100k, 152.0% for AGIs $100k-200k, 593.2% for AGIs over 200k)
Earned income credit: $2,170 (reported on 12.5% of returns)
Here:
$2,170
State:
$2,020
(% of AGI for various income ranges: 75.7% for AGIs below $25k, 65.2% for AGIs $25k-50k, 1.7% for AGIs $50k-75k)
Percentage of individuals using paid preparers for their 2020 taxes: 93.4%
Here:
93%
State:
93%
(% for various income ranges: 93.5% for AGIs below $25k, 94.9% for AGIs $25k-50k, 93.8% for AGIs $50k-75k, 92.4% for AGIs $75k-100k, 92.0% for AGIs $100k-200k, 92.1% for AGIs over 200k)
Averages for the 2012 tax year for zip code 99354, filed in 2013:
Average Adjusted Gross Income (AGI) in 2012: $62,933 (Individual Income Tax Returns)
Here:
$62,933
State:
$69,533
Salary/wage: $55,344 (reported on 81.6% of returns)
Here:
$55,344
State:
$57,267
(% of AGI for various income ranges: 75.8% for AGIs below $25k, 75.9% for AGIs $25k-50k, 73.3% for AGIs $50k-75k, 71.6% for AGIs $75k-100k, 75.5% for AGIs $100k-200k, 57.4% for AGIs over 200k)
Taxable interest for individuals: $1,431 (reported on 41.2% of returns)
This zip code:
$1,431
Washington:
$1,816
(% of AGI for various income ranges: 1.4% for AGIs below $25k, 1.0% for AGIs $25k-50k, 0.8% for AGIs $50k-75k, 0.9% for AGIs $75k-100k, 0.8% for AGIs $100k-200k, 1.2% for AGIs over 200k)
Ordinary dividends: $5,915 (reported on 24.3% of returns)
Here:
$5,915
State:
$8,163
(% of AGI for various income ranges: 3.7% for AGIs below $25k, 1.6% for AGIs $25k-50k, 1.7% for AGIs $50k-75k, 1.8% for AGIs $75k-100k, 2.2% for AGIs $100k-200k, 3.4% for AGIs over 200k)
Net capital gain/loss in AGI: +$7,347 (reported on 19.2% of returns)
Here:
+$7,347
State:
+$21,568
(% of AGI for various income ranges: 0.2% for AGIs $25k-50k, 0.4% for AGIs $50k-75k, 0.6% for AGIs $75k-100k, 1.5% for AGIs $100k-200k, 9.3% for AGIs over 200k)
Profit/loss from business: +$10,839 (reported on 10.3% of returns)
Here:
+$10,839
State:
+$16,521
(% of AGI for various income ranges: 3.2% for AGIs below $25k, 1.5% for AGIs $25k-50k, 1.4% for AGIs $50k-75k, 1.0% for AGIs $75k-100k, 1.6% for AGIs $100k-200k, 2.8% for AGIs over 200k)
Taxable individual retirement arrangement distribution: $17,828 (reported on 13.5% of returns)
99354:
$17,828
Washington:
$18,648
(% of AGI for various income ranges: 3.2% for AGIs below $25k, 2.5% for AGIs $25k-50k, 3.9% for AGIs $50k-75k, 4.4% for AGIs $75k-100k, 3.8% for AGIs $100k-200k, 4.5% for AGIs over 200k)
Self-employment retirement plans: $14,050 (reported on 0.4% of returns)
99354:
$14,050
Washington:
$20,087
Total itemized deductions: $20,294 (18% of AGI, reported on 27.3% of returns)
Here:
$20,294
State:
$23,872
Here:
18.4% of AGI
State:
18.2% of AGI
(% of AGI for various income ranges: 7.7% for AGIs below $25k, 7.5% for AGIs $25k-50k, 9.6% for AGIs $50k-75k, 9.2% for AGIs $75k-100k, 9.2% for AGIs $100k-200k, 8.4% for AGIs over 200k)
Charity contributions: $6,065 (reported on 22.7% of returns)
Here:
$6,065
State:
$4,465
(% of AGI for various income ranges: 0.7% for AGIs below $25k, 1.1% for AGIs $25k-50k, 1.9% for AGIs $50k-75k, 2.2% for AGIs $75k-100k, 2.5% for AGIs $100k-200k, 3.2% for AGIs over 200k)
Taxes paid: $4,995 (reported on 27.1% of returns)
99354:
$4,995
State:
$6,400
(% of AGI for various income ranges: 1.0% for AGIs below $25k, 1.3% for AGIs $25k-50k, 2.0% for AGIs $50k-75k, 2.1% for AGIs $75k-100k, 2.4% for AGIs $100k-200k, 2.9% for AGIs over 200k)
Earned income credit: $2,205 (reported on 15.3% of returns)
Here:
$2,205
State:
$2,073
(% of AGI for various income ranges: 5.7% for AGIs below $25k, 1.2% for AGIs $25k-50k)
Percentage of individuals using paid preparers for their 2012 taxes: 37.9%
Here:
38%
State:
43%
(% for various income ranges: 33.2% for AGIs below $25k, 38.1% for AGIs $25k-50k, 37.2% for AGIs $50k-75k, 40.2% for AGIs $75k-100k, 42.9% for AGIs $100k-200k, 56.2% for AGIs over 200k)
Averages for the 2004 tax year for zip code 99354, filed in 2005:
Average Adjusted Gross Income (AGI) in 2004: $48,437 (Individual Income Tax Returns)
Here:
$48,437
State:
$54,331
Salary/wage: $43,638 (reported on 84.5% of returns)
Here:
$43,638
State:
$45,761
(% of AGI for various income ranges: 94.1% for AGIs below $10k, 75.8% for AGIs $10k-25k, 77.6% for AGIs $25k-50k, 79.1% for AGIs $50k-75k, 82.8% for AGIs $75k-100k, 69.5% for AGIs over 100k)
Taxable interest for individuals: $1,377 (reported on 53.9% of returns)
This zip code:
$1,377
Washington:
$2,110
(% of AGI for various income ranges: 3.9% for AGIs below $10k, 2.5% for AGIs $10k-25k, 1.8% for AGIs $25k-50k, 1.6% for AGIs $50k-75k, 1.2% for AGIs $75k-100k, 1.2% for AGIs over 100k)
Taxable dividends: $3,125 (reported on 27.3% of returns)
Here:
$3,125
State:
$5,879
(% of AGI for various income ranges: 2.6% for AGIs below $10k, 1.9% for AGIs $10k-25k, 1.5% for AGIs $25k-50k, 1.4% for AGIs $50k-75k, 1.7% for AGIs $75k-100k, 2.0% for AGIs over 100k)
Net capital gain/loss: +$4,657 (reported on 22.8% of returns)
Here:
+$4,657
State:
+$15,835
(% of AGI for various income ranges: -1.1% for AGIs below $10k, 0.3% for AGIs $10k-25k, 0.6% for AGIs $25k-50k, 0.5% for AGIs $50k-75k, 1.4% for AGIs $75k-100k, 4.8% for AGIs over 100k)
Profit/loss from business: +$7,919 (reported on 10.1% of returns)
Here:
+$7,919
State:
+$13,994
(% of AGI for various income ranges: 2.0% for AGIs below $10k, 1.6% for AGIs $10k-25k, 1.0% for AGIs $25k-50k, 0.6% for AGIs $50k-75k, 0.5% for AGIs $75k-100k, 3.1% for AGIs over 100k)
IRA payment deduction: $2,835 (reported on 2.3% of returns)
99354:
$2,835
Washington:
$3,001
(% of AGI for various income ranges: 0.2% for AGIs $10k-25k, 0.2% for AGIs $25k-50k, 0.1% for AGIs $50k-75k, 0.2% for AGIs $75k-100k, 0.1% for AGIs over 100k)
Self-employed pension: $12,667 (reported on 0.5% of returns)
Here:
$12,667
Washington:
$14,244
Total itemized deductions: $16,204 (20% of AGI, reported on 29.0% of returns)
Here:
$16,204
State:
$19,669
Here:
20.0% of AGI
State:
20.7% of AGI
(% of AGI for various income ranges: 6.1% for AGIs below $10k, 8.3% for AGIs $10k-25k, 8.9% for AGIs $25k-50k, 10.6% for AGIs $50k-75k, 11.7% for AGIs $75k-100k, 9.0% for AGIs over 100k)
Charity contributions deductions: $4,179 (5% of AGI, reported on 25.5% of returns)
Here:
$4,179
State:
$3,569
Here:
4.9% of AGI
State:
3.5% of AGI
(% of AGI for various income ranges: 0.5% for AGIs below $10k, 0.9% for AGIs $10k-25k, 1.6% for AGIs $25k-50k, 2.0% for AGIs $50k-75k, 2.8% for AGIs $75k-100k, 2.7% for AGIs over 100k)
Total tax: $7,057 (reported on 76.7% of returns)
99354:
$7,057
State:
$9,065
(% of AGI for various income ranges: 1.8% for AGIs below $10k, 3.8% for AGIs $10k-25k, 6.8% for AGIs $25k-50k, 9.5% for AGIs $50k-75k, 10.8% for AGIs $75k-100k, 16.4% for AGIs over 100k)
Earned income credit: $1,696 (reported on 13.2% of returns)
Here:
$1,696
State:
$1,607
Percentage of individuals using paid preparers for their 2004 taxes: 43.2%
Here:
43%
State:
49%
(% for various income ranges: 33.2% for AGIs below $10k, 47.5% for AGIs $10k-25k, 48.6% for AGIs $25k-50k, 45.0% for AGIs $50k-75k, 40.7% for AGIs $75k-100k, 41.0% for AGIs over 100k)
Household received Food Stamps/SNAP in the past 12 months: 1,239 Household did not receive Food Stamps/SNAP in the past 12 months: 9,283
Women who had a birth in the past 12 months: 258 (192 now married, 64 unmarried) Women who did not have a birth in the past 12 months: 5,713 (2,052 now married, 3,675 unmarried)
Housing units in zip code 99354 with a mortgage: 3,668 (193 second mortgage, 158 both second mortgage and home equity loan) Houses without a mortgage: 29
Median monthly owner costs for units with a mortgage: $1,695 Median monthly owner costs for units without a mortgage: $620
Residents with income below the poverty level in 2022:
This zip code:
8.4%
Whole state:
10.0%
Residents with income below 50% of the poverty level in 2022:
This zip code:
4.1%
Whole state:
4.6%
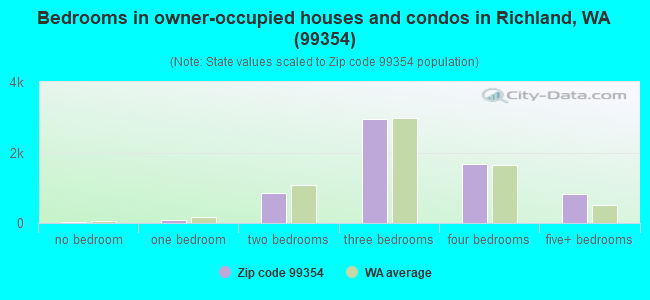
Median number of rooms in houses and condos:
Here:
6.7
State:
6.5
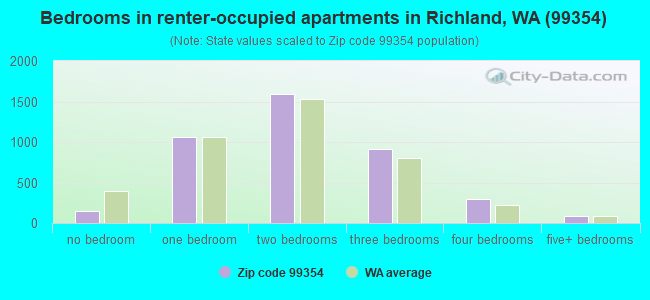
Median number of rooms in apartments:
Here:
4.3
State:
3.9
Notable locations in this zip code not listed on our city pages
Notable locations in zip code 99354: Buckskin Golf Club (A), Horn Rapids Desert Style Golf Course (B), Richland Fire Dept Station 73 (C). Display/hide their locations on the map
Parks in zip code 99354 include: Westwood Park (1), Leslie Groves Park (2), Jefferson Park (3), W E Johnson Park (4). Display/hide their locations on the map
3,565 married couples with children.
2,163 single-parent households (609 men, 1,554 women).
86.1% of residents of 99354 zip code speak English at home.
7.3% of residents speak Spanish at home (65% very well, 21% well, 15% not well).
2.5% of residents speak other Indo-European language at home (68% very well, 14% well, 14% not well, 3% not at all).
3.5% of residents speak Asian or Pacific Island language at home (76% very well, 13% well, 11% not well).
0.3% of residents speak other language at home (100% very well).
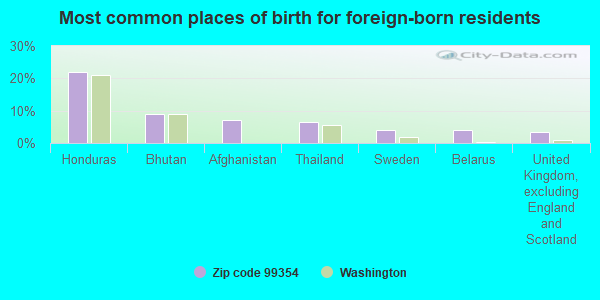
Foreign born population: 2,190 (8.4%) (46.4% of them are naturalized citizens)
This zip code:
8.4%
Whole state:
15.3%
22%Honduras
9%Bhutan
7%Afghanistan
7%Thailand
4%Sweden
4%Belarus
3%United Kingdom, excluding England and Scotland
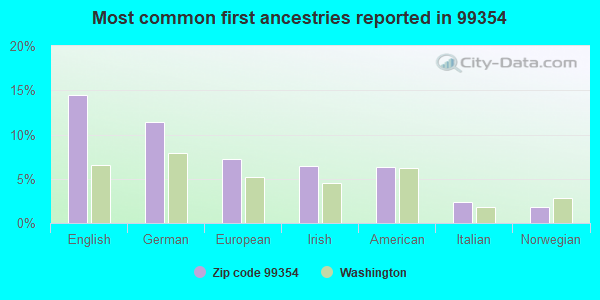
15%English
11%German
7%European
6%Irish
6%American
2%Italian
2%Norwegian
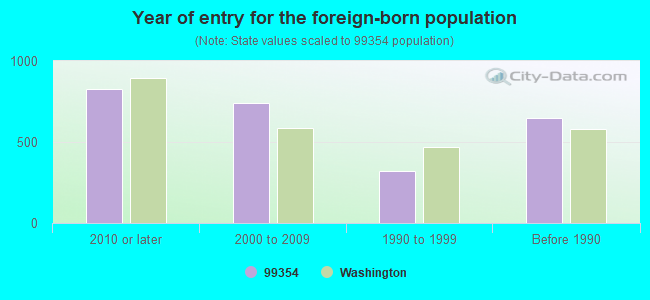
Year of entry for the foreign-born population
8252010 or later
7432000 to 2009
3191990 to 1999
649Before 1990
Housing units lacking complete plumbing facilities: 0.1% Housing units lacking complete kitchen facilities: 0.7%
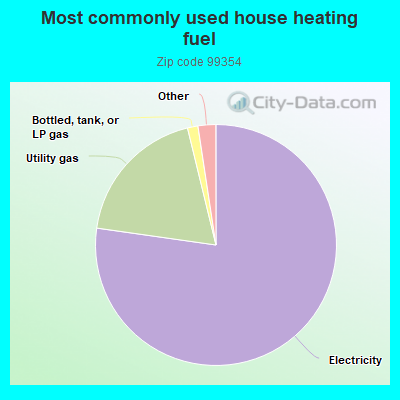
77.4%Electricity
19.0%Utility gas
1.4%Bottled, tank, or LP gas
0.8%Wood
0.6%Solar energy
0.6%No fuel used
Place of birth for U.S.-born residents:
This state: 12,898
Northeast: 956
Midwest: 1,938
South: 1,913
West: 5,669
89% of the 99354 zip code residents lived in the same house 1 year ago. Out of people who lived in different houses, 53% moved from this county. Out of people who lived in different houses, 16% moved from different county within same state. Out of people who lived in different houses, 30% moved from different state. Out of people who lived in different houses, 4% moved from abroad.
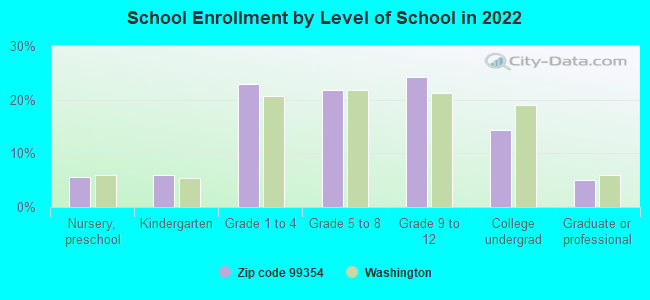
Private vs. public school enrollment:
Students in private schools in grades 1 to 8 (elementary and middle school): 332
Here:
11.6%
Washington:
12.4%
Students in private schools in grades 9 to 12 (high school): 62
Here:
4.0%
Washington:
9.2%
Students in private undergraduate colleges: 21
Here:
2.3%
Washington:
16.5%
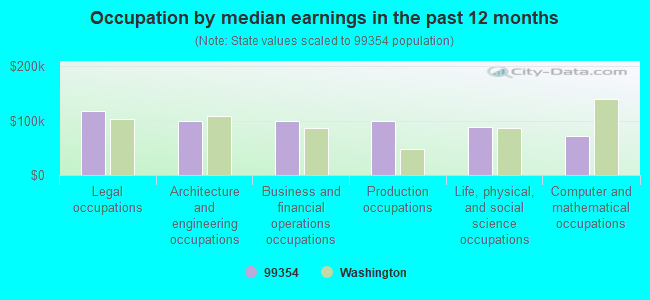
Occupation by median earnings in the past 12 months ($)
116,769Legal occupations
100,099Architecture and engineering occupations
98,907Business and financial operations occupations
98,574Production occupations
87,829Life, physical, and social science occupations
71,071Computer and mathematical occupations
Companies with federal contracts located in this zip code:
INNOVATEK, INC (350 HILLS STREET in RICHLAND, WA; small business) : $2,633,033 in 21 contractsfrom 2000 to 2006
Contracts for Other Defense -- Management and Support (R&D), Biomedical -- Applied Research and Exploratory Development (R&D), Other Defense -- Operational Systems Development (R&D), Other Research and Development -- Engineering Development (R&D), and moreby Army, Navy, Office of Policy, Management and Budget/Chief Financial Officer, Air Force, and others Signed by year:2000: $69,998; 2001: $659,985; 2002: $519,926; 2003: $464,309; 2004: $485,688; 2005: $403,128; 2006: $29,999.
Biggest contracts:
$414,309 with Army for Other Defense -- Management and Support (R&D). Signed on 2003-11-06. Completion date: 2005-11-30.
$374,968 with Navy for Biomedical -- Applied Research and Exploratory Development (R&D). Signed on 2001-04-13. Completion date: 2002-10-13.
$315,690 with Army for Other Defense -- Management and Support (R&D). Signed on 2004-10-20. Completion date: 2005-11-30.
$300,000 with Navy for Other Defense -- Operational Systems Development (R&D). Signed on 2005-10-26. Completion date: 2007-10-26.
U S ECOLOGY INC (1777 TERMINAL DR in RICHLAND, WA; small business) : $1,164,784 in 48 contractsfrom 2004 to 2005
Contracts for Maintenance, Repair or Alteration of Real Property -- EPG Facilities - Nuclear, Development of Environmental Impact Statements and Assessments by Navy, Army Signed by year:2000: $0; 2001: $0; 2002: $0; 2003: $0; 2004: $306,599; 2005: $858,185; 2006: $0.
Biggest contracts:
$139,543 with Navy for Maintenance, Repair or Alteration of Real Property -- EPG Facilities - Nuclear. Signed on 2005-03-03. Completion date: 2005-03-31.
$138,434, same as above.Signed on 2005-09-01. Completion date: 2005-12-31.
$137,242, same as above.Signed on 2005-05-13. Completion date: 2005-05-13.
$137,242, same as above.Signed on 2005-05-17. Completion date: 2005-07-31.
Top industries in this zip code by the number of employees in 2005:
Administrative and Support and Waste Management and Remediation Services: Hazardous Waste Treatment and Disposal (500-999 employees: 1 establishment)
Other Services (except Public Administration): Religious Organizations (50-99: 2, 20-49: 1, 10-19: 2, 5-9: 3, 1-4: 4)
Professional, Scientific, and Technical Services: Other Scientific and Technical Consulting Services (50-99: 1, 1-4: 2)
Educational Services: Elementary and Secondary Schools (50-99: 1)
Administrative and Support and Waste Management and Remediation Services: Landscaping Services (20-49: 1, 1-4: 1)
Health Care and Social Assistance: Offices of Dentists (20-49: 1)
Professional, Scientific, and Technical Services: Research and Development in the Physical, Engineering, and Life Sciences (20-49: 1)
Health Care and Social Assistance: Homes for the Elderly (20-49: 1)
Fatal accident statistics in 2013:
Fatal accident count: 1
Vehicles involved in fatal accidents: 3
Fatal accidents caused by drunken drivers: 1
Fatalities: 1
Persons involved in fatal accidents: 4
Pedestrians involved in fatal accidents: 0
Fatal accident statistics in 2010:
Fatal accident count: 1
Vehicles involved in fatal accidents: 2
Fatal accidents caused by drunken drivers: 1
Fatalities: 1
Persons involved in fatal accidents: 2
Pedestrians involved in fatal accidents: 0
2005 - 2018 National Fire Incident Reporting System (NFIRS) incidents
Based on the data from the years 2005 - 2018 the average number of fires per year is 65. The highest number of fire incidents - 106 took place in 2018, and the least - 12 in 2005. The data has an increasing trend.
When looking into fire subcategories, the most incidents belonged to: Outside Fires (45.8%), and Structure Fires (34.1%).
Fire incident types reported to NFIRS in Zip Code 99354


 : $2,633,033 in 21 contracts from 2000 to 2006
 Based on the data from the years 2005 - 2018 the average number of fires per year is 65. The highest number of fire incidents - 106 took place in 2018, and the least - 12 in 2005. The data has an increasing trend.
 When looking into fire subcategories, the most incidents belonged to: Outside Fires (45.8%), and Structure Fires (34.1%).