Central Point, Oregon Submit your own pictures of this city and show them to the world
OSM Map
General Map
Google Map
MSN Map
OSM Map
General Map
Google Map
MSN Map
OSM Map
General Map
Google Map
MSN Map
OSM Map
General Map
Google Map
MSN Map
Please wait while loading the map...
Population in 2022: 19,222 (100% urban, 0% rural). Population change since 2000: +53.9%Males: 9,160 Females: 10,062
March 2022 cost of living index in Central Point: 97.5 (near average, U.S. average is 100) Percentage of residents living in poverty in 2022: 8.5%for White Non-Hispanic residents , 6.8% for Hispanic or Latino residents , 22.1% for American Indian residents , 17.0% for other race residents , 1.6% for two or more races residents )
Profiles of local businesses
Business Search - 14 Million verified businesses
Data:
Median household income ($)
Median household income (% change since 2000)
Household income diversity
Ratio of average income to average house value (%)
Ratio of average income to average rent
Median household income ($) - White
Median household income ($) - Black or African American
Median household income ($) - Asian
Median household income ($) - Hispanic or Latino
Median household income ($) - American Indian and Alaska Native
Median household income ($) - Multirace
Median household income ($) - Other Race
Median household income for houses/condos with a mortgage ($)
Median household income for apartments without a mortgage ($)
Races - White alone (%)
Races - White alone (% change since 2000)
Races - Black alone (%)
Races - Black alone (% change since 2000)
Races - American Indian alone (%)
Races - American Indian alone (% change since 2000)
Races - Asian alone (%)
Races - Asian alone (% change since 2000)
Races - Hispanic (%)
Races - Hispanic (% change since 2000)
Races - Native Hawaiian and Other Pacific Islander alone (%)
Races - Native Hawaiian and Other Pacific Islander alone (% change since 2000)
Races - Two or more races (%)
Races - Two or more races (% change since 2000)
Races - Other race alone (%)
Races - Other race alone (% change since 2000)
Racial diversity
Unemployment (%)
Unemployment (% change since 2000)
Unemployment (%) - White
Unemployment (%) - Black or African American
Unemployment (%) - Asian
Unemployment (%) - Hispanic or Latino
Unemployment (%) - American Indian and Alaska Native
Unemployment (%) - Multirace
Unemployment (%) - Other Race
Population density (people per square mile)
Population - Males (%)
Population - Females (%)
Population - Males (%) - White
Population - Males (%) - Black or African American
Population - Males (%) - Asian
Population - Males (%) - Hispanic or Latino
Population - Males (%) - American Indian and Alaska Native
Population - Males (%) - Multirace
Population - Males (%) - Other Race
Population - Females (%) - White
Population - Females (%) - Black or African American
Population - Females (%) - Asian
Population - Females (%) - Hispanic or Latino
Population - Females (%) - American Indian and Alaska Native
Population - Females (%) - Multirace
Population - Females (%) - Other Race
Coronavirus confirmed cases (May 19, 2024)
Deaths caused by coronavirus (May 19, 2024)
Coronavirus confirmed cases (per 100k population) (May 19, 2024)
Deaths caused by coronavirus (per 100k population) (May 19, 2024)
Daily increase in number of cases (May 19, 2024)
Weekly increase in number of cases (May 19, 2024)
Cases doubled (in days) (May 19, 2024)
Hospitalized patients (Apr 18, 2022)
Negative test results (Apr 18, 2022)
Total test results (Apr 18, 2022)
COVID Vaccine doses distributed (per 100k population) (Sep 19, 2023)
COVID Vaccine doses administered (per 100k population) (Sep 19, 2023)
COVID Vaccine doses distributed (Sep 19, 2023)
COVID Vaccine doses administered (Sep 19, 2023)
Likely homosexual households (%)
Likely homosexual households (% change since 2000)
Likely homosexual households - Lesbian couples (%)
Likely homosexual households - Lesbian couples (% change since 2000)
Likely homosexual households - Gay men (%)
Likely homosexual households - Gay men (% change since 2000)
Cost of living index
Median gross rent ($)
Median contract rent ($)
Median monthly housing costs ($)
Median house or condo value ($)
Median house or condo value ($ change since 2000)
Mean house or condo value by units in structure - 1, detached ($)
Mean house or condo value by units in structure - 1, attached ($)
Mean house or condo value by units in structure - 2 ($)
Mean house or condo value by units in structure by units in structure - 3 or 4 ($)
Mean house or condo value by units in structure - 5 or more ($)
Mean house or condo value by units in structure - Boat, RV, van, etc. ($)
Mean house or condo value by units in structure - Mobile home ($)
Median house or condo value ($) - White
Median house or condo value ($) - Black or African American
Median house or condo value ($) - Asian
Median house or condo value ($) - Hispanic or Latino
Median house or condo value ($) - American Indian and Alaska Native
Median house or condo value ($) - Multirace
Median house or condo value ($) - Other Race
Median resident age
Resident age diversity
Median resident age - Males
Median resident age - Females
Median resident age - White
Median resident age - Black or African American
Median resident age - Asian
Median resident age - Hispanic or Latino
Median resident age - American Indian and Alaska Native
Median resident age - Multirace
Median resident age - Other Race
Median resident age - Males - White
Median resident age - Males - Black or African American
Median resident age - Males - Asian
Median resident age - Males - Hispanic or Latino
Median resident age - Males - American Indian and Alaska Native
Median resident age - Males - Multirace
Median resident age - Males - Other Race
Median resident age - Females - White
Median resident age - Females - Black or African American
Median resident age - Females - Asian
Median resident age - Females - Hispanic or Latino
Median resident age - Females - American Indian and Alaska Native
Median resident age - Females - Multirace
Median resident age - Females - Other Race
Commute - mean travel time to work (minutes)
Travel time to work - Less than 5 minutes (%)
Travel time to work - Less than 5 minutes (% change since 2000)
Travel time to work - 5 to 9 minutes (%)
Travel time to work - 5 to 9 minutes (% change since 2000)
Travel time to work - 10 to 19 minutes (%)
Travel time to work - 10 to 19 minutes (% change since 2000)
Travel time to work - 20 to 29 minutes (%)
Travel time to work - 20 to 29 minutes (% change since 2000)
Travel time to work - 30 to 39 minutes (%)
Travel time to work - 30 to 39 minutes (% change since 2000)
Travel time to work - 40 to 59 minutes (%)
Travel time to work - 40 to 59 minutes (% change since 2000)
Travel time to work - 60 to 89 minutes (%)
Travel time to work - 60 to 89 minutes (% change since 2000)
Travel time to work - 90 or more minutes (%)
Travel time to work - 90 or more minutes (% change since 2000)
Marital status - Never married (%)
Marital status - Now married (%)
Marital status - Separated (%)
Marital status - Widowed (%)
Marital status - Divorced (%)
Median family income ($)
Median family income (% change since 2000)
Median non-family income ($)
Median non-family income (% change since 2000)
Median per capita income ($)
Median per capita income (% change since 2000)
Median family income ($) - White
Median family income ($) - Black or African American
Median family income ($) - Asian
Median family income ($) - Hispanic or Latino
Median family income ($) - American Indian and Alaska Native
Median family income ($) - Multirace
Median family income ($) - Other Race
Median year house/condo built
Median year apartment built
Year house built - Built 2005 or later (%)
Year house built - Built 2000 to 2004 (%)
Year house built - Built 1990 to 1999 (%)
Year house built - Built 1980 to 1989 (%)
Year house built - Built 1970 to 1979 (%)
Year house built - Built 1960 to 1969 (%)
Year house built - Built 1950 to 1959 (%)
Year house built - Built 1940 to 1949 (%)
Year house built - Built 1939 or earlier (%)
Average household size
Household density (households per square mile)
Average household size - White
Average household size - Black or African American
Average household size - Asian
Average household size - Hispanic or Latino
Average household size - American Indian and Alaska Native
Average household size - Multirace
Average household size - Other Race
Occupied housing units (%)
Vacant housing units (%)
Owner occupied housing units (%)
Renter occupied housing units (%)
Vacancy status - For rent (%)
Vacancy status - For sale only (%)
Vacancy status - Rented or sold, not occupied (%)
Vacancy status - For seasonal, recreational, or occasional use (%)
Vacancy status - For migrant workers (%)
Vacancy status - Other vacant (%)
Residents with income below the poverty level (%)
Residents with income below 50% of the poverty level (%)
Children below poverty level (%)
Poor families by family type - Married-couple family (%)
Poor families by family type - Male, no wife present (%)
Poor families by family type - Female, no husband present (%)
Poverty status for native-born residents (%)
Poverty status for foreign-born residents (%)
Poverty among high school graduates not in families (%)
Poverty among people who did not graduate high school not in families (%)
Residents with income below the poverty level (%) - White
Residents with income below the poverty level (%) - Black or African American
Residents with income below the poverty level (%) - Asian
Residents with income below the poverty level (%) - Hispanic or Latino
Residents with income below the poverty level (%) - American Indian and Alaska Native
Residents with income below the poverty level (%) - Multirace
Residents with income below the poverty level (%) - Other Race
Air pollution - Air Quality Index (AQI)
Air pollution - CO
Air pollution - NO2
Air pollution - SO2
Air pollution - Ozone
Air pollution - PM10
Air pollution - PM25
Air pollution - Pb
Crime - Murders per 100,000 population
Crime - Rapes per 100,000 population
Crime - Robberies per 100,000 population
Crime - Assaults per 100,000 population
Crime - Burglaries per 100,000 population
Crime - Thefts per 100,000 population
Crime - Auto thefts per 100,000 population
Crime - Arson per 100,000 population
Crime - City-data.com crime index
Crime - Violent crime index
Crime - Property crime index
Crime - Murders per 100,000 population (5 year average)
Crime - Rapes per 100,000 population (5 year average)
Crime - Robberies per 100,000 population (5 year average)
Crime - Assaults per 100,000 population (5 year average)
Crime - Burglaries per 100,000 population (5 year average)
Crime - Thefts per 100,000 population (5 year average)
Crime - Auto thefts per 100,000 population (5 year average)
Crime - Arson per 100,000 population (5 year average)
Crime - City-data.com crime index (5 year average)
Crime - Violent crime index (5 year average)
Crime - Property crime index (5 year average)
1996 Presidential Elections Results (%) - Democratic Party (Clinton)
1996 Presidential Elections Results (%) - Republican Party (Dole)
1996 Presidential Elections Results (%) - Other
2000 Presidential Elections Results (%) - Democratic Party (Gore)
2000 Presidential Elections Results (%) - Republican Party (Bush)
2000 Presidential Elections Results (%) - Other
2004 Presidential Elections Results (%) - Democratic Party (Kerry)
2004 Presidential Elections Results (%) - Republican Party (Bush)
2004 Presidential Elections Results (%) - Other
2008 Presidential Elections Results (%) - Democratic Party (Obama)
2008 Presidential Elections Results (%) - Republican Party (McCain)
2008 Presidential Elections Results (%) - Other
2012 Presidential Elections Results (%) - Democratic Party (Obama)
2012 Presidential Elections Results (%) - Republican Party (Romney)
2012 Presidential Elections Results (%) - Other
2016 Presidential Elections Results (%) - Democratic Party (Clinton)
2016 Presidential Elections Results (%) - Republican Party (Trump)
2016 Presidential Elections Results (%) - Other
2020 Presidential Elections Results (%) - Democratic Party (Biden)
2020 Presidential Elections Results (%) - Republican Party (Trump)
2020 Presidential Elections Results (%) - Other
Ancestries Reported - Arab (%)
Ancestries Reported - Czech (%)
Ancestries Reported - Danish (%)
Ancestries Reported - Dutch (%)
Ancestries Reported - English (%)
Ancestries Reported - French (%)
Ancestries Reported - French Canadian (%)
Ancestries Reported - German (%)
Ancestries Reported - Greek (%)
Ancestries Reported - Hungarian (%)
Ancestries Reported - Irish (%)
Ancestries Reported - Italian (%)
Ancestries Reported - Lithuanian (%)
Ancestries Reported - Norwegian (%)
Ancestries Reported - Polish (%)
Ancestries Reported - Portuguese (%)
Ancestries Reported - Russian (%)
Ancestries Reported - Scotch-Irish (%)
Ancestries Reported - Scottish (%)
Ancestries Reported - Slovak (%)
Ancestries Reported - Subsaharan African (%)
Ancestries Reported - Swedish (%)
Ancestries Reported - Swiss (%)
Ancestries Reported - Ukrainian (%)
Ancestries Reported - United States (%)
Ancestries Reported - Welsh (%)
Ancestries Reported - West Indian (%)
Ancestries Reported - Other (%)
Educational Attainment - No schooling completed (%)
Educational Attainment - Less than high school (%)
Educational Attainment - High school or equivalent (%)
Educational Attainment - Less than 1 year of college (%)
Educational Attainment - 1 or more years of college (%)
Educational Attainment - Associate degree (%)
Educational Attainment - Bachelor's degree (%)
Educational Attainment - Master's degree (%)
Educational Attainment - Professional school degree (%)
Educational Attainment - Doctorate degree (%)
School Enrollment - Nursery, preschool (%)
School Enrollment - Kindergarten (%)
School Enrollment - Grade 1 to 4 (%)
School Enrollment - Grade 5 to 8 (%)
School Enrollment - Grade 9 to 12 (%)
School Enrollment - College undergrad (%)
School Enrollment - Graduate or professional (%)
School Enrollment - Not enrolled in school (%)
School enrollment - Public schools (%)
School enrollment - Private schools (%)
School enrollment - Not enrolled (%)
Median number of rooms in houses and condos
Median number of rooms in apartments
Housing units lacking complete plumbing facilities (%)
Housing units lacking complete kitchen facilities (%)
Density of houses
Urban houses (%)
Rural houses (%)
Households with people 60 years and over (%)
Households with people 65 years and over (%)
Households with people 75 years and over (%)
Households with one or more nonrelatives (%)
Households with no nonrelatives (%)
Population in households (%)
Family households (%)
Nonfamily households (%)
Population in families (%)
Family households with own children (%)
Median number of bedrooms in owner occupied houses
Mean number of bedrooms in owner occupied houses
Median number of bedrooms in renter occupied houses
Mean number of bedrooms in renter occupied houses
Median number of vehichles in owner occupied houses
Mean number of vehichles in owner occupied houses
Median number of vehichles in renter occupied houses
Mean number of vehichles in renter occupied houses
Mortgage status - with mortgage (%)
Mortgage status - with second mortgage (%)
Mortgage status - with home equity loan (%)
Mortgage status - with both second mortgage and home equity loan (%)
Mortgage status - without a mortgage (%)
Average family size
Average family size - White
Average family size - Black or African American
Average family size - Asian
Average family size - Hispanic or Latino
Average family size - American Indian and Alaska Native
Average family size - Multirace
Average family size - Other Race
Geographical mobility - Same house 1 year ago (%)
Geographical mobility - Moved within same county (%)
Geographical mobility - Moved from different county within same state (%)
Geographical mobility - Moved from different state (%)
Geographical mobility - Moved from abroad (%)
Place of birth - Born in state of residence (%)
Place of birth - Born in other state (%)
Place of birth - Native, outside of US (%)
Place of birth - Foreign born (%)
Housing units in structures - 1, detached (%)
Housing units in structures - 1, attached (%)
Housing units in structures - 2 (%)
Housing units in structures - 3 or 4 (%)
Housing units in structures - 5 to 9 (%)
Housing units in structures - 10 to 19 (%)
Housing units in structures - 20 to 49 (%)
Housing units in structures - 50 or more (%)
Housing units in structures - Mobile home (%)
Housing units in structures - Boat, RV, van, etc. (%)
House/condo owner moved in on average (years ago)
Renter moved in on average (years ago)
Year householder moved into unit - Moved in 1999 to March 2000 (%)
Year householder moved into unit - Moved in 1995 to 1998 (%)
Year householder moved into unit - Moved in 1990 to 1994 (%)
Year householder moved into unit - Moved in 1980 to 1989 (%)
Year householder moved into unit - Moved in 1970 to 1979 (%)
Year householder moved into unit - Moved in 1969 or earlier (%)
Means of transportation to work - Drove car alone (%)
Means of transportation to work - Carpooled (%)
Means of transportation to work - Public transportation (%)
Means of transportation to work - Bus or trolley bus (%)
Means of transportation to work - Streetcar or trolley car (%)
Means of transportation to work - Subway or elevated (%)
Means of transportation to work - Railroad (%)
Means of transportation to work - Ferryboat (%)
Means of transportation to work - Taxicab (%)
Means of transportation to work - Motorcycle (%)
Means of transportation to work - Bicycle (%)
Means of transportation to work - Walked (%)
Means of transportation to work - Other means (%)
Working at home (%)
Industry diversity
Most Common Industries - Agriculture, forestry, fishing and hunting, and mining (%)
Most Common Industries - Agriculture, forestry, fishing and hunting (%)
Most Common Industries - Mining, quarrying, and oil and gas extraction (%)
Most Common Industries - Construction (%)
Most Common Industries - Manufacturing (%)
Most Common Industries - Wholesale trade (%)
Most Common Industries - Retail trade (%)
Most Common Industries - Transportation and warehousing, and utilities (%)
Most Common Industries - Transportation and warehousing (%)
Most Common Industries - Utilities (%)
Most Common Industries - Information (%)
Most Common Industries - Finance and insurance, and real estate and rental and leasing (%)
Most Common Industries - Finance and insurance (%)
Most Common Industries - Real estate and rental and leasing (%)
Most Common Industries - Professional, scientific, and management, and administrative and waste management services (%)
Most Common Industries - Professional, scientific, and technical services (%)
Most Common Industries - Management of companies and enterprises (%)
Most Common Industries - Administrative and support and waste management services (%)
Most Common Industries - Educational services, and health care and social assistance (%)
Most Common Industries - Educational services (%)
Most Common Industries - Health care and social assistance (%)
Most Common Industries - Arts, entertainment, and recreation, and accommodation and food services (%)
Most Common Industries - Arts, entertainment, and recreation (%)
Most Common Industries - Accommodation and food services (%)
Most Common Industries - Other services, except public administration (%)
Most Common Industries - Public administration (%)
Occupation diversity
Most Common Occupations - Management, business, science, and arts occupations (%)
Most Common Occupations - Management, business, and financial occupations (%)
Most Common Occupations - Management occupations (%)
Most Common Occupations - Business and financial operations occupations (%)
Most Common Occupations - Computer, engineering, and science occupations (%)
Most Common Occupations - Computer and mathematical occupations (%)
Most Common Occupations - Architecture and engineering occupations (%)
Most Common Occupations - Life, physical, and social science occupations (%)
Most Common Occupations - Education, legal, community service, arts, and media occupations (%)
Most Common Occupations - Community and social service occupations (%)
Most Common Occupations - Legal occupations (%)
Most Common Occupations - Education, training, and library occupations (%)
Most Common Occupations - Arts, design, entertainment, sports, and media occupations (%)
Most Common Occupations - Healthcare practitioners and technical occupations (%)
Most Common Occupations - Health diagnosing and treating practitioners and other technical occupations (%)
Most Common Occupations - Health technologists and technicians (%)
Most Common Occupations - Service occupations (%)
Most Common Occupations - Healthcare support occupations (%)
Most Common Occupations - Protective service occupations (%)
Most Common Occupations - Fire fighting and prevention, and other protective service workers including supervisors (%)
Most Common Occupations - Law enforcement workers including supervisors (%)
Most Common Occupations - Food preparation and serving related occupations (%)
Most Common Occupations - Building and grounds cleaning and maintenance occupations (%)
Most Common Occupations - Personal care and service occupations (%)
Most Common Occupations - Sales and office occupations (%)
Most Common Occupations - Sales and related occupations (%)
Most Common Occupations - Office and administrative support occupations (%)
Most Common Occupations - Natural resources, construction, and maintenance occupations (%)
Most Common Occupations - Farming, fishing, and forestry occupations (%)
Most Common Occupations - Construction and extraction occupations (%)
Most Common Occupations - Installation, maintenance, and repair occupations (%)
Most Common Occupations - Production, transportation, and material moving occupations (%)
Most Common Occupations - Production occupations (%)
Most Common Occupations - Transportation occupations (%)
Most Common Occupations - Material moving occupations (%)
People in Group quarters - Institutionalized population (%)
People in Group quarters - Correctional institutions (%)
People in Group quarters - Federal prisons and detention centers (%)
People in Group quarters - Halfway houses (%)
People in Group quarters - Local jails and other confinement facilities (including police lockups) (%)
People in Group quarters - Military disciplinary barracks (%)
People in Group quarters - State prisons (%)
People in Group quarters - Other types of correctional institutions (%)
People in Group quarters - Nursing homes (%)
People in Group quarters - Hospitals/wards, hospices, and schools for the handicapped (%)
People in Group quarters - Hospitals/wards and hospices for chronically ill (%)
People in Group quarters - Hospices or homes for chronically ill (%)
People in Group quarters - Military hospitals or wards for chronically ill (%)
People in Group quarters - Other hospitals or wards for chronically ill (%)
People in Group quarters - Hospitals or wards for drug/alcohol abuse (%)
People in Group quarters - Mental (Psychiatric) hospitals or wards (%)
People in Group quarters - Schools, hospitals, or wards for the mentally retarded (%)
People in Group quarters - Schools, hospitals, or wards for the physically handicapped (%)
People in Group quarters - Institutions for the deaf (%)
People in Group quarters - Institutions for the blind (%)
People in Group quarters - Orthopedic wards and institutions for the physically handicapped (%)
People in Group quarters - Wards in general hospitals for patients who have no usual home elsewhere (%)
People in Group quarters - Wards in military hospitals for patients who have no usual home elsewhere (%)
People in Group quarters - Juvenile institutions (%)
People in Group quarters - Long-term care (%)
People in Group quarters - Homes for abused, dependent, and neglected children (%)
People in Group quarters - Residential treatment centers for emotionally disturbed children (%)
People in Group quarters - Training schools for juvenile delinquents (%)
People in Group quarters - Short-term care, detention or diagnostic centers for delinquent children (%)
People in Group quarters - Type of juvenile institution unknown (%)
People in Group quarters - Noninstitutionalized population (%)
People in Group quarters - College dormitories (includes college quarters off campus) (%)
People in Group quarters - Military quarters (%)
People in Group quarters - On base (%)
People in Group quarters - Barracks, unaccompanied personnel housing (UPH), (Enlisted/Officer), ;and similar group living quarters for military personnel (%)
People in Group quarters - Transient quarters for temporary residents (%)
People in Group quarters - Military ships (%)
People in Group quarters - Group homes (%)
People in Group quarters - Homes or halfway houses for drug/alcohol abuse (%)
People in Group quarters - Homes for the mentally ill (%)
People in Group quarters - Homes for the mentally retarded (%)
People in Group quarters - Homes for the physically handicapped (%)
People in Group quarters - Other group homes (%)
People in Group quarters - Religious group quarters (%)
People in Group quarters - Dormitories (%)
People in Group quarters - Agriculture workers' dormitories on farms (%)
People in Group quarters - Job Corps and vocational training facilities (%)
People in Group quarters - Other workers' dormitories (%)
People in Group quarters - Crews of maritime vessels (%)
People in Group quarters - Other nonhousehold living situations (%)
People in Group quarters - Other noninstitutional group quarters (%)
Residents speaking English at home (%)
Residents speaking English at home - Born in the United States (%)
Residents speaking English at home - Native, born elsewhere (%)
Residents speaking English at home - Foreign born (%)
Residents speaking Spanish at home (%)
Residents speaking Spanish at home - Born in the United States (%)
Residents speaking Spanish at home - Native, born elsewhere (%)
Residents speaking Spanish at home - Foreign born (%)
Residents speaking other language at home (%)
Residents speaking other language at home - Born in the United States (%)
Residents speaking other language at home - Native, born elsewhere (%)
Residents speaking other language at home - Foreign born (%)
Class of Workers - Employee of private company (%)
Class of Workers - Self-employed in own incorporated business (%)
Class of Workers - Private not-for-profit wage and salary workers (%)
Class of Workers - Local government workers (%)
Class of Workers - State government workers (%)
Class of Workers - Federal government workers (%)
Class of Workers - Self-employed workers in own not incorporated business and Unpaid family workers (%)
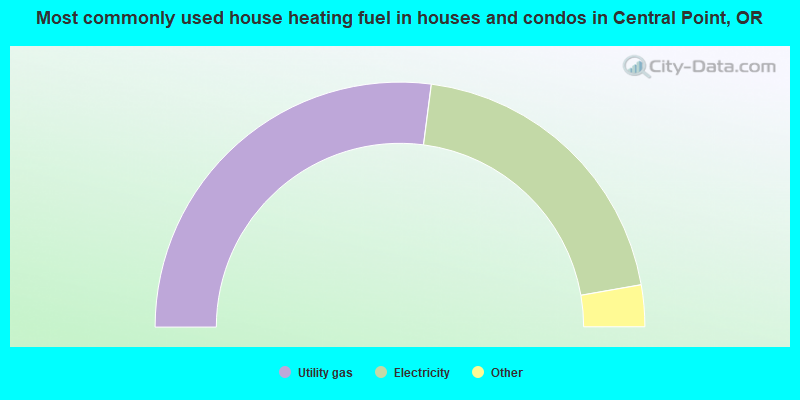
House heating fuel used in houses and condos - Utility gas (%)
House heating fuel used in houses and condos - Bottled, tank, or LP gas (%)
House heating fuel used in houses and condos - Electricity (%)
House heating fuel used in houses and condos - Fuel oil, kerosene, etc. (%)
House heating fuel used in houses and condos - Coal or coke (%)
House heating fuel used in houses and condos - Wood (%)
House heating fuel used in houses and condos - Solar energy (%)
House heating fuel used in houses and condos - Other fuel (%)
House heating fuel used in houses and condos - No fuel used (%)
House heating fuel used in apartments - Utility gas (%)
House heating fuel used in apartments - Bottled, tank, or LP gas (%)
House heating fuel used in apartments - Electricity (%)
House heating fuel used in apartments - Fuel oil, kerosene, etc. (%)
House heating fuel used in apartments - Coal or coke (%)
House heating fuel used in apartments - Wood (%)
House heating fuel used in apartments - Solar energy (%)
House heating fuel used in apartments - Other fuel (%)
House heating fuel used in apartments - No fuel used (%)
Armed forces status - In Armed Forces (%)
Armed forces status - Civilian (%)
Armed forces status - Civilian - Veteran (%)
Armed forces status - Civilian - Nonveteran (%)
Fatal accidents locations in years 2005-2021
Fatal accidents locations in 2005
Fatal accidents locations in 2006
Fatal accidents locations in 2007
Fatal accidents locations in 2008
Fatal accidents locations in 2009
Fatal accidents locations in 2010
Fatal accidents locations in 2011
Fatal accidents locations in 2012
Fatal accidents locations in 2013
Fatal accidents locations in 2014
Fatal accidents locations in 2015
Fatal accidents locations in 2016
Fatal accidents locations in 2017
Fatal accidents locations in 2018
Fatal accidents locations in 2019
Fatal accidents locations in 2020
Fatal accidents locations in 2021
Alcohol use - People drinking some alcohol every month (%)
Alcohol use - People not drinking at all (%)
Alcohol use - Average days/month drinking alcohol
Alcohol use - Average drinks/week
Alcohol use - Average days/year people drink much
Audiometry - Average condition of hearing (%)
Audiometry - People that can hear a whisper from across a quiet room (%)
Audiometry - People that can hear normal voice from across a quiet room (%)
Audiometry - Ears ringing, roaring, buzzing (%)
Audiometry - Had a job exposure to loud noise (%)
Audiometry - Had off-work exposure to loud noise (%)
Blood Pressure & Cholesterol - Has high blood pressure (%)
Blood Pressure & Cholesterol - Checking blood pressure at home (%)
Blood Pressure & Cholesterol - Frequently checking blood cholesterol (%)
Blood Pressure & Cholesterol - Has high cholesterol level (%)
Consumer Behavior - Money monthly spent on food at supermarket/grocery store
Consumer Behavior - Money monthly spent on food at other stores
Consumer Behavior - Money monthly spent on eating out
Consumer Behavior - Money monthly spent on carryout/delivered foods
Consumer Behavior - Income spent on food at supermarket/grocery store (%)
Consumer Behavior - Income spent on food at other stores (%)
Consumer Behavior - Income spent on eating out (%)
Consumer Behavior - Income spent on carryout/delivered foods (%)
Current Health Status - General health condition (%)
Current Health Status - Blood donors (%)
Current Health Status - Has blood ever tested for HIV virus (%)
Current Health Status - Left-handed people (%)
Dermatology - People using sunscreen (%)
Diabetes - Diabetics (%)
Diabetes - Had a blood test for high blood sugar (%)
Diabetes - People taking insulin (%)
Diet Behavior & Nutrition - Diet health (%)
Diet Behavior & Nutrition - Milk product consumption (# of products/month)
Diet Behavior & Nutrition - Meals not home prepared (#/week)
Diet Behavior & Nutrition - Meals from fast food or pizza place (#/week)
Diet Behavior & Nutrition - Ready-to-eat foods (#/month)
Diet Behavior & Nutrition - Frozen meals/pizza (#/month)
Drug Use - People that ever used marijuana or hashish (%)
Drug Use - Ever used hard drugs (%)
Drug Use - Ever used any form of cocaine (%)
Drug Use - Ever used heroin (%)
Drug Use - Ever used methamphetamine (%)
Health Insurance - People covered by health insurance (%)
Kidney Conditions-Urology - Avg. # of times urinating at night
Medical Conditions - People with asthma (%)
Medical Conditions - People with anemia (%)
Medical Conditions - People with psoriasis (%)
Medical Conditions - People with overweight (%)
Medical Conditions - Elderly people having difficulties in thinking or remembering (%)
Medical Conditions - People who ever received blood transfusion (%)
Medical Conditions - People having trouble seeing even with glass/contacts (%)
Medical Conditions - People with arthritis (%)
Medical Conditions - People with gout (%)
Medical Conditions - People with congestive heart failure (%)
Medical Conditions - People with coronary heart disease (%)
Medical Conditions - People with angina pectoris (%)
Medical Conditions - People who ever had heart attack (%)
Medical Conditions - People who ever had stroke (%)
Medical Conditions - People with emphysema (%)
Medical Conditions - People with thyroid problem (%)
Medical Conditions - People with chronic bronchitis (%)
Medical Conditions - People with any liver condition (%)
Medical Conditions - People who ever had cancer or malignancy (%)
Mental Health - People who have little interest in doing things (%)
Mental Health - People feeling down, depressed, or hopeless (%)
Mental Health - People who have trouble sleeping or sleeping too much (%)
Mental Health - People feeling tired or having little energy (%)
Mental Health - People with poor appetite or overeating (%)
Mental Health - People feeling bad about themself (%)
Mental Health - People who have trouble concentrating on things (%)
Mental Health - People moving or speaking slowly or too fast (%)
Mental Health - People having thoughts they would be better off dead (%)
Oral Health - Average years since last visit a dentist
Oral Health - People embarrassed because of mouth (%)
Oral Health - People with gum disease (%)
Oral Health - General health of teeth and gums (%)
Oral Health - Average days a week using dental floss/device
Oral Health - Average days a week using mouthwash for dental problem
Oral Health - Average number of teeth
Pesticide Use - Households using pesticides to control insects (%)
Pesticide Use - Households using pesticides to kill weeds (%)
Physical Activity - People doing vigorous-intensity work activities (%)
Physical Activity - People doing moderate-intensity work activities (%)
Physical Activity - People walking or bicycling (%)
Physical Activity - People doing vigorous-intensity recreational activities (%)
Physical Activity - People doing moderate-intensity recreational activities (%)
Physical Activity - Average hours a day doing sedentary activities
Physical Activity - Average hours a day watching TV or videos
Physical Activity - Average hours a day using computer
Physical Functioning - People having limitations keeping them from working (%)
Physical Functioning - People limited in amount of work they can do (%)
Physical Functioning - People that need special equipment to walk (%)
Physical Functioning - People experiencing confusion/memory problems (%)
Physical Functioning - People requiring special healthcare equipment (%)
Prescription Medications - Average number of prescription medicines taking
Preventive Aspirin Use - Adults 40+ taking low-dose aspirin (%)
Reproductive Health - Vaginal deliveries (%)
Reproductive Health - Cesarean deliveries (%)
Reproductive Health - Deliveries resulted in a live birth (%)
Reproductive Health - Pregnancies resulted in a delivery (%)
Reproductive Health - Women breastfeeding newborns (%)
Reproductive Health - Women that had a hysterectomy (%)
Reproductive Health - Women that had both ovaries removed (%)
Reproductive Health - Women that have ever taken birth control pills (%)
Reproductive Health - Women taking birth control pills (%)
Reproductive Health - Women that have ever used Depo-Provera or injectables (%)
Reproductive Health - Women that have ever used female hormones (%)
Sexual Behavior - People 18+ that ever had sex (vaginal, anal, or oral) (%)
Sexual Behavior - Males 18+ that ever had vaginal sex with a woman (%)
Sexual Behavior - Males 18+ that ever performed oral sex on a woman (%)
Sexual Behavior - Males 18+ that ever had anal sex with a woman (%)
Sexual Behavior - Males 18+ that ever had any sex with a man (%)
Sexual Behavior - Females 18+ that ever had vaginal sex with a man (%)
Sexual Behavior - Females 18+ that ever performed oral sex on a man (%)
Sexual Behavior - Females 18+ that ever had anal sex with a man (%)
Sexual Behavior - Females 18+ that ever had any kind of sex with a woman (%)
Sexual Behavior - Average age people first had sex
Sexual Behavior - Average number of female sex partners in lifetime (males 18+)
Sexual Behavior - Average number of female vaginal sex partners in lifetime (males 18+)
Sexual Behavior - Average age people first performed oral sex on a woman (18+)
Sexual Behavior - Average number of woman performed oral sex on in lifetime (18+)
Sexual Behavior - Average number of male sex partners in lifetime (males 18+)
Sexual Behavior - Average number of male anal sex partners in lifetime (males 18+)
Sexual Behavior - Average age people first performed oral sex on a man (18+)
Sexual Behavior - Average number of male oral sex partners in lifetime (18+)
Sexual Behavior - People using protection when performing oral sex (%)
Sexual Behavior - Average number of times people have vaginal or anal sex a year
Sexual Behavior - People having sex without condom (%)
Sexual Behavior - Average number of male sex partners in lifetime (females 18+)
Sexual Behavior - Average number of male vaginal sex partners in lifetime (females 18+)
Sexual Behavior - Average number of female sex partners in lifetime (females 18+)
Sexual Behavior - Circumcised males 18+ (%)
Sleep Disorders - Average hours sleeping at night
Sleep Disorders - People that has trouble sleeping (%)
Smoking-Cigarette Use - People smoking cigarettes (%)
Taste & Smell - People 40+ having problems with smell (%)
Taste & Smell - People 40+ having problems with taste (%)
Taste & Smell - People 40+ that ever had wisdom teeth removed (%)
Taste & Smell - People 40+ that ever had tonsils teeth removed (%)
Taste & Smell - People 40+ that ever had a loss of consciousness because of a head injury (%)
Taste & Smell - People 40+ that ever had a broken nose or other serious injury to face or skull (%)
Taste & Smell - People 40+ that ever had two or more sinus infections (%)
Weight - Average height (inches)
Weight - Average weight (pounds)
Weight - Average BMI
Weight - People that are obese (%)
Weight - People that ever were obese (%)
Weight - People trying to lose weight (%)
Officers per 1,000 residents here:
1.40Oregon average:
1.48
Latest news from Central Point, OR collected exclusively by city-data.com from local newspapers, TV, and radio stations
Ancestries: German (10.7%), English (9.1%), Irish (7.8%), American (5.7%), European (4.9%), Italian (4.3%).
Current Local Time:
Land area: 3.07 square miles.
Population density: 6,268 people per square mile (high).
1,198 residents are foreign born (4.8% Latin America , 1.0% Asia ).
This city:
6.3%Oregon:
9.8%
Median real estate property taxes paid for housing units with mortgages in 2022: $3,252 (0.9%)Median real estate property taxes paid for housing units with no mortgage in 2022: $2,937 (0.8%)
Nearest city with pop. 50,000+: Medford, OR
Nearest city with pop. 200,000+: Northwest Clackamas, OR (209.6 miles
Nearest city with pop. 1,000,000+: Los Angeles, CA
Nearest cities:
Latitude: 42.37 N, Longitude: 122.91 W
Daytime population change due to commuting: -5,311 (-27.9%)Workers who live and work in this city: 2,145 (21.2%)
Single-family new house construction building permits:
2022: 16 buildings , average cost: $282,0002021: 60 buildings , average cost: $240,2002020: 49 buildings , average cost: $236,9002019: 27 buildings , average cost: $252,2002018: 36 buildings , average cost: $233,3002017: 32 buildings , average cost: $207,6002016: 49 buildings , average cost: $234,6002015: 77 buildings , average cost: $203,1002014: 71 buildings , average cost: $202,2002013: 39 buildings , average cost: $195,9002012: 21 buildings , average cost: $163,4002011: 16 buildings , average cost: $155,4002010: 17 buildings , average cost: $157,3002009: 16 buildings , average cost: $149,6002008: 23 buildings , average cost: $221,7002007: 130 buildings , average cost: $179,0002006: 104 buildings , average cost: $222,9002005: 255 buildings , average cost: $203,0002004: 267 buildings , average cost: $179,8002003: 211 buildings , average cost: $167,3002002: 304 buildings , average cost: $160,0002001: 251 buildings , average cost: $148,0002000: 204 buildings , average cost: $148,2001999: 261 buildings , average cost: $132,3001998: 181 buildings , average cost: $106,2001997: 169 buildings , average cost: $89,200Unemployment in December 2023: Population change in the 1990s: +4,692 (+60.1%).
Most common occupations in Central Point, OR (%)
Both Males Females
Other sales and related occupations, including supervisors (5.8%)
Other office and administrative support workers, including supervisors (4.2%)
Other management occupations, except farmers and farm managers (4.0%)
Building and grounds cleaning and maintenance occupations (3.9%)
Retail sales workers, except cashiers (3.3%)
Cashiers (3.3%)
Electrical equipment mechanics and other installation, maintenance, and repair workers, including supervisors (3.0%)
Other sales and related occupations, including supervisors (7.2%)
Electrical equipment mechanics and other installation, maintenance, and repair workers, including supervisors (5.5%)
Building and grounds cleaning and maintenance occupations (4.9%)
Other management occupations, except farmers and farm managers (4.7%)
Other production occupations, including supervisors (4.1%)
Driver/sales workers and truck drivers (4.0%)
Retail sales workers, except cashiers (3.8%)
Other office and administrative support workers, including supervisors (7.8%)
Information and record clerks, except customer service representatives (5.6%)
Cashiers (5.2%)
Secretaries and administrative assistants (4.1%)
Other sales and related occupations, including supervisors (4.0%)
Supervisors and other personal care and service workers, except child care workers (3.8%)
Sales representatives, services, wholesale and manufacturing (3.7%)
Air pollution and air quality trends(lower is better)
AQI CO PM2.5
Earthquake activity:
Central Point-area historical earthquake activity is significantly above Oregon state average. It is 3312% greater than the overall U.S. average. On 1/31/1922 at 13:17:28, a magnitude 7.6 (7.6 UK, Class: Major, Intensity: VIII - XII) earthquake occurred 179.2 miles away from the city center On 11/8/1980 at 10:27:34, a magnitude 7.2 (6.2 MB, 7.2 MS, 7.2 MW, 7.0 ML) earthquake occurred 113.1 miles away from Central Point center On 4/18/1906 at 13:12:21, a magnitude 7.9 (7.9 UK) earthquake occurred 302.6 miles away from the city center, causing $524,000,000 total damage On 4/25/1992 at 18:06:04, a magnitude 7.2 (6.3 MB, 7.1 MS, 7.2 MW, 7.1 MW, Depth: 9.4 mi) earthquake occurred 152.4 miles away from the city center, causing $75,000,000 total damage On 8/17/1991 at 22:17:14, a magnitude 7.1 (6.2 MB, 7.1 MS, 7.1 MW, 6.8 ML, Depth: 8.4 mi) earthquake occurred 144.0 miles away from the city center On 6/15/2005 at 02:50:54, a magnitude 7.2 (7.2 MW, Depth: 9.9 mi) earthquake occurred 173.7 miles away from Central Point center Magnitude types: body-wave magnitude (MB), local magnitude (ML), surface-wave magnitude (MS), moment magnitude (MW) Natural disasters: The number of natural disasters in Jackson County (12) is smaller than the US average (15).Major Disasters (Presidential) Declared: 5Emergencies Declared: 2Fires: 5, Floods: 4, Storms: 2, Drought: 1, Heavy Rain: 1, Hurricane: 1, Landslide: 1, Mudslide: 1, Snow: 1, Wind: 1, Winter Storm: 1, Other: 1 (Note: some incidents may be assigned to more than one category). Hospitals and medical centers in Central Point: CASCADE COMMUNITY HOSPITAL (provides emergency services, 600 S SECOND ST) SIGNATURE HOME HEALTH (834 SOUTH FRONT STREET)
CENTRAL POINT CARE (155 S 1ST ST)
Amtrak stations near Central Point: 4 miles: MEDFORD (212 N. BARTLETTE ST.) - Bus Station Services: enclosed waiting area, public restrooms, public payphones, free short-term parking, call for taxi service.
17 miles: ASHLAND (STATE HWY. 99) - Bus Station Services: public payphones, free short-term parking.
Colleges/universities with over 2000 students nearest to Central Point:
Southern Oregon University (about 18 miles; Ashland, OR ; Full-time enrollment: 4,650)
Rogue Community College (about 25 miles; Grants Pass, OR ; FT enrollment: 3,600)
Oregon Institute of Technology (about 59 miles; Klamath Falls, OR ; FT enrollment: 2,900)
Lane Community College (about 114 miles; Eugene, OR ; FT enrollment: 6,373)
University of Oregon (about 116 miles; Eugene, OR ; FT enrollment: 23,329)
Humboldt State University (about 121 miles; Arcata, CA ; FT enrollment: 7,353)
Shasta College (about 125 miles; Redding, CA ; FT enrollment: 5,645)
Public high schools in Central Point:
Public elementary/middle schools in Central Point: SCENIC MIDDLE SCHOOL Students: 877, Location: 1955 SCENIC AVE, Grades: 6-8)RICHARDSON ELEMENTARY SCHOOL Students: 502, Location: 200 W PINE ST, Grades: KG-5)JEWETT ELEMENTARY SCHOOL Students: 493, Location: 1001 MANZANITA ST, Grades: KG-5)CENTRAL POINT ELEMENTARY SCHOOL Students: 472, Location: 450 S 4TH ST, Grades: KG-5)SAMS VALLEY ELEMENTARY SCHOOL Students: 245, Location: 14235 TABLE ROCK RD, Grades: KG-5)MADRONE TRAIL PUBLIC CHARTER SCHOOL Students: 64, Location: 3070 ROSS LN, Grades: KG-8, Charter school )See full list of schools located in Central Point
Notable locations in Central Point: (A) , Central Point City Hall (B) , Central Point Library (C) , Central Point Municipal Court (D) , Central Point Public Works Department (E) , Southern County Justice Court (F) , Crater Rock Museum (G) , Jackson County Fire District 3 Central Point Station (H) . Display/hide their locations on the map
Cemetery: (1) . Display/hide its location on the map
Tourist attractions:
Hotels:
Court:
Birthplace of: Basil Wolverton - Cartoonist, Mike Wilson (boxer) - Boxer.
Jackson County has a predicted average indoor radon screening level less than 2 pCi/L (pico curies per liter) - Low Potential Drinking water stations with addresses in Central Point and their reported violations in the past:
CENTRAL POINT, CITY OF (Population served: 17,025, Purch surface water):
Past monitoring violations:
Monitoring and Reporting (DBP) - Between APR-2014 and JUN-2014, Contaminant: Total Haloacetic Acids (HAA5)
Monitoring and Reporting (DBP) - Between APR-2014 and JUN-2014, Contaminant: TTHM
Population served: 170, Groundwater):
Past monitoring violations:
One routine major monitoring violation
One minor monitoring violation
Population served: 120, Groundwater):
Past monitoring violations:
Follow-up Or Routine LCR Tap M/R - In JAN-01-2005, Contaminant: Lead and Copper Rule. Follow-up actions: St Compliance achieved (JUN-05-2006)
Initial Tap Sampling for Pb and Cu - In JUL-01-1994, Contaminant: Lead and Copper Rule. Follow-up actions: St Formal NOV issued (NOV-04-1994), St Compliance achieved (2 times from NOV-18-1994 to JUN-05-2006)
Initial Tap Sampling for Pb and Cu - In JAN-01-1994, Contaminant: Lead and Copper Rule. Follow-up actions: Fed Formal NOV issued (NOV-10-1993), St Compliance achieved (2 times from NOV-14-1994 to JUN-05-2006)
One routine major monitoring violation
Population served: 100, Groundwater):
Past health violations:
MCL, Acute (TCR) - Between JUL-2008 and SEP-2008, Contaminant: Coliform. Follow-up actions: St Compliance achieved (JUL-01-2009)
MCL, Monthly (TCR) - In AUG-2006, Contaminant: Coliform. Follow-up actions: St Compliance achieved (JUL-09-2007)
MCL, Monthly (TCR) - Between JUL-2006 and SEP-2006, Contaminant: Coliform. Follow-up actions: St Compliance achieved (JUL-09-2007)
Past monitoring violations:
7 routine major monitoring violations
2 minor monitoring violations
3 regular monitoring violations
Population served: 100, Groundwater):
Past monitoring violations:
2 routine major monitoring violations
One minor monitoring violation
Population served: 75, Groundwater):
Past monitoring violations:
Follow-up Or Routine LCR Tap M/R - In OCT-01-2009, Contaminant: Lead and Copper Rule. Follow-up actions: St Violation/Reminder Notice (FEB-22-2010), St Compliance achieved (OCT-07-2010)
7 routine major monitoring violations
One regular monitoring violation
Population served: 70, Groundwater):
Past health violations:
MCL, Monthly (TCR) - In APR-2012, Contaminant: Coliform. Follow-up actions: St Public Notif received (MAY-01-2012), St Public Notif requested (MAY-23-2012), St Violation/Reminder Notice (MAY-30-2012), St Compliance achieved (JUN-07-2012), St Violation/Reminder Notice (JUN-26-2012)
MCL, Monthly (TCR) - In MAR-2007, Contaminant: Coliform. Follow-up actions: St Compliance achieved (2 times from APR-23-2008 to MAY-12-2008)
MCL, Monthly (TCR) - In FEB-2007, Contaminant: Coliform. Follow-up actions: St Compliance achieved (2 times from APR-23-2008 to MAY-12-2008)
MCL, Monthly (TCR) - In JAN-2007, Contaminant: Coliform. Follow-up actions: St Compliance achieved (2 times from APR-23-2008 to MAY-12-2008)
MCL, Monthly (TCR) - In OCT-2006, Contaminant: Coliform. Follow-up actions: St Compliance achieved (2 times from APR-23-2008 to MAY-12-2008)
MCL, Monthly (TCR) - In JUN-2006, Contaminant: Coliform. Follow-up actions: St Compliance achieved (2 times from APR-23-2008 to MAY-12-2008)
Past monitoring violations:
Monitoring, Repeat Major (TCR) - In OCT-2007, Contaminant: Coliform (TCR). Follow-up actions: St Compliance achieved (2 times from APR-23-2008 to MAY-12-2008)
Follow-up Or Routine LCR Tap M/R - In JAN-01-2005, Contaminant: Lead and Copper Rule. Follow-up actions: Fed Compliance achieved (JUL-29-2005), State No Longer Subject to Rule (DEC-25-2010)
Follow-up Or Routine LCR Tap M/R - In JAN-01-2004, Contaminant: Lead and Copper Rule. Follow-up actions: Fed Compliance achieved (JUL-29-2005), State No Longer Subject to Rule (DEC-25-2010)
Follow-up Or Routine LCR Tap M/R - In JAN-01-2003, Contaminant: Lead and Copper Rule. Follow-up actions: Fed Compliance achieved (JUL-29-2005), State No Longer Subject to Rule (DEC-25-2010)
Follow-up Or Routine LCR Tap M/R - In OCT-01-1996, Contaminant: Lead and Copper Rule. Follow-up actions: Fed Compliance achieved (JUL-29-2005), State No Longer Subject to Rule (DEC-25-2010)
8 routine major monitoring violations
2 minor monitoring violations
68 regular monitoring violations
Population served: 50, Groundwater):
Past monitoring violations:
Failure to Conduct Assessment Monitoring - In AUG-2013, Contaminant: COLIPHAGE. Follow-up actions: St Compliance achieved (SEP-11-2013)
Failure to Conduct Assessment Monitoring - In JUL-2013, Contaminant: COLIPHAGE. Follow-up actions: St Compliance achieved (SEP-11-2013)
Failure to Conduct Assessment Monitoring - In MAY-2013, Contaminant: COLIPHAGE. Follow-up actions: St Compliance achieved (SEP-11-2013)
Failure to Conduct Assessment Monitoring - In MAR-2013, Contaminant: COLIPHAGE. Follow-up actions: St Compliance achieved (SEP-11-2013)
Failure to Conduct Assessment Monitoring - In OCT-2012, Contaminant: COLIPHAGE. Follow-up actions: St Violation/Reminder Notice (DEC-03-2012), St Compliance achieved (SEP-11-2013)
8 routine major monitoring violations
One minor monitoring violation
2 regular monitoring violations
3 other older monitoring violations
Average household size: This city:
2.6 peopleOregon:
2.5 people
Percentage of family households: This city:
71.4%Whole state:
63.4%
Percentage of households with unmarried partners: This city:
7.4%Whole state:
8.0%
Likely homosexual households (counted as self-reported same-sex unmarried-partner households)
Lesbian couples: 0.4% of all households Gay men: 0.4% of all households
People in group quarters in Central Point in 2010:
40 people in group homes intended for adults
18 people in workers' group living quarters and job corps centers
8 people in residential treatment centers for juveniles (non-correctional)
4 people in nursing facilities/skilled-nursing facilities
People in group quarters in Central Point in 2000:
58 people in nursing homes
22 people in other noninstitutional group quarters
12 people in other group homes
9 people in hospitals or wards for drug/alcohol abuse
5 people in homes for the physically handicapped
Banks with branches in Central Point (2011 data):
U.S. Bank National Association: Central Point Branch at 139 East Pine Street, branch established on 1970/09/22; Central Point Albertsons at 1360 Plaza Blvd., branch established on 2000/01/26. Info updated 2012/01/30: Bank assets: $330,470.8 mil, Deposits: $236,091.5 mil, headquarters in Cincinnati, OH, positive income , 3121 total offices , Holding Company: U.S. Bancorp
Umpqua Bank: Central Point Branch at 1780 East Pine Street, branch established on 2000/01/31. Info updated 2011/09/02: Bank assets: $11,556.7 mil, Deposits: $9,325.3 mil, headquarters in Roseburg, OR, positive income , Commercial Lending Specialization, 193 total offices , Holding Company: Umpqua Holdings Corporation
JPMorgan Chase Bank, National Association: Central Point at 475 East Pine Street, branch established on 1977/01/14. Info updated 2011/11/10: Bank assets: $1,811,678.0 mil, Deposits: $1,190,738.0 mil, headquarters in Columbus, OH, positive income , International Specialization, 5577 total offices , Holding Company: Jpmorgan Chase & Co.
Peoples Bank of Commerce: Central Point Branch at 1017 E Pine Street, branch established on 2008/06/04. Info updated 2006/11/03: Bank assets: $126.7 mil, Deposits: $110.6 mil, headquarters in Medford, OR, positive income , Commercial Lending Specialization, 3 total offices
KeyBank National Association: Central Point Branch at 510 E Pine St, branch established on 1909/01/01. Info updated 2008/03/03: Bank assets: $86,198.8 mil, Deposits: $64,214.8 mil, headquarters in Cleveland, OH, positive income , Commercial Lending Specialization, 1067 total offices , Holding Company: Keycorp
Sterling Savings Bank: Central Point Branch at 1217 Plaza Blvd, branch established on 2000/09/26. Info updated 2012/03/21: Bank assets: $9,207.8 mil, Deposits: $6,454.1 mil, headquarters in Spokane, WA, positive income , Commercial Lending Specialization, 192 total offices , Holding Company: Sterling Financial Corporation
PremierWest Bank: Central Point Branch at 300 East Pine Street, branch established on 1999/03/22. Info updated 2011/05/20: Bank assets: $1,264.9 mil, Deposits: $1,128.9 mil, headquarters in Medford, OR, negative income in the last year , Commercial Lending Specialization, 46 total offices , Holding Company: Premierwest Bancorp
Wells Fargo Bank, National Association: Central Point In-Store Branch at 126 East Pine Street, branch established on 1997/08/28. Info updated 2011/04/05: Bank assets: $1,161,490.0 mil, Deposits: $905,653.0 mil, headquarters in Sioux Falls, SD, positive income , 6395 total offices , Holding Company: Wells Fargo & Company
For population 15 years and over in Central Point:
Never married: 27.1%Now married: 54.0%Separated: 0.6%Widowed: 5.6%Divorced: 12.6% For population 25 years and over in Central Point:
High school or higher: 90.4%Bachelor's degree or higher: 22.3%Graduate or professional degree: 7.0%Unemployed: 5.4%Mean travel time to work (commute): 12.0 minutes
Education Gini index (Inequality in education) Here:
12.5Oregon average:
11.6
Religion statistics for Central Point, OR (based on Jackson County data)
Religion Adherents Congregations Evangelical Protestant 25,890 122 Catholic 16,565 6 Other 10,057 44 Mainline Protestant 5,252 23 Orthodox 100 2 None 145,342 -
Source: Clifford Grammich, Kirk Hadaway, Richard Houseal, Dale E.Jones, Alexei Krindatch, Richie Stanley and Richard H.Taylor. 2012. 2010 U.S.Religion Census: Religious Congregations & Membership Study. Association of Statisticians of American Religious Bodies. Jones, Dale E., et al. 2002. Congregations and Membership in the United States 2000. Nashville, TN: Glenmary Research Center. Graphs represent county-level data
Food Environment Statistics: Number of grocery stores : 33Jackson County :
1.66 / 10,000 pop.Oregon :
2.03 / 10,000 pop.
Number of supercenters and club stores : 6Here :
0.30 / 10,000 pop.State :
0.33 / 10,000 pop.
Number of convenience stores (no gas) : 45Jackson County :
2.26 / 10,000 pop.State :
2.01 / 10,000 pop.
Number of convenience stores (with gas) : 33Jackson County :
1.66 / 10,000 pop.State :
1.69 / 10,000 pop.
Number of full-service restaurants : 199Jackson County :
10.00 / 10,000 pop.Oregon :
9.93 / 10,000 pop.
Adult obesity rate : This county :
23.2%Oregon :
25.6%
Low-income preschool obesity rate : Health and Nutrition: Healthy diet rate : Central Point:
49.0%State:
49.6%
Average overall health of teeth and gums : Central Point:
45.3%Oregon:
46.8%
People feeling badly about themselves : This city:
21.2%State:
21.2%
People not drinking alcohol at all : This city:
10.7%Oregon:
10.1%
Average hours sleeping at night : Overweight people : Central Point:
34.1%State:
33.3%
General health condition : Average condition of hearing : Central Point:
77.8%Oregon:
78.7%
More about Health and Nutrition of Central Point, OR Residents
Local government employment and payroll (March 2022)
Function
Full-time employees
Monthly full-time payroll
Average yearly full-time wage
Part-time employees
Monthly part-time payroll
Police Protection - Officers
27 $189,393 $84,175 0 $0 Water Supply
10 $44,660 $53,592 0 $0 Other Government Administration
9 $71,060 $94,747 10 $2,705 Other and Unallocable
7 $48,744 $83,561 0 $0 Parks and Recreation
7 $33,172 $56,866 0 $0 Financial Administration
6 $42,727 $85,454 0 $0 Streets and Highways
6 $25,072 $50,144 0 $0 Police - Other
5 $23,223 $55,735 0 $0 Sewerage
1 $5,694 $68,328 0 $0
Totals for Government
78 $483,745 $74,422 10 $2,705
Central Point government finances - Expenditure in 2017 (per resident):
Construction - Water Utilities: $2,709,000 ($140.93)
Regular Highways: $367,000 ($19.09)Sewerage: $179,000 ($9.31)Parks and Recreation: $113,000 ($5.88)Current Operations - Police Protection: $3,994,000 ($207.78)
Water Utilities: $2,692,000 ($140.05)Regular Highways: $2,308,000 ($120.07)Parks and Recreation: $1,481,000 ($77.05)Central Staff Services: $1,184,000 ($61.60)Financial Administration: $715,000 ($37.20)Sewerage: $517,000 ($26.90)General Public Buildings: $329,000 ($17.12)Protective Inspection and Regulation - Other: $132,000 ($6.87)General - Other: $96,000 ($4.99)Housing and Community Development: $52,000 ($2.71)Public Welfare - Other: $38,000 ($1.98)Judicial and Legal Services: $24,000 ($1.25)General - Interest on Debt: $362,000 ($18.83)
Other Capital Outlay - Regular Highways: $432,000 ($22.47)
Total Salaries and Wages: $4,610,000 ($239.83)
Central Point government finances - Revenue in 2017 (per resident):
Charges - Other: $2,020,000 ($105.09)
Sewerage: $1,121,000 ($58.32)Parks and Recreation: $80,000 ($4.16)Miscellaneous - General Revenue - Other: $472,000 ($24.56)
Fines and Forfeits: $365,000 ($18.99)Interest Earnings: $142,000 ($7.39)Special Assessments: $119,000 ($6.19)Donations From Private Sources: $12,000 ($0.62)Revenue - Water Utilities: $2,899,000 ($150.82)
State Intergovernmental - Highways: $1,283,000 ($66.75)
Other: $591,000 ($30.75)General Local Government Support: $432,000 ($22.47)Tax - Property: $5,553,000 ($288.89)
Public Utilities Sales: $1,495,000 ($77.78)Other Selective Sales: $530,000 ($27.57)Other License: $138,000 ($7.18)Occupation and Business License - Other: $66,000 ($3.43)
Central Point government finances - Debt in 2017 (per resident):
Long Term Debt - Beginning Outstanding - Unspecified Public Purpose: $10,106,000 ($525.75)
Outstanding Unspecified Public Purpose: $9,568,000 ($497.76)Retired Unspecified Public Purpose: $538,000 ($27.99)
Central Point government finances - Cash and Securities in 2017 (per resident):
Other Funds - Cash and Securities: $13,221,000 ($687.81)
Businesses in Central Point, OR
Name Count Name Count
7-Eleven 1 Marriott 1 AT&T 1 MasterBrand Cabinets 1 Albertsons 1 McDonald's 1 Blockbuster 1 Nike 2 Burger King 1 Pizza Hut 1 Circle K 2 Quiznos 1 FedEx 3 SONIC Drive-In 1 H&R Block 1 Subway 1 Holiday Inn 1 True Value 1 Jones New York 1 U-Haul 1 KFC 1 U.S. Cellular 1 Lane Furniture 1 UPS 1 Little Caesars Pizza 1
Strongest AM radio stations in Central Point:
KAPL (1300 AM; 20 kW; PHOENIX, OR; Owner: APPLEGATE MEDIA, INC.)
KRTA (610 AM; 5 kW; MEDFORD, OR; Owner: OPUS BROADCASTING SYSTEMS, INC.)
KMED (1440 AM; 5 kW; MEDFORD, OR; Owner: CITICASTERS LICENSES, L.P.)
KTMT (580 AM; 10 kW; ASHLAND, OR; Owner: MAPLETON COMMUNICATIONS, LLC)
KLVB (730 AM; 1 kW; MEDFORD, OR)
KCMX (880 AM; 1 kW; PHOENIX, OR; Owner: MAPLETON COMMUNICATIONS, LLC)
KAJO (1270 AM; 10 kW; GRANTS PASS, OR; Owner: GRANTS PASS BROADCASTING CORPORATION)
KGRV (700 AM; 25 kW; WINSTON, OR; Owner: PACIFIC CASCADE COMMUNICATIONS CORP.)
KAGI (930 AM; 5 kW; GRANTS PASS, OR; Owner: SOUTHERN OREGON STATE COLLEGE)
KSJK (1230 AM; 1 kW; TALENT, OR; Owner: ST. OF OR. ACT & ST. BD. OF HGR ED.)
KDUN (1030 AM; 50 kW; REEDSPORT, OR; Owner: PAMPLIN BROADCASTING-OREGON, INC.)
KPNW (1120 AM; 50 kW; EUGENE, OR; Owner: CAPSTAR TX LIMITED PARTNERSHIP)
KPOJ (620 AM; 50 kW; PORTLAND, OR; Owner: CITICASTERS LICENSES, L.P.)
Strongest FM radio stations in Central Point:
KCMX-FM (101.9 FM; ASHLAND, OR; Owner: MAPLETON COMMUNICATIONS, LLC)
KLDZ (103.5 FM; MEDFORD, OR; Owner: CITICASTERS LICENSES, L.P.)
K254AD (98.7 FM; MEDFORD, OR; Owner: GRANTS PASS BROADCASTING CORPORATION)
KZZE (106.3 FM; EAGLE POINT, OR; Owner: CITICASTERS LICENSES, L.P.)
KIFS (107.5 FM; ASHLAND, OR; Owner: CITICASTERS LICENSES, L.P.)
K216DR (91.1 FM; CENTRAL POINT, OR; Owner: EDUCATIONAL MEDIA FOUNDATION)
K209CP (89.7 FM; TALENT, OR; Owner: EDUCATIONAL MEDIA FOUNDATION)
KSMF (89.1 FM; ASHLAND, OR; Owner: STATE OF OREGON/STATE BD HIGHER EDUC)
K204CY (88.7 FM; MEDFORD, OR; Owner: EDUCATIONAL MEDIA FOUNDATION)
KSRG (88.3 FM; ASHLAND, OR; Owner: ST. BOARD OF HIGHER ED/SO. OR ST COL)
K227AA (93.3 FM; ASHLAND, ETC., OR; Owner: MAPLETON COMMUNICATIONS, LLC)
K284AE (104.7 FM; ASHLAND, OR; Owner: MAPLETON COMMUNICATIONS, LLC)
K214BO (90.7 FM; ASHLAND, OR; Owner: FAMILY STATIONS, INC.)
KRWQ (100.3 FM; GOLD HILL, OR; Owner: CITICASTERS LICENSES, L.P.)
KBOY-FM (95.7 FM; MEDFORD, OR; Owner: MAPLETON COMMUNICATIONS, LLC)
KAKT (105.1 FM; PHOENIX, OR; Owner: MAPLETON COMMUNICATIONS, LLC)
KTMT-FM (93.7 FM; MEDFORD, OR; Owner: MAPLETON COMMUNICATIONS, LLC)
KRRM (94.7 FM; ROGUE RIVER, OR; Owner: SHIRLEY M. BELL)
K290AF (105.9 FM; ROGUE RIVER, OR; Owner: CITICASTERS LICENSES, L.P.)
K266AC (101.1 FM; ROGUE RIVER, OR; Owner: CITICASTERS LICENSES, L.P.)
TV broadcast stations around Central Point:
K07RQ (Channel 7; JACKSONVILLE, OR; Owner: SOUTHERN OREGON PUBLIC TELEVISION)
K21BG (Channel 21; JACKSONVILLE, OR; Owner: SODA MOUNTAIN BROADCASTING, INC.)
K57EK (Channel 57; MEDFORD, OR; Owner: TRINITY BROADCASTING NETWORK)
K02IC (Channel 2; JACKSONVILLE, OR; Owner: FREEDOM BROADCASTING OF OREGON, INC.)
KMVU (Channel 26; MEDFORD, OR; Owner: BROADCASTING LICENSES, L.P.)
K23EX (Channel 23; MEDFORD, OR; Owner: BETTER LIFE TELEVISION)
K28GG (Channel 28; MEDFORD, OR; Owner: WATCHTV, INC.)
K13JR (Channel 13; JACKSONVILLE, ETC., OR; Owner: CALIFORNIA OREGON BROADCASTING, INC.)
K03EI (Channel 3; TOLO, ETC., OR; Owner: CALIFORNIA OREGON BROADCASTING, INC.)
KBLN (Channel 30; GRANTS PASS, OR; Owner: BETTER LIFE TELEVISION, INC.)
K46CH (Channel 46; GOLD HILL, OR; Owner: SODA MOUNTAIN BROADCASTING, INC.)
K04JZ (Channel 4; GOLD HILL, OR; Owner: FREEDOM BROADCASTING OF OREGON, INC.)
K55DQ (Channel 55; GOLD HILL, ETC., OR; Owner: SOUTHERN OREGON PUBLIC TELEVISION)
National Bridge Inventory (NBI) Statistics 33 Number of bridges390ft / 119m Total length $1,555,000 Total costs349,776 Total average daily traffic44,365 Total average daily truck traffic
New bridges - historical statistics
1 1930-1939 8 1950-1959 6 1960-1969 1 1970-1979 2 1980-1989 14 2000-2009 1 2010-2019
See full National Bridge Inventory statistics for Central Point, OR
Home Mortgage Disclosure Act Aggregated Statistics For Year 2009(Based on 2 partial tracts) A) FHA, FSA/RHS & VA B) Conventional C) Refinancings D) Home Improvement Loans F) Non-occupant Loans on G) Loans On Manufactured Number Average Value Number Average Value Number Average Value Number Average Value Number Average Value Number Average Value
LOANS ORIGINATED 58 $163,327 27 $115,606 124 $161,380 6 $67,743 17 $124,878 7 $79,093 APPLICATIONS APPROVED, NOT ACCEPTED 4 $119,548 1 $84,240 12 $140,754 1 $19,750 2 $130,355 1 $9,720 APPLICATIONS DENIED 4 $169,960 2 $78,595 62 $179,251 2 $106,205 4 $177,940 2 $96,085 APPLICATIONS WITHDRAWN 7 $151,190 2 $90,375 34 $198,094 0 $0 6 $183,195 1 $162,630 FILES CLOSED FOR INCOMPLETENESS 0 $0 3 $140,720 7 $160,417 1 $106,790 2 $138,110 0 $0
Aggregated Statistics For Year 2008(Based on 2 partial tracts) A) FHA, FSA/RHS & VA B) Conventional C) Refinancings D) Home Improvement Loans F) Non-occupant Loans on G) Loans On Manufactured Number Average Value Number Average Value Number Average Value Number Average Value Number Average Value Number Average Value
LOANS ORIGINATED 42 $177,308 42 $160,064 89 $165,942 12 $93,967 23 $134,593 5 $97,584 APPLICATIONS APPROVED, NOT ACCEPTED 4 $224,320 11 $162,590 17 $203,399 1 $49,110 1 $173,830 2 $68,590 APPLICATIONS DENIED 12 $184,112 12 $159,252 88 $196,253 12 $164,408 14 $167,263 5 $77,828 APPLICATIONS WITHDRAWN 4 $180,522 7 $217,491 34 $204,518 3 $210,297 9 $158,502 2 $43,330 FILES CLOSED FOR INCOMPLETENESS 1 $177,440 1 $275,690 11 $187,579 1 $17,800 0 $0 0 $0
Aggregated Statistics For Year 2007(Based on 2 partial tracts) A) FHA, FSA/RHS & VA B) Conventional C) Refinancings D) Home Improvement Loans E) Loans on Dwellings For 5+ Families F) Non-occupant Loans on G) Loans On Manufactured Number Average Value Number Average Value Number Average Value Number Average Value Number Average Value Number Average Value Number Average Value
LOANS ORIGINATED 11 $222,576 140 $155,530 198 $163,664 29 $81,269 1 $444,940 42 $161,237 6 $107,957 APPLICATIONS APPROVED, NOT ACCEPTED 1 $140,540 29 $143,549 48 $175,499 4 $161,950 0 $0 11 $168,769 2 $141,070 APPLICATIONS DENIED 2 $238,510 24 $165,538 127 $202,708 23 $96,973 0 $0 19 $177,087 3 $113,503 APPLICATIONS WITHDRAWN 2 $245,500 23 $152,393 75 $184,849 4 $105,342 0 $0 4 $203,978 2 $55,160 FILES CLOSED FOR INCOMPLETENESS 0 $0 4 $147,628 17 $208,359 1 $195,060 0 $0 3 $228,993 0 $0
Aggregated Statistics For Year 2006(Based on 2 partial tracts) A) FHA, FSA/RHS & VA B) Conventional C) Refinancings D) Home Improvement Loans E) Loans on Dwellings For 5+ Families F) Non-occupant Loans on G) Loans On Manufactured Number Average Value Number Average Value Number Average Value Number Average Value Number Average Value Number Average Value Number Average Value
LOANS ORIGINATED 6 $224,822 220 $156,092 269 $162,038 36 $74,376 1 $2,277,370 57 $176,717 5 $108,798 APPLICATIONS APPROVED, NOT ACCEPTED 1 $308,590 27 $156,666 40 $151,492 2 $45,360 0 $0 7 $173,949 2 $33,520 APPLICATIONS DENIED 3 $201,140 48 $156,366 104 $191,965 30 $100,874 0 $0 17 $215,152 10 $86,103 APPLICATIONS WITHDRAWN 4 $222,290 46 $182,112 87 $187,524 9 $143,157 0 $0 11 $210,610 1 $253,030 FILES CLOSED FOR INCOMPLETENESS 0 $0 3 $69,273 27 $211,686 2 $190,075 0 $0 3 $220,213 0 $0
Aggregated Statistics For Year 2005(Based on 2 partial tracts) A) FHA, FSA/RHS & VA B) Conventional C) Refinancings D) Home Improvement Loans E) Loans on Dwellings For 5+ Families F) Non-occupant Loans on G) Loans On Manufactured Number Average Value Number Average Value Number Average Value Number Average Value Number Average Value Number Average Value Number Average Value
LOANS ORIGINATED 9 $192,488 343 $149,483 352 $153,275 31 $107,101 3 $934,013 117 $148,819 9 $131,091 APPLICATIONS APPROVED, NOT ACCEPTED 0 $0 44 $144,603 45 $156,116 4 $51,330 0 $0 9 $145,270 3 $64,987 APPLICATIONS DENIED 0 $0 72 $128,083 124 $163,597 22 $89,174 0 $0 19 $148,244 12 $85,428 APPLICATIONS WITHDRAWN 1 $155,830 42 $135,465 118 $157,226 11 $167,942 0 $0 6 $137,558 2 $95,985 FILES CLOSED FOR INCOMPLETENESS 0 $0 10 $118,477 14 $199,226 1 $24,820 0 $0 3 $154,720 0 $0
Aggregated Statistics For Year 2004(Based on 2 partial tracts) A) FHA, FSA/RHS & VA B) Conventional C) Refinancings D) Home Improvement Loans E) Loans on Dwellings For 5+ Families F) Non-occupant Loans on G) Loans On Manufactured Number Average Value Number Average Value Number Average Value Number Average Value Number Average Value Number Average Value Number Average Value
LOANS ORIGINATED 17 $170,683 306 $129,988 306 $126,027 20 $73,243 1 $333,170 88 $134,704 13 $84,120 APPLICATIONS APPROVED, NOT ACCEPTED 2 $172,280 35 $124,916 62 $126,054 4 $58,322 0 $0 10 $132,474 4 $69,220 APPLICATIONS DENIED 3 $173,703 41 $111,310 136 $138,636 25 $68,111 0 $0 18 $128,973 12 $65,268 APPLICATIONS WITHDRAWN 2 $182,420 34 $150,544 86 $127,360 10 $92,686 0 $0 11 $126,994 2 $87,105 FILES CLOSED FOR INCOMPLETENESS 0 $0 6 $113,358 18 $128,128 0 $0 0 $0 3 $98,040 0 $0
Aggregated Statistics For Year 2003(Based on 2 partial tracts) A) FHA, FSA/RHS & VA B) Conventional C) Refinancings D) Home Improvement Loans E) Loans on Dwellings For 5+ Families F) Non-occupant Loans on Number Average Value Number Average Value Number Average Value Number Average Value Number Average Value Number Average Value
LOANS ORIGINATED 27 $148,026 208 $122,867 475 $108,748 18 $30,810 1 $1,698,590 87 $116,268 APPLICATIONS APPROVED, NOT ACCEPTED 1 $173,700 15 $143,548 62 $107,821 3 $14,807 0 $0 4 $92,762 APPLICATIONS DENIED 3 $99,133 27 $93,933 116 $113,421 11 $46,543 0 $0 7 $110,444 APPLICATIONS WITHDRAWN 3 $132,253 24 $113,163 81 $114,505 1 $33,310 0 $0 5 $132,164 FILES CLOSED FOR INCOMPLETENESS 1 $94,680 5 $90,424 14 $121,709 1 $11,820 0 $0 1 $58,510
Aggregated Statistics For Year 2002(Based on 2 partial tracts) A) FHA, FSA/RHS & VA B) Conventional C) Refinancings D) Home Improvement Loans E) Loans on Dwellings For 5+ Families F) Non-occupant Loans on Number Average Value Number Average Value Number Average Value Number Average Value Number Average Value Number Average Value
LOANS ORIGINATED 54 $130,017 196 $110,340 344 $105,799 10 $34,951 1 $443,510 77 $115,770 APPLICATIONS APPROVED, NOT ACCEPTED 1 $104,530 26 $132,842 38 $95,084 0 $0 0 $0 7 $123,854 APPLICATIONS DENIED 3 $129,083 24 $90,229 95 $102,470 4 $57,958 0 $0 24 $96,388 APPLICATIONS WITHDRAWN 4 $114,630 29 $120,018 76 $107,240 3 $23,553 0 $0 6 $111,137 FILES CLOSED FOR INCOMPLETENESS 0 $0 7 $88,251 14 $95,667 0 $0 0 $0 2 $80,090
Aggregated Statistics For Year 2001(Based on 2 partial tracts) A) FHA, FSA/RHS & VA B) Conventional C) Refinancings D) Home Improvement Loans F) Non-occupant Loans on Number Average Value Number Average Value Number Average Value Number Average Value Number Average Value
LOANS ORIGINATED 39 $130,014 148 $101,289 300 $99,329 16 $36,264 56 $95,923 APPLICATIONS APPROVED, NOT ACCEPTED 1 $83,290 12 $109,199 30 $88,389 1 $61,430 4 $76,458 APPLICATIONS DENIED 4 $109,590 27 $83,205 96 $87,154 9 $17,373 8 $88,359 APPLICATIONS WITHDRAWN 1 $198,970 10 $106,764 67 $103,097 6 $77,395 4 $84,118 FILES CLOSED FOR INCOMPLETENESS 0 $0 4 $115,098 10 $114,238 1 $23,490 1 $173,700
Aggregated Statistics For Year 2000(Based on 2 partial tracts) A) FHA, FSA/RHS & VA B) Conventional C) Refinancings D) Home Improvement Loans E) Loans on Dwellings For 5+ Families F) Non-occupant Loans on Number Average Value Number Average Value Number Average Value Number Average Value Number Average Value Number Average Value
LOANS ORIGINATED 43 $119,689 142 $98,824 65 $78,676 23 $20,120 1 $252,720 19 $93,254 APPLICATIONS APPROVED, NOT ACCEPTED 1 $55,530 15 $78,605 10 $70,488 6 $26,127 0 $0 1 $80,330 APPLICATIONS DENIED 7 $107,489 40 $88,584 38 $60,822 14 $15,989 0 $0 5 $78,776 APPLICATIONS WITHDRAWN 1 $140,780 19 $92,938 33 $62,245 1 $23,360 0 $0 2 $47,720 FILES CLOSED FOR INCOMPLETENESS 0 $0 3 $104,650 7 $71,116 1 $14,240 0 $0 1 $98,950
Aggregated Statistics For Year 1999(Based on 2 partial tracts) A) FHA, FSA/RHS & VA B) Conventional C) Refinancings D) Home Improvement Loans F) Non-occupant Loans on Number Average Value Number Average Value Number Average Value Number Average Value Number Average Value
LOANS ORIGINATED 50 $113,184 166 $94,865 127 $77,718 23 $17,822 44 $81,677 APPLICATIONS APPROVED, NOT ACCEPTED 1 $165,570 23 $84,571 30 $80,526 7 $18,277 5 $93,460 APPLICATIONS DENIED 5 $117,686 58 $75,996 56 $66,913 13 $17,615 8 $87,319 APPLICATIONS WITHDRAWN 0 $0 8 $89,794 26 $70,331 4 $58,732 1 $80,680 FILES CLOSED FOR INCOMPLETENESS 2 $133,225 2 $111,375 8 $78,129 1 $11,000 1 $45,820
Detailed HMDA statistics for the following Tracts:
0010.00
, 0011.00
Private Mortgage Insurance Companies Aggregated Statistics For Year 2009(Based on 2 partial tracts) A) Conventional B) Refinancings Number Average Value Number Average Value
LOANS ORIGINATED 3 $148,857 3 $249,630 APPLICATIONS APPROVED, NOT ACCEPTED 2 $274,650 4 $200,755 APPLICATIONS DENIED 0 $0 0 $0 APPLICATIONS WITHDRAWN 0 $0 0 $0 FILES CLOSED FOR INCOMPLETENESS 1 $76,890 0 $0
Aggregated Statistics For Year 2008(Based on 2 partial tracts) A) Conventional B) Refinancings C) Non-occupant Loans on Number Average Value Number Average Value Number Average Value
LOANS ORIGINATED 18 $193,796 5 $229,538 1 $119,570 APPLICATIONS APPROVED, NOT ACCEPTED 9 $218,870 6 $212,222 1 $131,700 APPLICATIONS DENIED 1 $229,300 1 $159,260 1 $117,460 APPLICATIONS WITHDRAWN 1 $191,500 1 $139,530 0 $0 FILES CLOSED FOR INCOMPLETENESS 3 $200,520 0 $0 0 $0
Aggregated Statistics For Year 2007(Based on 2 partial tracts) A) Conventional B) Refinancings C) Non-occupant Loans on Number Average Value Number Average Value Number Average Value
LOANS ORIGINATED 34 $209,463 16 $239,659 1 $142,360 APPLICATIONS APPROVED, NOT ACCEPTED 1 $260,100 3 $221,080 1 $113,900 APPLICATIONS DENIED 0 $0 0 $0 0 $0 APPLICATIONS WITHDRAWN 3 $209,093 2 $223,895 0 $0 FILES CLOSED FOR INCOMPLETENESS 0 $0 1 $182,250 0 $0
Aggregated Statistics For Year 2006(Based on 2 partial tracts) A) Conventional B) Refinancings C) Non-occupant Loans on D) Loans On Manufactured Number Average Value Number Average Value Number Average Value Number Average Value
LOANS ORIGINATED 14 $237,165 7 $247,131 2 $238,840 1 $86,480 APPLICATIONS APPROVED, NOT ACCEPTED 1 $484,250 1 $288,840 0 $0 0 $0 APPLICATIONS DENIED 1 $298,860 0 $0 0 $0 0 $0 APPLICATIONS WITHDRAWN 0 $0 1 $321,780 0 $0 0 $0 FILES CLOSED FOR INCOMPLETENESS 0 $0 0 $0 0 $0 0 $0
Aggregated Statistics For Year 2005(Based on 2 partial tracts) A) Conventional B) Refinancings C) Non-occupant Loans on Number Average Value Number Average Value Number Average Value
LOANS ORIGINATED 14 $206,410 14 $220,616 2 $206,525 APPLICATIONS APPROVED, NOT ACCEPTED 1 $148,600 3 $212,450 0 $0 APPLICATIONS DENIED 0 $0 0 $0 0 $0 APPLICATIONS WITHDRAWN 1 $353,810 1 $276,930 0 $0 FILES CLOSED FOR INCOMPLETENESS 0 $0 0 $0 0 $0
Aggregated Statistics For Year 2004(Based on 2 partial tracts) A) Conventional B) Refinancings C) Non-occupant Loans on D) Loans On Manufactured Number Average Value Number Average Value Number Average Value Number Average Value
LOANS ORIGINATED 24 $176,697 22 $150,010 5 $143,168 1 $120,410 APPLICATIONS APPROVED, NOT ACCEPTED 1 $353,560 6 $142,807 0 $0 0 $0 APPLICATIONS DENIED 1 $300,420 1 $237,060 0 $0 0 $0 APPLICATIONS WITHDRAWN 1 $78,310 3 $139,297 0 $0 0 $0 FILES CLOSED FOR INCOMPLETENESS 0 $0 0 $0 0 $0 0 $0
Aggregated Statistics For Year 2003(Based on 2 partial tracts) A) Conventional B) Refinancings C) Non-occupant Loans on Number Average Value Number Average Value Number Average Value
LOANS ORIGINATED 51 $147,817 44 $129,638 4 $147,230 APPLICATIONS APPROVED, NOT ACCEPTED 9 $162,259 13 $135,872 1 $244,250 APPLICATIONS DENIED 1 $179,210 1 $104,590 1 $120,310 APPLICATIONS WITHDRAWN 3 $124,610 1 $85,880 1 $66,920 FILES CLOSED FOR INCOMPLETENESS 0 $0 0 $0 0 $0
Aggregated Statistics For Year 2002(Based on 2 partial tracts) A) Conventional B) Refinancings C) Non-occupant Loans on Number Average Value Number Average Value Number Average Value
LOANS ORIGINATED 53 $128,931 50 $128,000 5 $115,194 APPLICATIONS APPROVED, NOT ACCEPTED 6 $143,922 11 $129,750 0 $0 APPLICATIONS DENIED 2 $140,215 1 $222,060 0 $0 APPLICATIONS WITHDRAWN 1 $64,630 1 $91,840 0 $0 FILES CLOSED FOR INCOMPLETENESS 0 $0 0 $0 0 $0
Aggregated Statistics For Year 2001(Based on 2 partial tracts) A) Conventional B) Refinancings C) Non-occupant Loans on Number Average Value Number Average Value Number Average Value
LOANS ORIGINATED 44 $122,015 49 $118,839 5 $87,926 APPLICATIONS APPROVED, NOT ACCEPTED 4 $120,872 8 $103,545 1 $56,950 APPLICATIONS DENIED 1 $190,080 4 $99,108 1 $113,190 APPLICATIONS WITHDRAWN 0 $0 3 $105,360 0 $0 FILES CLOSED FOR INCOMPLETENESS 1 $57,660 0 $0 0 $0
Aggregated Statistics For Year 2000(Based on 2 partial tracts) A) Conventional B) Refinancings C) Non-occupant Loans on Number Average Value Number Average Value Number Average Value
LOANS ORIGINATED 39 $113,967 6 $113,367 3 $95,653 APPLICATIONS APPROVED, NOT ACCEPTED 5 $118,004 0 $0 1 $41,720 APPLICATIONS DENIED 2 $111,410 0 $0 0 $0 APPLICATIONS WITHDRAWN 0 $0 0 $0 0 $0 FILES CLOSED FOR INCOMPLETENESS 0 $0 0 $0 0 $0
Aggregated Statistics For Year 1999(Based on 2 partial tracts) A) Conventional B) Refinancings C) Non-occupant Loans on Number Average Value Number Average Value Number Average Value
LOANS ORIGINATED 53 $107,776 14 $104,795 3 $91,403 APPLICATIONS APPROVED, NOT ACCEPTED 2 $109,260 0 $0 1 $155,080 APPLICATIONS DENIED 1 $83,880 0 $0 0 $0 APPLICATIONS WITHDRAWN 1 $208,650 0 $0 0 $0 FILES CLOSED FOR INCOMPLETENESS 0 $0 0 $0 0 $0
Detailed PMIC statistics for the following Tracts:
0010.00
, 0011.00 Fire-safe hotels and motels in Central Point, Oregon:
Holiday Inn Express Hotel & Suites, 285 Penninger St, Central Point, Oregon 97502 Phone: (541) 423-1010, Fax: (541) 423-1199
Super 8, 4999 Biddle Rd, Central Point, Oregon 97502 Phone: (541) 664-5888, Fax: (541) 665-5517
La Quinta Inn & Suites #6746, 1777 LaRue Dr, Central point, Oregon 97502 Phone: (541) 665-4141
All 3 fire-safe hotels and motels in Central Point, Oregon
Most common first names in Central Point, OR among deceased individuals Name Count Lived (average)
William 116 76.0 years James 104 72.5 years Robert 96 71.7 years John 94 74.8 years Mary 72 80.1 years Charles 64 74.0 years Helen 59 82.6 years George 58 75.3 years Dorothy 56 78.3 years Donald 50 71.2 years
Most common last names in Central Point, OR among deceased individuals Last name Count Lived (average)
Smith 71 77.9 years Johnson 59 77.5 years Jones 35 73.3 years Wilson 29 75.1 years Miller 29 76.7 years Davis 23 76.8 years White 23 71.3 years Williams 22 72.2 years Hall 20 77.9 years Taylor 19 80.2 years
Central Point compared to Oregon state average:
Unemployed percentage below state average. Black race population percentage below state average. Length of stay since moving in significantly above state average. House age below state average.
Top Patent Applicants
Mark Peterson (10)
Chris Fish (4)
Roy Garvin (3)
Wayne L. Olson (3)
Mark D. Peterson (2)
Christopher Fish (2)
Ronald N. Kubli (2)
Jess E. Tudor (1)
Eddie K. Mosttler (1)
William Martin Waide (1)
Total of 42 patent applications in 2008-2024.
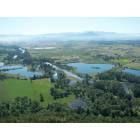

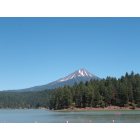

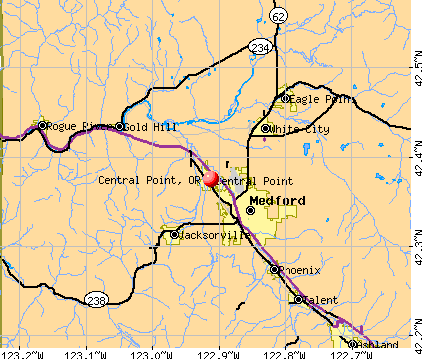


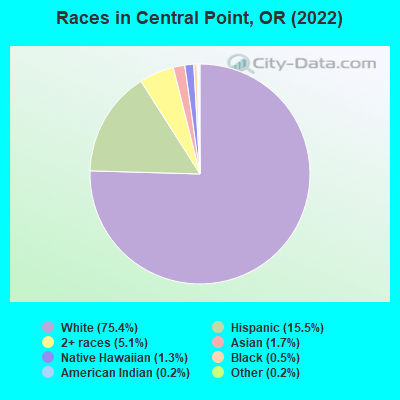
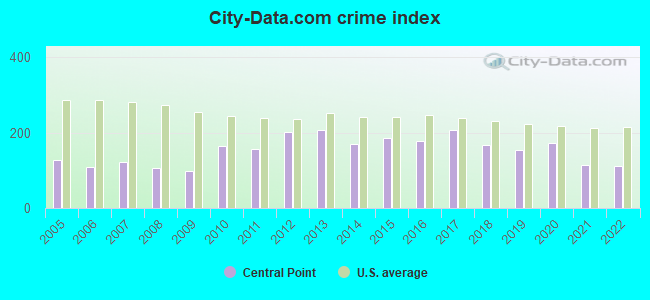
 Recent articles from our blog. Our writers, many of them Ph.D. graduates or candidates, create easy-to-read articles on a wide variety of topics.

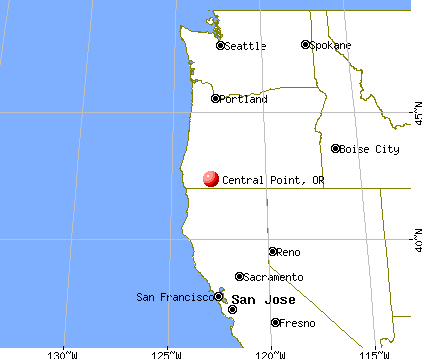
 (3.9 miles
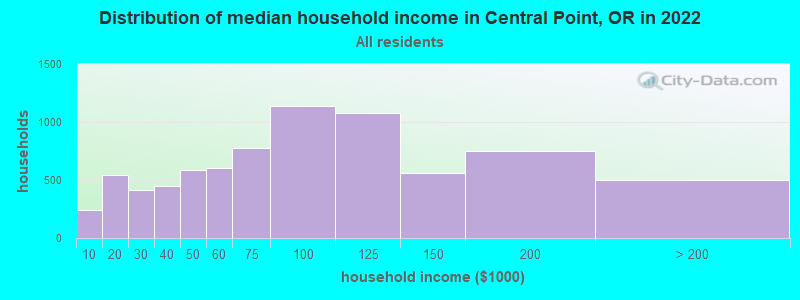
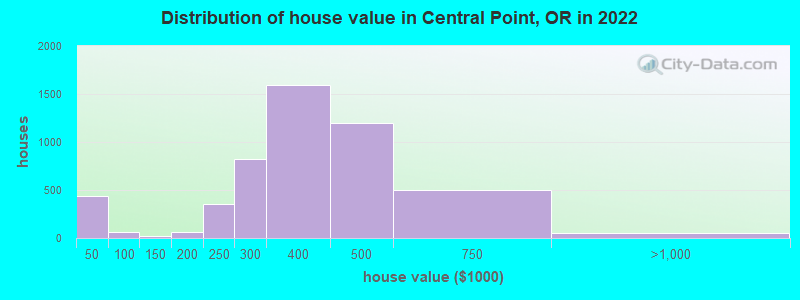
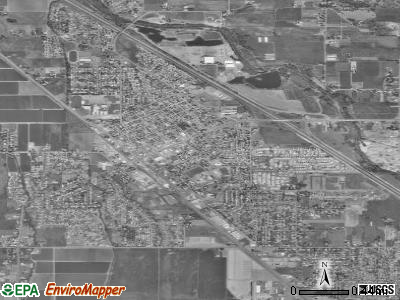
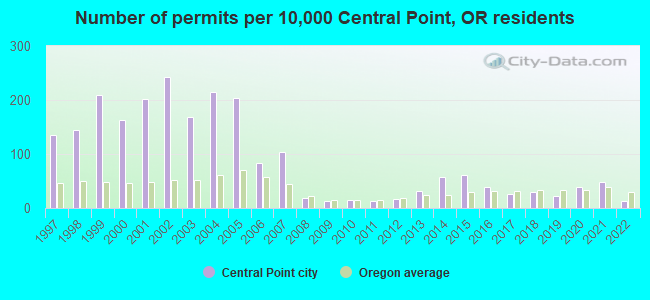
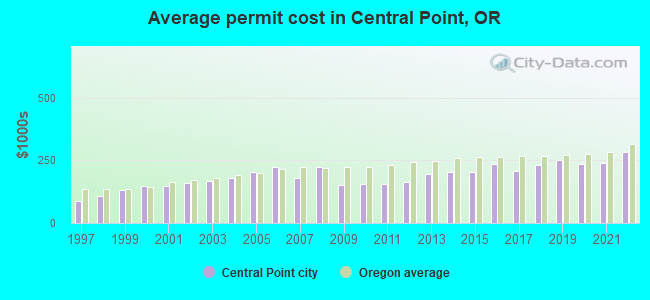
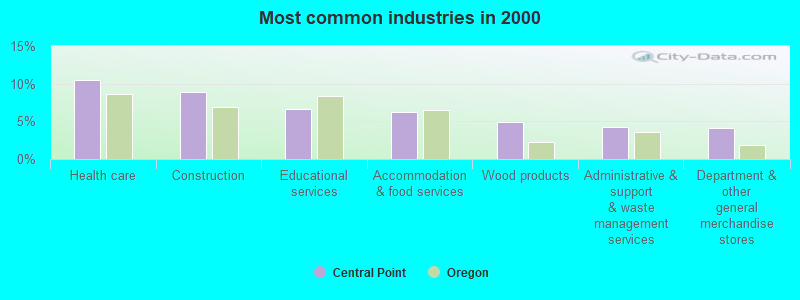
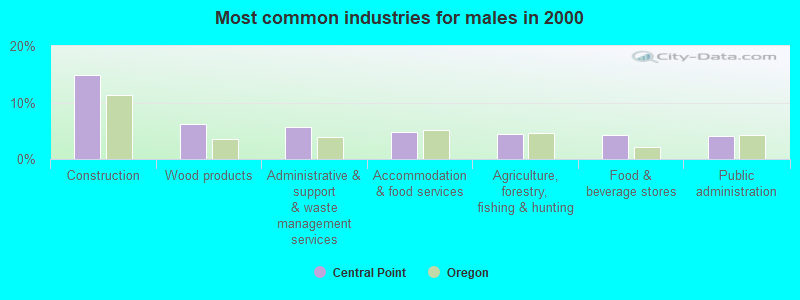
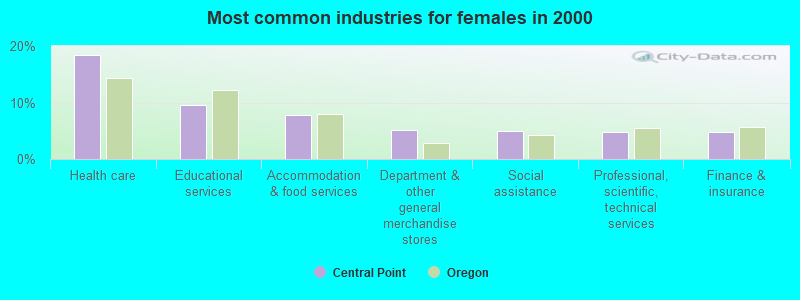
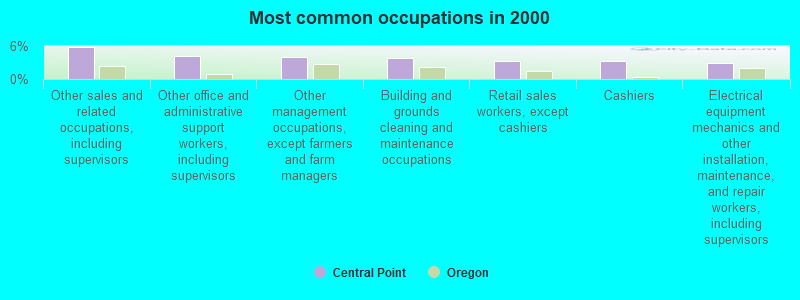
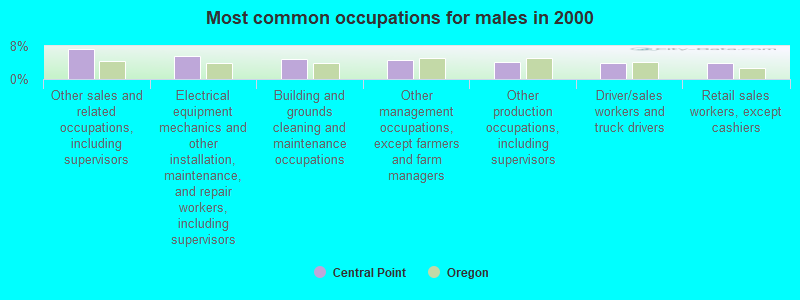
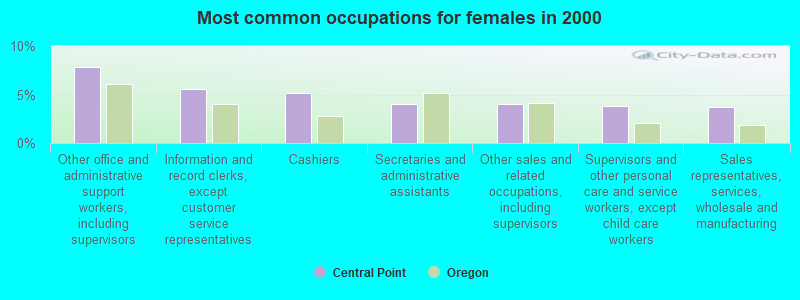
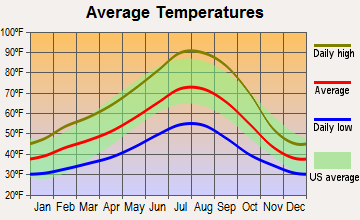
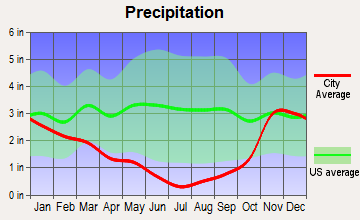
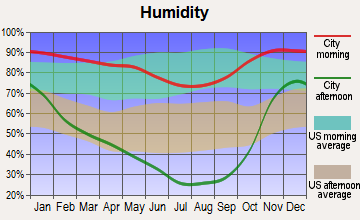
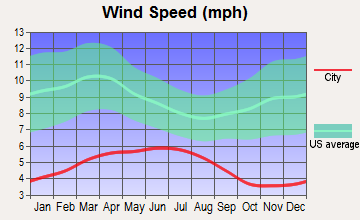
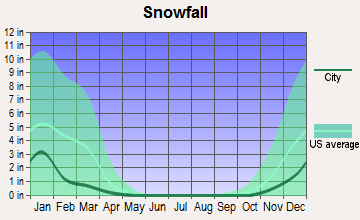
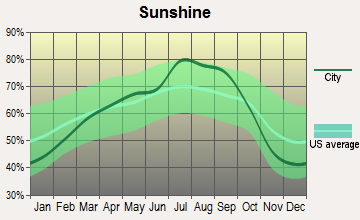
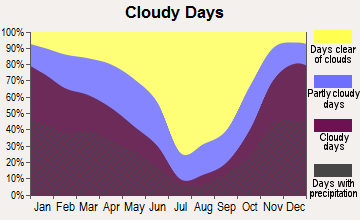
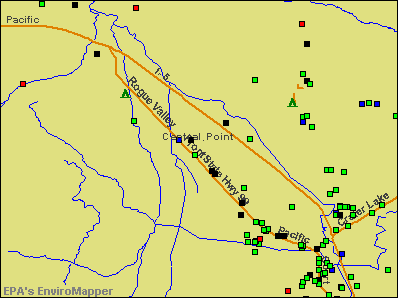

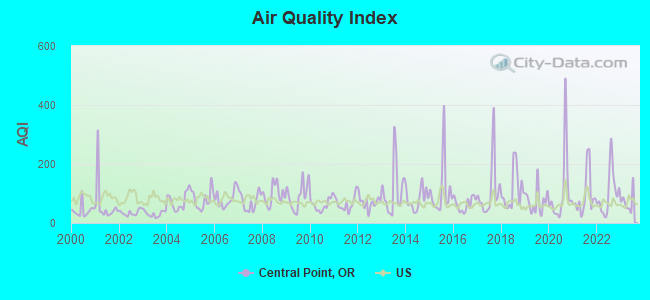
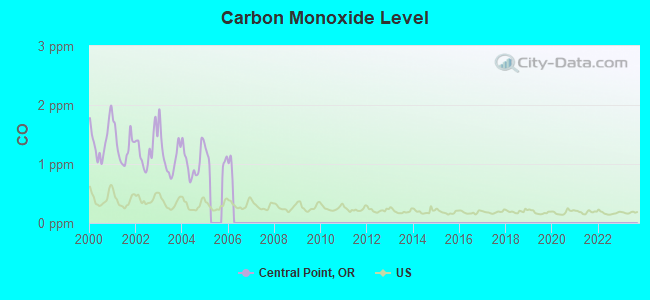
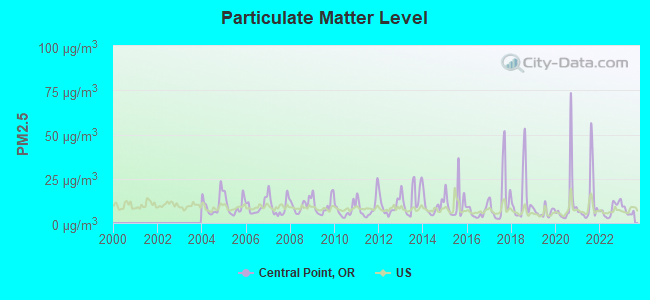
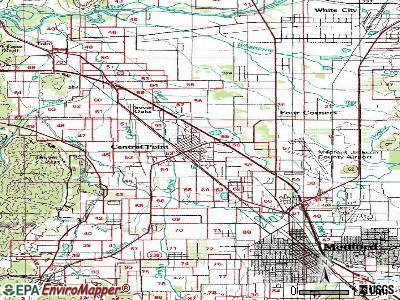
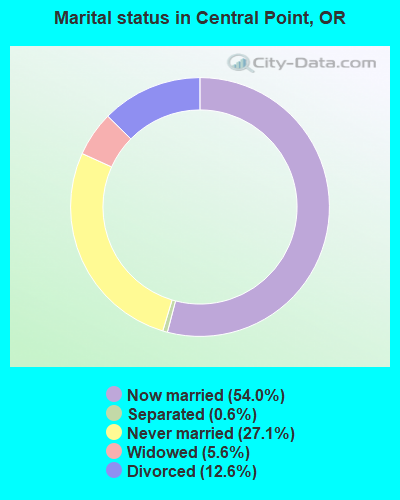
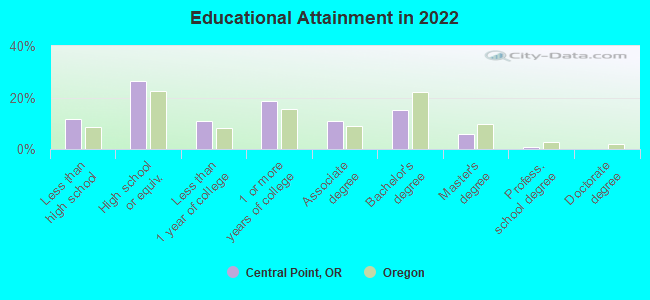
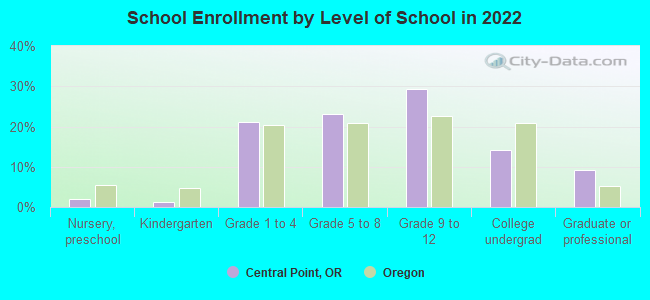
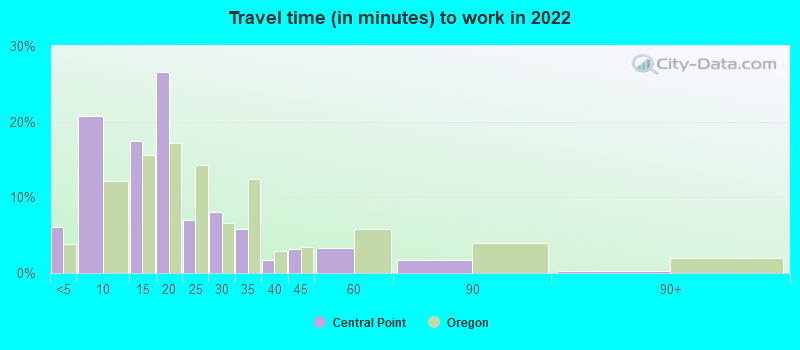
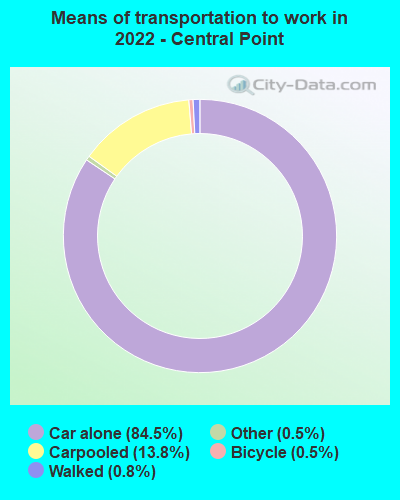
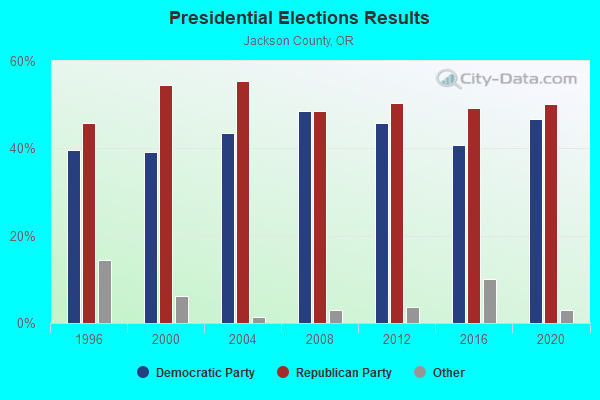
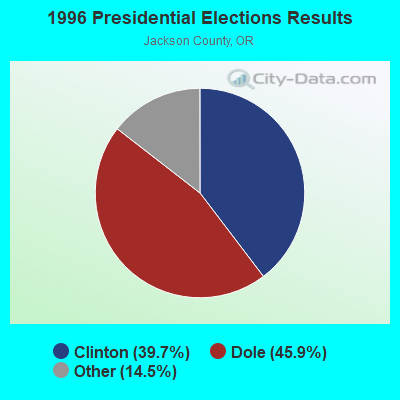
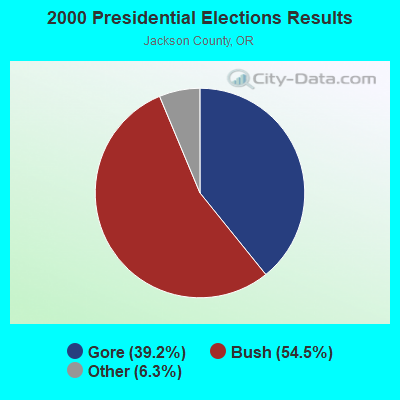
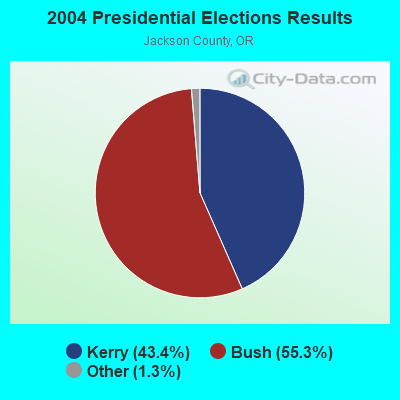

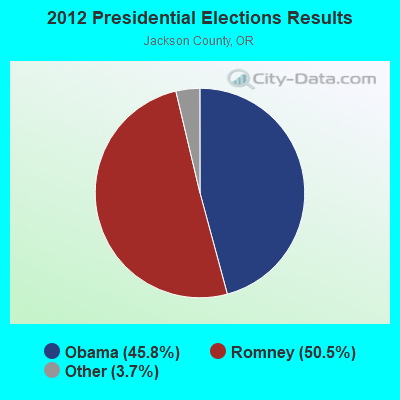
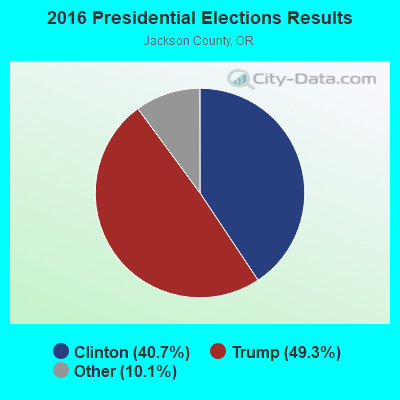
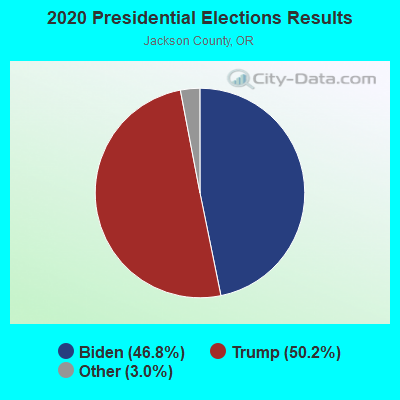
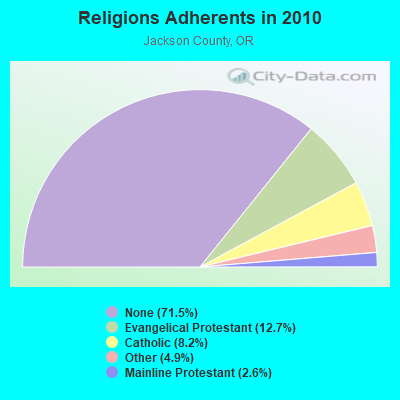
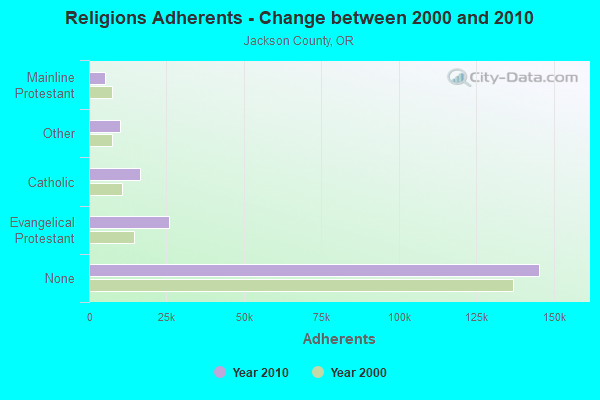
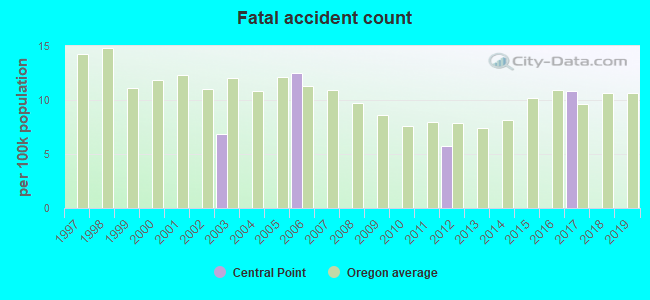
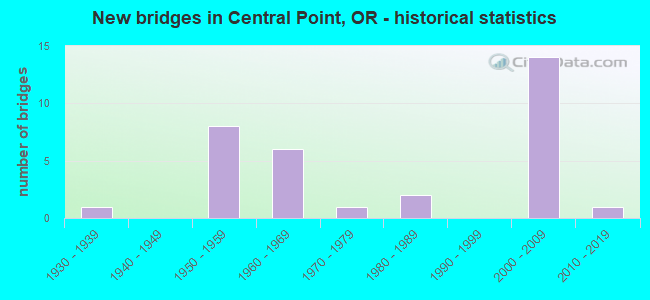
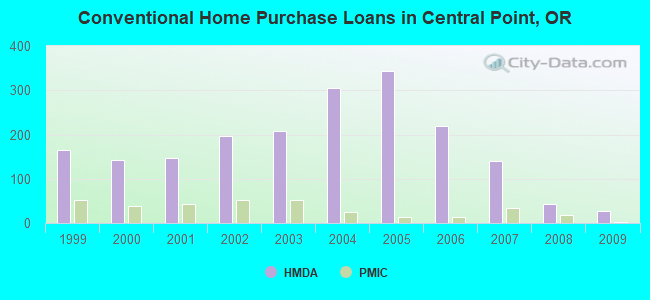
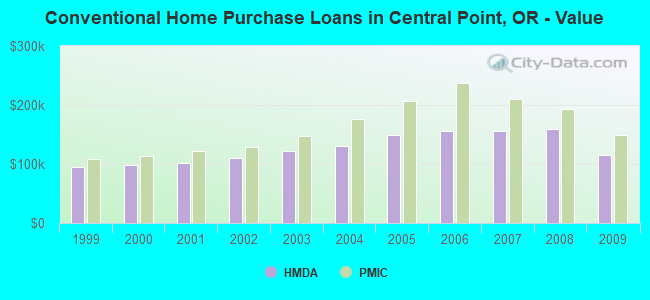
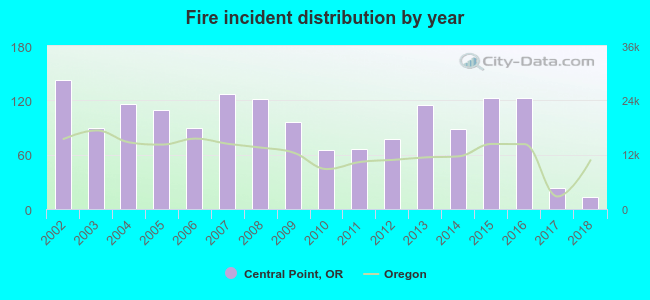 According to the data from the years 2002 - 2018 the average number of fire incidents per year is 93. The highest number of fires - 143 took place in 2002, and the least - 13 in 2018. The data has a decreasing trend.
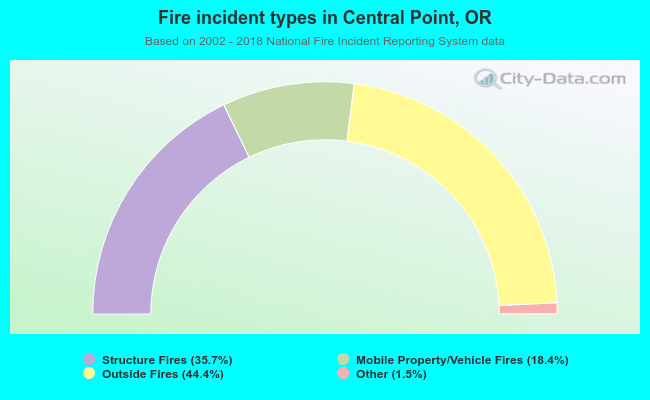 When looking into fire subcategories, the most reports belonged to: Outside Fires (44.4%), and Structure Fires (35.7%).