Chaska, Minnesota Submit your own pictures of this city and show them to the world
OSM Map
General Map
Google Map
MSN Map
OSM Map
General Map
Google Map
MSN Map
OSM Map
General Map
Google Map
MSN Map
OSM Map
General Map
Google Map
MSN Map
Please wait while loading the map...
Population in 2022: 28,262 (96% urban, 4% rural). Population change since 2000: +62.0%Males: 13,673 Females: 14,589
March 2022 cost of living index in Chaska: 113.0 (more than average, U.S. average is 100) Percentage of residents living in poverty in 2022: 3.9%for White Non-Hispanic residents , 32.3% for Black residents , 1.3% for Hispanic or Latino residents , 15.4% for American Indian residents , 0.2% for other race residents , 5.5% for two or more races residents )
Profiles of local businesses
Business Search - 14 Million verified businesses
Data:
Median household income ($)
Median household income (% change since 2000)
Household income diversity
Ratio of average income to average house value (%)
Ratio of average income to average rent
Median household income ($) - White
Median household income ($) - Black or African American
Median household income ($) - Asian
Median household income ($) - Hispanic or Latino
Median household income ($) - American Indian and Alaska Native
Median household income ($) - Multirace
Median household income ($) - Other Race
Median household income for houses/condos with a mortgage ($)
Median household income for apartments without a mortgage ($)
Races - White alone (%)
Races - White alone (% change since 2000)
Races - Black alone (%)
Races - Black alone (% change since 2000)
Races - American Indian alone (%)
Races - American Indian alone (% change since 2000)
Races - Asian alone (%)
Races - Asian alone (% change since 2000)
Races - Hispanic (%)
Races - Hispanic (% change since 2000)
Races - Native Hawaiian and Other Pacific Islander alone (%)
Races - Native Hawaiian and Other Pacific Islander alone (% change since 2000)
Races - Two or more races (%)
Races - Two or more races (% change since 2000)
Races - Other race alone (%)
Races - Other race alone (% change since 2000)
Racial diversity
Unemployment (%)
Unemployment (% change since 2000)
Unemployment (%) - White
Unemployment (%) - Black or African American
Unemployment (%) - Asian
Unemployment (%) - Hispanic or Latino
Unemployment (%) - American Indian and Alaska Native
Unemployment (%) - Multirace
Unemployment (%) - Other Race
Population density (people per square mile)
Population - Males (%)
Population - Females (%)
Population - Males (%) - White
Population - Males (%) - Black or African American
Population - Males (%) - Asian
Population - Males (%) - Hispanic or Latino
Population - Males (%) - American Indian and Alaska Native
Population - Males (%) - Multirace
Population - Males (%) - Other Race
Population - Females (%) - White
Population - Females (%) - Black or African American
Population - Females (%) - Asian
Population - Females (%) - Hispanic or Latino
Population - Females (%) - American Indian and Alaska Native
Population - Females (%) - Multirace
Population - Females (%) - Other Race
Coronavirus confirmed cases (May 19, 2024)
Deaths caused by coronavirus (May 19, 2024)
Coronavirus confirmed cases (per 100k population) (May 19, 2024)
Deaths caused by coronavirus (per 100k population) (May 19, 2024)
Daily increase in number of cases (May 19, 2024)
Weekly increase in number of cases (May 19, 2024)
Cases doubled (in days) (May 19, 2024)
Hospitalized patients (Apr 18, 2022)
Negative test results (Apr 18, 2022)
Total test results (Apr 18, 2022)
COVID Vaccine doses distributed (per 100k population) (Sep 19, 2023)
COVID Vaccine doses administered (per 100k population) (Sep 19, 2023)
COVID Vaccine doses distributed (Sep 19, 2023)
COVID Vaccine doses administered (Sep 19, 2023)
Likely homosexual households (%)
Likely homosexual households (% change since 2000)
Likely homosexual households - Lesbian couples (%)
Likely homosexual households - Lesbian couples (% change since 2000)
Likely homosexual households - Gay men (%)
Likely homosexual households - Gay men (% change since 2000)
Cost of living index
Median gross rent ($)
Median contract rent ($)
Median monthly housing costs ($)
Median house or condo value ($)
Median house or condo value ($ change since 2000)
Mean house or condo value by units in structure - 1, detached ($)
Mean house or condo value by units in structure - 1, attached ($)
Mean house or condo value by units in structure - 2 ($)
Mean house or condo value by units in structure by units in structure - 3 or 4 ($)
Mean house or condo value by units in structure - 5 or more ($)
Mean house or condo value by units in structure - Boat, RV, van, etc. ($)
Mean house or condo value by units in structure - Mobile home ($)
Median house or condo value ($) - White
Median house or condo value ($) - Black or African American
Median house or condo value ($) - Asian
Median house or condo value ($) - Hispanic or Latino
Median house or condo value ($) - American Indian and Alaska Native
Median house or condo value ($) - Multirace
Median house or condo value ($) - Other Race
Median resident age
Resident age diversity
Median resident age - Males
Median resident age - Females
Median resident age - White
Median resident age - Black or African American
Median resident age - Asian
Median resident age - Hispanic or Latino
Median resident age - American Indian and Alaska Native
Median resident age - Multirace
Median resident age - Other Race
Median resident age - Males - White
Median resident age - Males - Black or African American
Median resident age - Males - Asian
Median resident age - Males - Hispanic or Latino
Median resident age - Males - American Indian and Alaska Native
Median resident age - Males - Multirace
Median resident age - Males - Other Race
Median resident age - Females - White
Median resident age - Females - Black or African American
Median resident age - Females - Asian
Median resident age - Females - Hispanic or Latino
Median resident age - Females - American Indian and Alaska Native
Median resident age - Females - Multirace
Median resident age - Females - Other Race
Commute - mean travel time to work (minutes)
Travel time to work - Less than 5 minutes (%)
Travel time to work - Less than 5 minutes (% change since 2000)
Travel time to work - 5 to 9 minutes (%)
Travel time to work - 5 to 9 minutes (% change since 2000)
Travel time to work - 10 to 19 minutes (%)
Travel time to work - 10 to 19 minutes (% change since 2000)
Travel time to work - 20 to 29 minutes (%)
Travel time to work - 20 to 29 minutes (% change since 2000)
Travel time to work - 30 to 39 minutes (%)
Travel time to work - 30 to 39 minutes (% change since 2000)
Travel time to work - 40 to 59 minutes (%)
Travel time to work - 40 to 59 minutes (% change since 2000)
Travel time to work - 60 to 89 minutes (%)
Travel time to work - 60 to 89 minutes (% change since 2000)
Travel time to work - 90 or more minutes (%)
Travel time to work - 90 or more minutes (% change since 2000)
Marital status - Never married (%)
Marital status - Now married (%)
Marital status - Separated (%)
Marital status - Widowed (%)
Marital status - Divorced (%)
Median family income ($)
Median family income (% change since 2000)
Median non-family income ($)
Median non-family income (% change since 2000)
Median per capita income ($)
Median per capita income (% change since 2000)
Median family income ($) - White
Median family income ($) - Black or African American
Median family income ($) - Asian
Median family income ($) - Hispanic or Latino
Median family income ($) - American Indian and Alaska Native
Median family income ($) - Multirace
Median family income ($) - Other Race
Median year house/condo built
Median year apartment built
Year house built - Built 2005 or later (%)
Year house built - Built 2000 to 2004 (%)
Year house built - Built 1990 to 1999 (%)
Year house built - Built 1980 to 1989 (%)
Year house built - Built 1970 to 1979 (%)
Year house built - Built 1960 to 1969 (%)
Year house built - Built 1950 to 1959 (%)
Year house built - Built 1940 to 1949 (%)
Year house built - Built 1939 or earlier (%)
Average household size
Household density (households per square mile)
Average household size - White
Average household size - Black or African American
Average household size - Asian
Average household size - Hispanic or Latino
Average household size - American Indian and Alaska Native
Average household size - Multirace
Average household size - Other Race
Occupied housing units (%)
Vacant housing units (%)
Owner occupied housing units (%)
Renter occupied housing units (%)
Vacancy status - For rent (%)
Vacancy status - For sale only (%)
Vacancy status - Rented or sold, not occupied (%)
Vacancy status - For seasonal, recreational, or occasional use (%)
Vacancy status - For migrant workers (%)
Vacancy status - Other vacant (%)
Residents with income below the poverty level (%)
Residents with income below 50% of the poverty level (%)
Children below poverty level (%)
Poor families by family type - Married-couple family (%)
Poor families by family type - Male, no wife present (%)
Poor families by family type - Female, no husband present (%)
Poverty status for native-born residents (%)
Poverty status for foreign-born residents (%)
Poverty among high school graduates not in families (%)
Poverty among people who did not graduate high school not in families (%)
Residents with income below the poverty level (%) - White
Residents with income below the poverty level (%) - Black or African American
Residents with income below the poverty level (%) - Asian
Residents with income below the poverty level (%) - Hispanic or Latino
Residents with income below the poverty level (%) - American Indian and Alaska Native
Residents with income below the poverty level (%) - Multirace
Residents with income below the poverty level (%) - Other Race
Air pollution - Air Quality Index (AQI)
Air pollution - CO
Air pollution - NO2
Air pollution - SO2
Air pollution - Ozone
Air pollution - PM10
Air pollution - PM25
Air pollution - Pb
Crime - Murders per 100,000 population
Crime - Rapes per 100,000 population
Crime - Robberies per 100,000 population
Crime - Assaults per 100,000 population
Crime - Burglaries per 100,000 population
Crime - Thefts per 100,000 population
Crime - Auto thefts per 100,000 population
Crime - Arson per 100,000 population
Crime - City-data.com crime index
Crime - Violent crime index
Crime - Property crime index
Crime - Murders per 100,000 population (5 year average)
Crime - Rapes per 100,000 population (5 year average)
Crime - Robberies per 100,000 population (5 year average)
Crime - Assaults per 100,000 population (5 year average)
Crime - Burglaries per 100,000 population (5 year average)
Crime - Thefts per 100,000 population (5 year average)
Crime - Auto thefts per 100,000 population (5 year average)
Crime - Arson per 100,000 population (5 year average)
Crime - City-data.com crime index (5 year average)
Crime - Violent crime index (5 year average)
Crime - Property crime index (5 year average)
1996 Presidential Elections Results (%) - Democratic Party (Clinton)
1996 Presidential Elections Results (%) - Republican Party (Dole)
1996 Presidential Elections Results (%) - Other
2000 Presidential Elections Results (%) - Democratic Party (Gore)
2000 Presidential Elections Results (%) - Republican Party (Bush)
2000 Presidential Elections Results (%) - Other
2004 Presidential Elections Results (%) - Democratic Party (Kerry)
2004 Presidential Elections Results (%) - Republican Party (Bush)
2004 Presidential Elections Results (%) - Other
2008 Presidential Elections Results (%) - Democratic Party (Obama)
2008 Presidential Elections Results (%) - Republican Party (McCain)
2008 Presidential Elections Results (%) - Other
2012 Presidential Elections Results (%) - Democratic Party (Obama)
2012 Presidential Elections Results (%) - Republican Party (Romney)
2012 Presidential Elections Results (%) - Other
2016 Presidential Elections Results (%) - Democratic Party (Clinton)
2016 Presidential Elections Results (%) - Republican Party (Trump)
2016 Presidential Elections Results (%) - Other
2020 Presidential Elections Results (%) - Democratic Party (Biden)
2020 Presidential Elections Results (%) - Republican Party (Trump)
2020 Presidential Elections Results (%) - Other
Ancestries Reported - Arab (%)
Ancestries Reported - Czech (%)
Ancestries Reported - Danish (%)
Ancestries Reported - Dutch (%)
Ancestries Reported - English (%)
Ancestries Reported - French (%)
Ancestries Reported - French Canadian (%)
Ancestries Reported - German (%)
Ancestries Reported - Greek (%)
Ancestries Reported - Hungarian (%)
Ancestries Reported - Irish (%)
Ancestries Reported - Italian (%)
Ancestries Reported - Lithuanian (%)
Ancestries Reported - Norwegian (%)
Ancestries Reported - Polish (%)
Ancestries Reported - Portuguese (%)
Ancestries Reported - Russian (%)
Ancestries Reported - Scotch-Irish (%)
Ancestries Reported - Scottish (%)
Ancestries Reported - Slovak (%)
Ancestries Reported - Subsaharan African (%)
Ancestries Reported - Swedish (%)
Ancestries Reported - Swiss (%)
Ancestries Reported - Ukrainian (%)
Ancestries Reported - United States (%)
Ancestries Reported - Welsh (%)
Ancestries Reported - West Indian (%)
Ancestries Reported - Other (%)
Educational Attainment - No schooling completed (%)
Educational Attainment - Less than high school (%)
Educational Attainment - High school or equivalent (%)
Educational Attainment - Less than 1 year of college (%)
Educational Attainment - 1 or more years of college (%)
Educational Attainment - Associate degree (%)
Educational Attainment - Bachelor's degree (%)
Educational Attainment - Master's degree (%)
Educational Attainment - Professional school degree (%)
Educational Attainment - Doctorate degree (%)
School Enrollment - Nursery, preschool (%)
School Enrollment - Kindergarten (%)
School Enrollment - Grade 1 to 4 (%)
School Enrollment - Grade 5 to 8 (%)
School Enrollment - Grade 9 to 12 (%)
School Enrollment - College undergrad (%)
School Enrollment - Graduate or professional (%)
School Enrollment - Not enrolled in school (%)
School enrollment - Public schools (%)
School enrollment - Private schools (%)
School enrollment - Not enrolled (%)
Median number of rooms in houses and condos
Median number of rooms in apartments
Housing units lacking complete plumbing facilities (%)
Housing units lacking complete kitchen facilities (%)
Density of houses
Urban houses (%)
Rural houses (%)
Households with people 60 years and over (%)
Households with people 65 years and over (%)
Households with people 75 years and over (%)
Households with one or more nonrelatives (%)
Households with no nonrelatives (%)
Population in households (%)
Family households (%)
Nonfamily households (%)
Population in families (%)
Family households with own children (%)
Median number of bedrooms in owner occupied houses
Mean number of bedrooms in owner occupied houses
Median number of bedrooms in renter occupied houses
Mean number of bedrooms in renter occupied houses
Median number of vehichles in owner occupied houses
Mean number of vehichles in owner occupied houses
Median number of vehichles in renter occupied houses
Mean number of vehichles in renter occupied houses
Mortgage status - with mortgage (%)
Mortgage status - with second mortgage (%)
Mortgage status - with home equity loan (%)
Mortgage status - with both second mortgage and home equity loan (%)
Mortgage status - without a mortgage (%)
Average family size
Average family size - White
Average family size - Black or African American
Average family size - Asian
Average family size - Hispanic or Latino
Average family size - American Indian and Alaska Native
Average family size - Multirace
Average family size - Other Race
Geographical mobility - Same house 1 year ago (%)
Geographical mobility - Moved within same county (%)
Geographical mobility - Moved from different county within same state (%)
Geographical mobility - Moved from different state (%)
Geographical mobility - Moved from abroad (%)
Place of birth - Born in state of residence (%)
Place of birth - Born in other state (%)
Place of birth - Native, outside of US (%)
Place of birth - Foreign born (%)
Housing units in structures - 1, detached (%)
Housing units in structures - 1, attached (%)
Housing units in structures - 2 (%)
Housing units in structures - 3 or 4 (%)
Housing units in structures - 5 to 9 (%)
Housing units in structures - 10 to 19 (%)
Housing units in structures - 20 to 49 (%)
Housing units in structures - 50 or more (%)
Housing units in structures - Mobile home (%)
Housing units in structures - Boat, RV, van, etc. (%)
House/condo owner moved in on average (years ago)
Renter moved in on average (years ago)
Year householder moved into unit - Moved in 1999 to March 2000 (%)
Year householder moved into unit - Moved in 1995 to 1998 (%)
Year householder moved into unit - Moved in 1990 to 1994 (%)
Year householder moved into unit - Moved in 1980 to 1989 (%)
Year householder moved into unit - Moved in 1970 to 1979 (%)
Year householder moved into unit - Moved in 1969 or earlier (%)
Means of transportation to work - Drove car alone (%)
Means of transportation to work - Carpooled (%)
Means of transportation to work - Public transportation (%)
Means of transportation to work - Bus or trolley bus (%)
Means of transportation to work - Streetcar or trolley car (%)
Means of transportation to work - Subway or elevated (%)
Means of transportation to work - Railroad (%)
Means of transportation to work - Ferryboat (%)
Means of transportation to work - Taxicab (%)
Means of transportation to work - Motorcycle (%)
Means of transportation to work - Bicycle (%)
Means of transportation to work - Walked (%)
Means of transportation to work - Other means (%)
Working at home (%)
Industry diversity
Most Common Industries - Agriculture, forestry, fishing and hunting, and mining (%)
Most Common Industries - Agriculture, forestry, fishing and hunting (%)
Most Common Industries - Mining, quarrying, and oil and gas extraction (%)
Most Common Industries - Construction (%)
Most Common Industries - Manufacturing (%)
Most Common Industries - Wholesale trade (%)
Most Common Industries - Retail trade (%)
Most Common Industries - Transportation and warehousing, and utilities (%)
Most Common Industries - Transportation and warehousing (%)
Most Common Industries - Utilities (%)
Most Common Industries - Information (%)
Most Common Industries - Finance and insurance, and real estate and rental and leasing (%)
Most Common Industries - Finance and insurance (%)
Most Common Industries - Real estate and rental and leasing (%)
Most Common Industries - Professional, scientific, and management, and administrative and waste management services (%)
Most Common Industries - Professional, scientific, and technical services (%)
Most Common Industries - Management of companies and enterprises (%)
Most Common Industries - Administrative and support and waste management services (%)
Most Common Industries - Educational services, and health care and social assistance (%)
Most Common Industries - Educational services (%)
Most Common Industries - Health care and social assistance (%)
Most Common Industries - Arts, entertainment, and recreation, and accommodation and food services (%)
Most Common Industries - Arts, entertainment, and recreation (%)
Most Common Industries - Accommodation and food services (%)
Most Common Industries - Other services, except public administration (%)
Most Common Industries - Public administration (%)
Occupation diversity
Most Common Occupations - Management, business, science, and arts occupations (%)
Most Common Occupations - Management, business, and financial occupations (%)
Most Common Occupations - Management occupations (%)
Most Common Occupations - Business and financial operations occupations (%)
Most Common Occupations - Computer, engineering, and science occupations (%)
Most Common Occupations - Computer and mathematical occupations (%)
Most Common Occupations - Architecture and engineering occupations (%)
Most Common Occupations - Life, physical, and social science occupations (%)
Most Common Occupations - Education, legal, community service, arts, and media occupations (%)
Most Common Occupations - Community and social service occupations (%)
Most Common Occupations - Legal occupations (%)
Most Common Occupations - Education, training, and library occupations (%)
Most Common Occupations - Arts, design, entertainment, sports, and media occupations (%)
Most Common Occupations - Healthcare practitioners and technical occupations (%)
Most Common Occupations - Health diagnosing and treating practitioners and other technical occupations (%)
Most Common Occupations - Health technologists and technicians (%)
Most Common Occupations - Service occupations (%)
Most Common Occupations - Healthcare support occupations (%)
Most Common Occupations - Protective service occupations (%)
Most Common Occupations - Fire fighting and prevention, and other protective service workers including supervisors (%)
Most Common Occupations - Law enforcement workers including supervisors (%)
Most Common Occupations - Food preparation and serving related occupations (%)
Most Common Occupations - Building and grounds cleaning and maintenance occupations (%)
Most Common Occupations - Personal care and service occupations (%)
Most Common Occupations - Sales and office occupations (%)
Most Common Occupations - Sales and related occupations (%)
Most Common Occupations - Office and administrative support occupations (%)
Most Common Occupations - Natural resources, construction, and maintenance occupations (%)
Most Common Occupations - Farming, fishing, and forestry occupations (%)
Most Common Occupations - Construction and extraction occupations (%)
Most Common Occupations - Installation, maintenance, and repair occupations (%)
Most Common Occupations - Production, transportation, and material moving occupations (%)
Most Common Occupations - Production occupations (%)
Most Common Occupations - Transportation occupations (%)
Most Common Occupations - Material moving occupations (%)
People in Group quarters - Institutionalized population (%)
People in Group quarters - Correctional institutions (%)
People in Group quarters - Federal prisons and detention centers (%)
People in Group quarters - Halfway houses (%)
People in Group quarters - Local jails and other confinement facilities (including police lockups) (%)
People in Group quarters - Military disciplinary barracks (%)
People in Group quarters - State prisons (%)
People in Group quarters - Other types of correctional institutions (%)
People in Group quarters - Nursing homes (%)
People in Group quarters - Hospitals/wards, hospices, and schools for the handicapped (%)
People in Group quarters - Hospitals/wards and hospices for chronically ill (%)
People in Group quarters - Hospices or homes for chronically ill (%)
People in Group quarters - Military hospitals or wards for chronically ill (%)
People in Group quarters - Other hospitals or wards for chronically ill (%)
People in Group quarters - Hospitals or wards for drug/alcohol abuse (%)
People in Group quarters - Mental (Psychiatric) hospitals or wards (%)
People in Group quarters - Schools, hospitals, or wards for the mentally retarded (%)
People in Group quarters - Schools, hospitals, or wards for the physically handicapped (%)
People in Group quarters - Institutions for the deaf (%)
People in Group quarters - Institutions for the blind (%)
People in Group quarters - Orthopedic wards and institutions for the physically handicapped (%)
People in Group quarters - Wards in general hospitals for patients who have no usual home elsewhere (%)
People in Group quarters - Wards in military hospitals for patients who have no usual home elsewhere (%)
People in Group quarters - Juvenile institutions (%)
People in Group quarters - Long-term care (%)
People in Group quarters - Homes for abused, dependent, and neglected children (%)
People in Group quarters - Residential treatment centers for emotionally disturbed children (%)
People in Group quarters - Training schools for juvenile delinquents (%)
People in Group quarters - Short-term care, detention or diagnostic centers for delinquent children (%)
People in Group quarters - Type of juvenile institution unknown (%)
People in Group quarters - Noninstitutionalized population (%)
People in Group quarters - College dormitories (includes college quarters off campus) (%)
People in Group quarters - Military quarters (%)
People in Group quarters - On base (%)
People in Group quarters - Barracks, unaccompanied personnel housing (UPH), (Enlisted/Officer), ;and similar group living quarters for military personnel (%)
People in Group quarters - Transient quarters for temporary residents (%)
People in Group quarters - Military ships (%)
People in Group quarters - Group homes (%)
People in Group quarters - Homes or halfway houses for drug/alcohol abuse (%)
People in Group quarters - Homes for the mentally ill (%)
People in Group quarters - Homes for the mentally retarded (%)
People in Group quarters - Homes for the physically handicapped (%)
People in Group quarters - Other group homes (%)
People in Group quarters - Religious group quarters (%)
People in Group quarters - Dormitories (%)
People in Group quarters - Agriculture workers' dormitories on farms (%)
People in Group quarters - Job Corps and vocational training facilities (%)
People in Group quarters - Other workers' dormitories (%)
People in Group quarters - Crews of maritime vessels (%)
People in Group quarters - Other nonhousehold living situations (%)
People in Group quarters - Other noninstitutional group quarters (%)
Residents speaking English at home (%)
Residents speaking English at home - Born in the United States (%)
Residents speaking English at home - Native, born elsewhere (%)
Residents speaking English at home - Foreign born (%)
Residents speaking Spanish at home (%)
Residents speaking Spanish at home - Born in the United States (%)
Residents speaking Spanish at home - Native, born elsewhere (%)
Residents speaking Spanish at home - Foreign born (%)
Residents speaking other language at home (%)
Residents speaking other language at home - Born in the United States (%)
Residents speaking other language at home - Native, born elsewhere (%)
Residents speaking other language at home - Foreign born (%)
Class of Workers - Employee of private company (%)
Class of Workers - Self-employed in own incorporated business (%)
Class of Workers - Private not-for-profit wage and salary workers (%)
Class of Workers - Local government workers (%)
Class of Workers - State government workers (%)
Class of Workers - Federal government workers (%)
Class of Workers - Self-employed workers in own not incorporated business and Unpaid family workers (%)
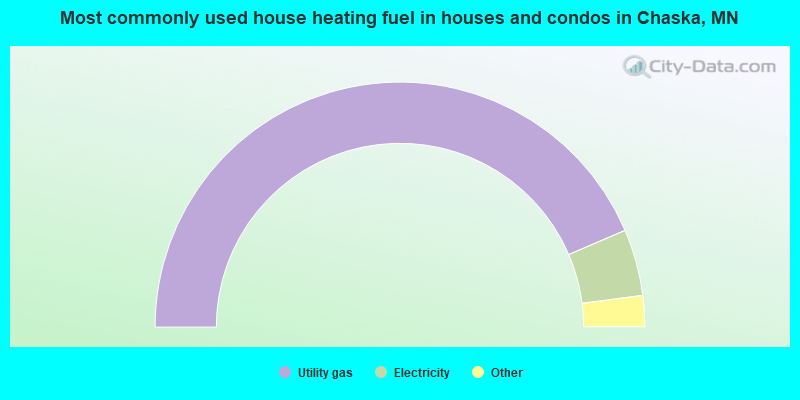
House heating fuel used in houses and condos - Utility gas (%)
House heating fuel used in houses and condos - Bottled, tank, or LP gas (%)
House heating fuel used in houses and condos - Electricity (%)
House heating fuel used in houses and condos - Fuel oil, kerosene, etc. (%)
House heating fuel used in houses and condos - Coal or coke (%)
House heating fuel used in houses and condos - Wood (%)
House heating fuel used in houses and condos - Solar energy (%)
House heating fuel used in houses and condos - Other fuel (%)
House heating fuel used in houses and condos - No fuel used (%)
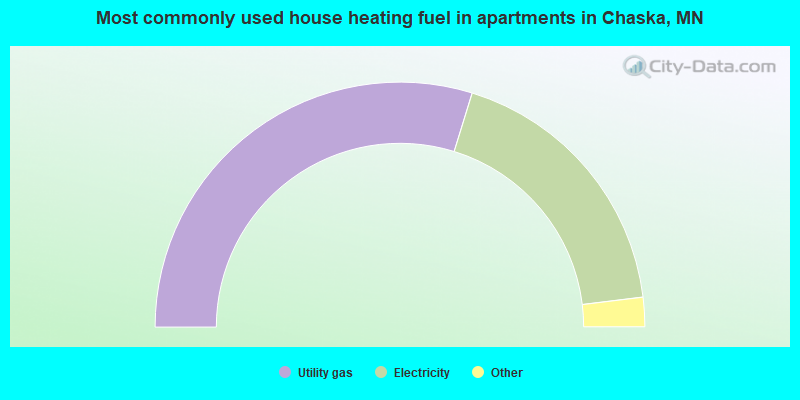
House heating fuel used in apartments - Utility gas (%)
House heating fuel used in apartments - Bottled, tank, or LP gas (%)
House heating fuel used in apartments - Electricity (%)
House heating fuel used in apartments - Fuel oil, kerosene, etc. (%)
House heating fuel used in apartments - Coal or coke (%)
House heating fuel used in apartments - Wood (%)
House heating fuel used in apartments - Solar energy (%)
House heating fuel used in apartments - Other fuel (%)
House heating fuel used in apartments - No fuel used (%)
Armed forces status - In Armed Forces (%)
Armed forces status - Civilian (%)
Armed forces status - Civilian - Veteran (%)
Armed forces status - Civilian - Nonveteran (%)
Fatal accidents locations in years 2005-2021
Fatal accidents locations in 2005
Fatal accidents locations in 2006
Fatal accidents locations in 2007
Fatal accidents locations in 2008
Fatal accidents locations in 2009
Fatal accidents locations in 2010
Fatal accidents locations in 2011
Fatal accidents locations in 2012
Fatal accidents locations in 2013
Fatal accidents locations in 2014
Fatal accidents locations in 2015
Fatal accidents locations in 2016
Fatal accidents locations in 2017
Fatal accidents locations in 2018
Fatal accidents locations in 2019
Fatal accidents locations in 2020
Fatal accidents locations in 2021
Alcohol use - People drinking some alcohol every month (%)
Alcohol use - People not drinking at all (%)
Alcohol use - Average days/month drinking alcohol
Alcohol use - Average drinks/week
Alcohol use - Average days/year people drink much
Audiometry - Average condition of hearing (%)
Audiometry - People that can hear a whisper from across a quiet room (%)
Audiometry - People that can hear normal voice from across a quiet room (%)
Audiometry - Ears ringing, roaring, buzzing (%)
Audiometry - Had a job exposure to loud noise (%)
Audiometry - Had off-work exposure to loud noise (%)
Blood Pressure & Cholesterol - Has high blood pressure (%)
Blood Pressure & Cholesterol - Checking blood pressure at home (%)
Blood Pressure & Cholesterol - Frequently checking blood cholesterol (%)
Blood Pressure & Cholesterol - Has high cholesterol level (%)
Consumer Behavior - Money monthly spent on food at supermarket/grocery store
Consumer Behavior - Money monthly spent on food at other stores
Consumer Behavior - Money monthly spent on eating out
Consumer Behavior - Money monthly spent on carryout/delivered foods
Consumer Behavior - Income spent on food at supermarket/grocery store (%)
Consumer Behavior - Income spent on food at other stores (%)
Consumer Behavior - Income spent on eating out (%)
Consumer Behavior - Income spent on carryout/delivered foods (%)
Current Health Status - General health condition (%)
Current Health Status - Blood donors (%)
Current Health Status - Has blood ever tested for HIV virus (%)
Current Health Status - Left-handed people (%)
Dermatology - People using sunscreen (%)
Diabetes - Diabetics (%)
Diabetes - Had a blood test for high blood sugar (%)
Diabetes - People taking insulin (%)
Diet Behavior & Nutrition - Diet health (%)
Diet Behavior & Nutrition - Milk product consumption (# of products/month)
Diet Behavior & Nutrition - Meals not home prepared (#/week)
Diet Behavior & Nutrition - Meals from fast food or pizza place (#/week)
Diet Behavior & Nutrition - Ready-to-eat foods (#/month)
Diet Behavior & Nutrition - Frozen meals/pizza (#/month)
Drug Use - People that ever used marijuana or hashish (%)
Drug Use - Ever used hard drugs (%)
Drug Use - Ever used any form of cocaine (%)
Drug Use - Ever used heroin (%)
Drug Use - Ever used methamphetamine (%)
Health Insurance - People covered by health insurance (%)
Kidney Conditions-Urology - Avg. # of times urinating at night
Medical Conditions - People with asthma (%)
Medical Conditions - People with anemia (%)
Medical Conditions - People with psoriasis (%)
Medical Conditions - People with overweight (%)
Medical Conditions - Elderly people having difficulties in thinking or remembering (%)
Medical Conditions - People who ever received blood transfusion (%)
Medical Conditions - People having trouble seeing even with glass/contacts (%)
Medical Conditions - People with arthritis (%)
Medical Conditions - People with gout (%)
Medical Conditions - People with congestive heart failure (%)
Medical Conditions - People with coronary heart disease (%)
Medical Conditions - People with angina pectoris (%)
Medical Conditions - People who ever had heart attack (%)
Medical Conditions - People who ever had stroke (%)
Medical Conditions - People with emphysema (%)
Medical Conditions - People with thyroid problem (%)
Medical Conditions - People with chronic bronchitis (%)
Medical Conditions - People with any liver condition (%)
Medical Conditions - People who ever had cancer or malignancy (%)
Mental Health - People who have little interest in doing things (%)
Mental Health - People feeling down, depressed, or hopeless (%)
Mental Health - People who have trouble sleeping or sleeping too much (%)
Mental Health - People feeling tired or having little energy (%)
Mental Health - People with poor appetite or overeating (%)
Mental Health - People feeling bad about themself (%)
Mental Health - People who have trouble concentrating on things (%)
Mental Health - People moving or speaking slowly or too fast (%)
Mental Health - People having thoughts they would be better off dead (%)
Oral Health - Average years since last visit a dentist
Oral Health - People embarrassed because of mouth (%)
Oral Health - People with gum disease (%)
Oral Health - General health of teeth and gums (%)
Oral Health - Average days a week using dental floss/device
Oral Health - Average days a week using mouthwash for dental problem
Oral Health - Average number of teeth
Pesticide Use - Households using pesticides to control insects (%)
Pesticide Use - Households using pesticides to kill weeds (%)
Physical Activity - People doing vigorous-intensity work activities (%)
Physical Activity - People doing moderate-intensity work activities (%)
Physical Activity - People walking or bicycling (%)
Physical Activity - People doing vigorous-intensity recreational activities (%)
Physical Activity - People doing moderate-intensity recreational activities (%)
Physical Activity - Average hours a day doing sedentary activities
Physical Activity - Average hours a day watching TV or videos
Physical Activity - Average hours a day using computer
Physical Functioning - People having limitations keeping them from working (%)
Physical Functioning - People limited in amount of work they can do (%)
Physical Functioning - People that need special equipment to walk (%)
Physical Functioning - People experiencing confusion/memory problems (%)
Physical Functioning - People requiring special healthcare equipment (%)
Prescription Medications - Average number of prescription medicines taking
Preventive Aspirin Use - Adults 40+ taking low-dose aspirin (%)
Reproductive Health - Vaginal deliveries (%)
Reproductive Health - Cesarean deliveries (%)
Reproductive Health - Deliveries resulted in a live birth (%)
Reproductive Health - Pregnancies resulted in a delivery (%)
Reproductive Health - Women breastfeeding newborns (%)
Reproductive Health - Women that had a hysterectomy (%)
Reproductive Health - Women that had both ovaries removed (%)
Reproductive Health - Women that have ever taken birth control pills (%)
Reproductive Health - Women taking birth control pills (%)
Reproductive Health - Women that have ever used Depo-Provera or injectables (%)
Reproductive Health - Women that have ever used female hormones (%)
Sexual Behavior - People 18+ that ever had sex (vaginal, anal, or oral) (%)
Sexual Behavior - Males 18+ that ever had vaginal sex with a woman (%)
Sexual Behavior - Males 18+ that ever performed oral sex on a woman (%)
Sexual Behavior - Males 18+ that ever had anal sex with a woman (%)
Sexual Behavior - Males 18+ that ever had any sex with a man (%)
Sexual Behavior - Females 18+ that ever had vaginal sex with a man (%)
Sexual Behavior - Females 18+ that ever performed oral sex on a man (%)
Sexual Behavior - Females 18+ that ever had anal sex with a man (%)
Sexual Behavior - Females 18+ that ever had any kind of sex with a woman (%)
Sexual Behavior - Average age people first had sex
Sexual Behavior - Average number of female sex partners in lifetime (males 18+)
Sexual Behavior - Average number of female vaginal sex partners in lifetime (males 18+)
Sexual Behavior - Average age people first performed oral sex on a woman (18+)
Sexual Behavior - Average number of woman performed oral sex on in lifetime (18+)
Sexual Behavior - Average number of male sex partners in lifetime (males 18+)
Sexual Behavior - Average number of male anal sex partners in lifetime (males 18+)
Sexual Behavior - Average age people first performed oral sex on a man (18+)
Sexual Behavior - Average number of male oral sex partners in lifetime (18+)
Sexual Behavior - People using protection when performing oral sex (%)
Sexual Behavior - Average number of times people have vaginal or anal sex a year
Sexual Behavior - People having sex without condom (%)
Sexual Behavior - Average number of male sex partners in lifetime (females 18+)
Sexual Behavior - Average number of male vaginal sex partners in lifetime (females 18+)
Sexual Behavior - Average number of female sex partners in lifetime (females 18+)
Sexual Behavior - Circumcised males 18+ (%)
Sleep Disorders - Average hours sleeping at night
Sleep Disorders - People that has trouble sleeping (%)
Smoking-Cigarette Use - People smoking cigarettes (%)
Taste & Smell - People 40+ having problems with smell (%)
Taste & Smell - People 40+ having problems with taste (%)
Taste & Smell - People 40+ that ever had wisdom teeth removed (%)
Taste & Smell - People 40+ that ever had tonsils teeth removed (%)
Taste & Smell - People 40+ that ever had a loss of consciousness because of a head injury (%)
Taste & Smell - People 40+ that ever had a broken nose or other serious injury to face or skull (%)
Taste & Smell - People 40+ that ever had two or more sinus infections (%)
Weight - Average height (inches)
Weight - Average weight (pounds)
Weight - Average BMI
Weight - People that are obese (%)
Weight - People that ever were obese (%)
Weight - People trying to lose weight (%)
According to our research of Minnesota and other state lists, there was 1 registered sex offender living in Chaska, Minnesota as of May 19, 2024 . The ratio of all residents to sex offenders in Chaska is 25,395 to 1.The ratio of registered sex offenders to all residents in this city is much lower than the state average.
Officers per 1,000 residents here:
0.94Minnesota average:
1.76
Latest news from Chaska, MN collected exclusively by city-data.com from local newspapers, TV, and radio stations
Ancestries: German (26.3%), American (7.3%), European (5.8%), Irish (5.5%), Norwegian (5.0%), English (3.7%).
Current Local Time:
Land area: 13.7 square miles.
Population density: 2,058 people per square mile (low).
1,953 residents are foreign born (2.4% Asia , 2.3% Latin America , 1.4% Europe ).
This city:
6.9%Minnesota:
8.5%
Median real estate property taxes paid for housing units with mortgages in 2022: $3,854 (1.0%)Median real estate property taxes paid for housing units with no mortgage in 2022: $3,007 (1.0%)
Nearest city with pop. 50,000+: Eden Prairie, MN
Nearest city with pop. 200,000+: Minneapolis, MN
Nearest city with pop. 1,000,000+: Chicago, IL
Nearest cities:
Latitude: 44.81 N, Longitude: 93.60 W
Daytime population change due to commuting: -2,344 (-8.2%)Workers who live and work in this city: 5,928 (36.3%)
Single-family new house construction building permits:
2022: 176 buildings , average cost: $324,4002021: 227 buildings , average cost: $330,1002020: 114 buildings , average cost: $252,6002019: 113 buildings , average cost: $279,7002018: 78 buildings , average cost: $240,9002017: 103 buildings , average cost: $236,3002016: 134 buildings , average cost: $255,2002015: 134 buildings , average cost: $266,2002014: 139 buildings , average cost: $262,4002013: 134 buildings , average cost: $264,6002012: 123 buildings , average cost: $270,6002011: 54 buildings , average cost: $252,7002010: 44 buildings , average cost: $250,4002009: 48 buildings , average cost: $224,2002008: 52 buildings , average cost: $206,8002007: 60 buildings , average cost: $225,4002006: 74 buildings , average cost: $245,2002005: 145 buildings , average cost: $208,3002004: 235 buildings , average cost: $208,6002003: 283 buildings , average cost: $197,9002002: 307 buildings , average cost: $164,6002001: 176 buildings , average cost: $176,4002000: 140 buildings , average cost: $187,0001999: 194 buildings , average cost: $171,6001998: 165 buildings , average cost: $174,9001997: 161 buildings , average cost: $163,100Unemployment in December 2023:
Population change in the 1990s: +5,942 (+51.6%).
Most common occupations in Chaska, MN (%)
Both Males Females
Sales representatives, services, wholesale and manufacturing (4.7%)
Computer specialists (4.4%)
Other management occupations, except farmers and farm managers (4.3%)
Other office and administrative support workers, including supervisors (4.3%)
Other production occupations, including supervisors (4.0%)
Other sales and related occupations, including supervisors (3.4%)
Material recording, scheduling, dispatching, and distributing workers (2.7%)
Sales representatives, services, wholesale and manufacturing (6.8%)
Computer specialists (6.6%)
Other production occupations, including supervisors (5.1%)
Engineers (4.6%)
Electrical equipment mechanics and other installation, maintenance, and repair workers, including supervisors (4.3%)
Other management occupations, except farmers and farm managers (4.0%)
Other sales and related occupations, including supervisors (3.9%)
Other office and administrative support workers, including supervisors (7.6%)
Secretaries and administrative assistants (4.8%)
Other management occupations, except farmers and farm managers (4.7%)
Information and record clerks, except customer service representatives (4.6%)
Preschool, kindergarten, elementary, and middle school teachers (4.5%)
Customer service representatives (3.6%)
Other teachers, instructors, education, training, and library occupations (3.2%)
Tornado activity:
Chaska-area historical tornado activity is slightly above Minnesota state average. It is 31% greater than the overall U.S. average.
On 5/6/1965, a category F4 (max. wind speeds 207-260 mph) tornado 4.3 miles away from the Chaska city center caused between $5,000,000 and $50,000,000 in damages.
On 5/6/1965, a category F4 tornado 7.7 miles away from the city center killed 3 people and injured 175 people and caused between $5,000,000 and $50,000,000 in damages.
Earthquake activity:
Chaska-area historical earthquake activity is significantly above Minnesota state average. It is 53% smaller than the overall U.S. average. On 7/9/1975 at 14:54:15, a magnitude 4.6 (4.6 MB, Class: Light, Intensity: IV - V) earthquake occurred 133.0 miles away from Chaska center On 6/5/1993 at 01:24:53, a magnitude 4.1 (4.1 LG, Depth: 6.2 mi) earthquake occurred 144.2 miles away from the city center On 3/4/1983 at 06:32:18, a magnitude 4.6 (4.4 MB, 4.6 LG, 4.4 ML) earthquake occurred 289.5 miles away from the city center On 10/20/1995 at 15:57:18, a magnitude 3.7 (3.7 LG, Depth: 3.1 mi, Class: Light, Intensity: II - III) earthquake occurred 172.7 miles away from Chaska center On 2/9/1994 at 08:45:35, a magnitude 3.1 (3.1 LG, Depth: 3.1 mi) earthquake occurred 69.9 miles away from the city center On 11/3/2002 at 20:41:56, a magnitude 4.3 (4.3 MB, Depth: 3.1 mi) earthquake occurred 299.8 miles away from the city center Magnitude types: regional Lg-wave magnitude (LG), body-wave magnitude (MB), local magnitude (ML) Natural disasters: The number of natural disasters in Carver County (15) is near the US average (15).Major Disasters (Presidential) Declared: 11Emergencies Declared: 3Floods: 11, Storms: 7, Tornadoes: 3, Winds: 2, Drought: 1, Hurricane: 1, Landslide: 1, Mudslide: 1, Other: 1 (Note: some incidents may be assigned to more than one category). Main business address for: ENTEGRIS INC PLASTICS PRODUCTS, NEC ), LIFECORE BIOMEDICAL INC BIOLOGICAL PRODUCTS (NO DIAGNOSTIC SUBSTANCES) ), FSI INTERNATIONAL INC SPECIAL INDUSTRY MACHINERY, NEC ).
Hospitals and medical centers in Chaska: AUBURN MANOR (501 OAK STREET)
Other hospitals and medical centers near Chaska: COMMUNITY LIVING INC COTTAGE 4 (Hospital, about 5 miles away; VICTORIA, MN)
DELPHI (Hospital, about 5 miles away; SHAKOPEE, MN)
MOUNT OLIVET ROLLING ACRES (Hospital, about 6 miles away; VICTORIA, MN)
FMS DIALYSIS - SHAKOPEE (Dialysis Facility, about 6 miles away; SHAKOPEE, MN)
ST GERTRUDES HEALTH CENTER (Nursing Home, about 6 miles away; SHAKOPEE, MN)
MSOCS EDEN PRAIRIE DELL (Hospital, about 7 miles away; EDEN PRAIRIE, MN)
EXCELSIOR NURSING HOME (Nursing Home, about 7 miles away; EXCELSIOR, MN)
Colleges/universities with over 2000 students nearest to Chaska:
Normandale Community College (about 14 miles; Bloomington, MN ; Full-time enrollment: 7,048)
Minneapolis Community and Technical College (about 20 miles; Minneapolis, MN ; FT enrollment: 6,726)
Capella University (about 20 miles; Minneapolis, MN ; FT enrollment: 21,718)
Walden University (about 21 miles; Minneapolis, MN ; FT enrollment: 62,473)
Augsburg College (about 21 miles; Minneapolis, MN ; FT enrollment: 2,954)
University of Minnesota-Twin Cities (about 22 miles; Minneapolis, MN ; FT enrollment: 43,506)
St Catherine University (about 22 miles; Saint Paul, MN ; FT enrollment: 3,771)
Public high schools in Chaska: CHASKA HIGH SCHOOL Location: 545 PIONEER TR, Grades: 9-12)INTEGRATED ARTS ACADEMY Location: 11 PEAVY RD, Grades: 9-12)
112 ALC AFTER SCHOOL & SUMMER SCH Location: 11 PEAVEY RD, Grades: 9-12)
PRAIRIECARE CHASKA Location: 111 HUNDERTMARK RD, Grades: KG-12)
Public elementary/middle schools in Chaska: WORLD LEARNER CHARTER SCHOOL Location: 112050 HUNDERTMARK RD, Grades: 1-8, Charter school )CHASKA ELEMENTARY Location: 1800 N CHESTNUT ST, Grades: KG-5)CHASKA MIDDLE SCHOOL EAST Location: 1600 PARK RIDGE DR, Grades: 6-8)JONATHAN ELEMENTARY Location: 11300 PIONEER TR W, Grades: KG-5)CHASKA MIDDLE SCHOOL WEST Location: 140 ENGLER BLVD, Grades: 6-8)CLOVER RIDGE ELEMENTARY Location: 114000 HUNDERMARK RD, Grades: 1-5)PIONEER RIDGE MIDDLE SCHOOL Location: 1085 PIONEER TR E, Grades: 6-8)
LA ACADEMIA Location: 110600 VILLAGE RD, Grades: KG-3)
112 ALC MIDDLE SCHOOL Location: 11 PEAVEY RD, Grades: 6-8)
Private elementary/middle schools in Chaska:
See full list of schools located in Chaska Library in Chaska: CARVER COUNTY LIBRARY SYSTEM Operating income: $3,461,638; Location: 4 CITY HALL PLAZA; 219,150 books ; 15,187 e-books ; 12,721 audio materials ; 8,939 video materials ; 8 local licensed databases ; 14 state licensed databases ; 12 other licensed databases ; 767 print serial subscriptions )
User-submitted facts and corrections:
current home of Paul Swanson
Notable locations in Chaska: (A) , Hazeltine National Golf Club (B) , Chaska Town Corner (C) , Carver County Sheriff's Office (D) , Chaska Fire Department (E) , Chaska Police Department (F) , Chaska City Hall (G) , Carver County Library (H) , Chaska Library (I) , Chaska Fire Department (J) , Carver County Courthouse (K) . Display/hide their locations on the map
Shopping Centers: (1) , Chaska Commons Shopping Center (2) . Display/hide their locations on the map
Main business address in Chaska include: (A) , LIFECORE BIOMEDICAL INC (B) , FSI INTERNATIONAL INC (C) . Display/hide their locations on the map
Churches in Chaska include: (A) , Saint John's Lutheran Church (B) , Guardian Angels Church (C) , Crown of Glory Lutheran Church (D) , Chaska Moravian Church (E) , United Methodist Church (F) , Church of Christ (G) , Valley Evangelical Free Church (H) . Display/hide their locations on the map
Cemeteries: (1) , Moravian Cemetery (2) . Display/hide their locations on the map
Lakes and reservoirs: (A) , Big Woods Lake (B) , McKnight Lake (C) , Lake Jonathan (D) , Firemens Clayhole (E) , Brickyard Clayhole (F) , Courthouse Lake (G) , Firemans Lake (H) . Display/hide their locations on the map
Creek: (A) . Display/hide its location on the map
Parks in Chaska include: (1) , Friendship Park (2) , Pioneer Park (3) , Cortina Park (4) , Firemens Park (5) . Display/hide their locations on the map
Tourist attraction:
Hotels:
Birthplace of: Brad Hand - Baseball player, Gordon Paschka - Football player, Spencer Tollackson - College basketball player (Minnesota Golden Gophers).
Carver County has a predicted average indoor radon screening level greater than 4 pCi/L (pico curies per liter) - Highest Potential Drinking water stations with addresses in Chaska and their reported violations in the past:
JACKSON HEIGHTS MOBILE HOME PARK (Population served: 220, Groundwater):
Past monitoring violations:
Initial Tap Sampling for Pb and Cu - In JUL-01-1993, Contaminant: Lead and Copper Rule. Follow-up actions: St Violation/Reminder Notice (2 times from NOV-01-1993 to DEC-01-1993), St Formal NOV issued (FEB-11-1994), St Other (MAR-28-1994), St Compliance achieved (MAR-30-1994), Fed PAO issued (MAY-23-1994), Fed FAO issued (OCT-31-1994)
Drinking water stations with addresses in Chaska that have no violations reported:
CHASKA (Address: One City Hall Plaza Population served: 24,048, Primary Water Source Type: Groundwater)
Average household size: This city:
2.7 peopleMinnesota:
2.5 people
Percentage of family households: This city:
70.2%Whole state:
64.6%
Percentage of households with unmarried partners: This city:
6.5%Whole state:
6.9%
Likely homosexual households (counted as self-reported same-sex unmarried-partner households)
Lesbian couples: 0.3% of all households Gay men: 0.2% of all households
People in group quarters in Chaska in 2010:
90 people in local jails and other municipal confinement facilities
23 people in group homes intended for adults
5 people in nursing facilities/skilled-nursing facilities
People in group quarters in Chaska in 2000:
92 people in nursing homes
82 people in local jails and other confinement facilities (including police lockups)
20 people in other group homes
8 people in other noninstitutional group quarters
4 people in homes or halfway houses for drug/alcohol abuse
3 people in homes for the mentally retarded
Banks with branches in Chaska (2011 data):
Wells Fargo Bank, National Association: Chaska Branch at 200 Pioneer Trail, branch established on 1997/06/20; Chaska Downtown Branch at 400 N Chestnut Street, branch established on 1870/04/01. Info updated 2011/04/05: Bank assets: $1,161,490.0 mil, Deposits: $905,653.0 mil, headquarters in Sioux Falls, SD, positive income , 6395 total offices , Holding Company: Wells Fargo & Company
KleinBank: Chaska Branch at 301 Chestnut Street, branch established on 1906/09/01; Chaska Commons Branch at 120 Pioneer Trail, branch established on 1997/06/26. Info updated 2010/11/22: Bank assets: $1,504.4 mil, Deposits: $1,255.9 mil, headquarters in Big Lake, MN, positive income , Commercial Lending Specialization, 22 total offices , Holding Company: Klein Financial, Inc.
Community Bank Corporation: at 706 Walnut Street, branch established on 2000/02/16. Info updated 2009/08/12: Bank assets: $148.7 mil, Deposits: $123.6 mil, local headquarters , positive income , Commercial Lending Specialization, 3 total offices , Holding Company: Charter Bankshares, Inc.
Bank of the West: Chaska Branch at 1435 White Oak Drive, branch established on 2005/06/06. Info updated 2009/11/16: Bank assets: $62,408.3 mil, Deposits: $43,995.2 mil, headquarters in San Francisco, CA, positive income , 647 total offices , Holding Company: Bnp Paribas
Security Bank Waconia: Chaska Branch at 1575 White Oak Drive, branch established on 1992/04/01. Info updated 2006/11/03: Bank assets: $170.8 mil, Deposits: $154.8 mil, headquarters in Waconia, MN, positive income , Commercial Lending Specialization, 6 total offices , Holding Company: Security Bancshares Co.
For population 15 years and over in Chaska:
Never married: 30.8%Now married: 51.3%Separated: 0.4%Widowed: 4.4%Divorced: 13.0% For population 25 years and over in Chaska:
High school or higher: 92.5%Bachelor's degree or higher: 44.8%Graduate or professional degree: 14.7%Unemployed: 4.1%Mean travel time to work (commute): 19.2 minutes
Education Gini index (Inequality in education) Here:
10.8Minnesota average:
10.9
Religion statistics for Chaska, MN (based on Carver County data)
Religion Adherents Congregations Catholic 14,887 8 Evangelical Protestant 13,244 30 Mainline Protestant 9,289 16 Other 1,119 6 None 52,503 -
Source: Clifford Grammich, Kirk Hadaway, Richard Houseal, Dale E.Jones, Alexei Krindatch, Richie Stanley and Richard H.Taylor. 2012. 2010 U.S.Religion Census: Religious Congregations & Membership Study. Association of Statisticians of American Religious Bodies. Jones, Dale E., et al. 2002. Congregations and Membership in the United States 2000. Nashville, TN: Glenmary Research Center. Graphs represent county-level data
Food Environment Statistics: Number of grocery stores : 7Carver County :
0.79 / 10,000 pop.State :
1.83 / 10,000 pop.
Number of supercenters and club stores : 1Carver County :
0.11 / 10,000 pop.Minnesota :
0.13 / 10,000 pop.
Number of convenience stores (no gas) : 3Carver County :
0.34 / 10,000 pop.Minnesota :
0.49 / 10,000 pop.
Number of convenience stores (with gas) : 25This county :
2.84 / 10,000 pop.Minnesota :
3.90 / 10,000 pop.
Number of full-service restaurants : 43This county :
4.88 / 10,000 pop.Minnesota :
6.98 / 10,000 pop.
Adult obesity rate : Carver County :
27.9%State :
25.9%
Low-income preschool obesity rate : Carver County :
8.8%Minnesota :
13.0%
Health and Nutrition:
Average overall health of teeth and gums : Chaska:
45.3%Minnesota:
48.4%
People feeling badly about themselves : Here:
22.3%Minnesota:
21.0%
People not drinking alcohol at all : Chaska:
8.9%Minnesota:
9.8%
Average hours sleeping at night : Overweight people : Chaska:
33.5%Minnesota:
33.5%
General health condition : Average condition of hearing : More about Health and Nutrition of Chaska, MN Residents
Local government employment and payroll (March 2022)
Function
Full-time employees
Monthly full-time payroll
Average yearly full-time wage
Part-time employees
Monthly part-time payroll
Parks and Recreation
39 $259,443 $79,829 126 $74,342 Police Protection - Officers
26 $254,568 $117,493 0 $0 Electric Power
18 $132,926 $88,617 0 $0 Other and Unallocable
16 $118,794 $89,096 2 $898 Financial Administration
15 $114,837 $91,870 0 $0 Streets and Highways
13 $101,676 $93,855 0 $0 Other Government Administration
10 $89,178 $107,014 6 $3,262 Water Supply
9 $67,434 $89,912 0 $0 Firefighters
5 $53,683 $128,839 40 $48,670 Police - Other
4 $32,889 $98,667 3 $3,682
Totals for Government
155 $1,225,428 $94,872 177 $130,855
Chaska government finances - Expenditure in 2021 (per resident):
Construction - General Public Buildings: $8,752,000 ($309.67)
Current Operations - Electric Utilities: $35,390,000 ($1252.21)
Parks and Recreation: $8,383,000 ($296.62)Regular Highways: $6,443,000 ($227.97)Police Protection: $4,839,000 ($171.22)Central Staff Services: $4,378,000 ($154.91)Sewerage: $4,300,000 ($152.15)Water Utilities: $2,372,000 ($83.93)Local Fire Protection: $2,182,000 ($77.21)Financial Administration: $1,671,000 ($59.13)General - Other: $1,355,000 ($47.94)Protective Inspection and Regulation - Other: $681,000 ($24.10)Housing and Community Development: $325,000 ($11.50)Miscellaneous Commercial Activities - Other: $106,000 ($3.75)Electric Utilities - Interest on Debt: $389,000 ($13.76)
General - Interest on Debt: $3,931,000 ($139.09)
Other Capital Outlay - General Public Building: $3,830,000 ($135.52)
Police Protection: $191,000 ($6.76)Central Staff Services: $87,000 ($3.08)Total Salaries and Wages: $22,088,000 ($781.54)
Water Utilities - Interest on Debt: $487,000 ($17.23)
Chaska government finances - Revenue in 2021 (per resident):
Charges - Other: $8,123,000 ($287.42)
Sewerage: $6,368,000 ($225.32)Parks and Recreation: $5,213,000 ($184.45)Federal Intergovernmental - Other: $1,000 ($0.04)
Local Intergovernmental - Highways: $5,970,000 ($211.24)
General Local Government Support: $40,000 ($1.42)Other: $27,000 ($0.96)Miscellaneous - General Revenue - Other: $2,665,000 ($94.30)
Special Assessments: $1,970,000 ($69.70)Interest Earnings: $324,000 ($11.46)Fines and Forfeits: $56,000 ($1.98)Revenue - Electric Utilities: $43,028,000 ($1522.47)
Water Utilities: $3,372,000 ($119.31)State Intergovernmental - Other: $2,931,000 ($103.71)
Highways: $1,288,000 ($45.57)General Local Government Support: $40,000 ($1.42)Tax - Property: $11,739,000 ($415.36)
Other License: $884,000 ($31.28)Public Utilities Sales: $763,000 ($27.00)Alcoholic Beverage License: $59,000 ($2.09)
Chaska government finances - Debt in 2021 (per resident):
Long Term Debt - Outstanding Nonguaranteed - Industrial Revenue: $77,764,000 ($2751.54)
Outstanding Unspecified Public Purpose: $77,124,000 ($2728.89)Beginning Outstanding - Unspecified Public Purpose: $69,833,000 ($2470.92)Beginning Outstanding - Public Debt for Private Purpose: $69,478,000 ($2458.35)Issue, Unspecified Public Purpose: $17,995,000 ($636.72)Issue, Nonguaranteed - Public Debt for Private Purpose: $16,232,000 ($574.34)Retired Unspecified Public Purpose: $10,704,000 ($378.74)Retired Nonguaranteed - Public Debt for Private Purpose: $7,946,000 ($281.15)
Chaska government finances - Cash and Securities in 2021 (per resident):
Other Funds - Cash and Securities: $55,063,000 ($1948.31)
Sinking Funds - Cash and Securities: $77,764,000 ($2751.54)
Businesses in Chaska, MN
Name Count Name Count
Ace Hardware 1 Nike 2 Arby's 1 Papa John's Pizza 1 Best Western 1 Penske 1 Caribou Coffee 2 Qdoba Mexican Grill 1 Chevrolet 1 Quiznos 1 Curves 1 Ruby Tuesday 1 Dairy Queen 1 Sprint Nextel 1 Domino's Pizza 1 Starbucks 1 FedEx 5 Subway 2 GNC 1 Super 8 1 H&R Block 1 Target 1 Home Depot 1 U-Haul 1 KFC 1 UPS 5 Kohl's 1 Walgreens 1 McDonald's 1
Strongest AM radio stations in Chaska:
KSMM (1530 AM; 9 kW; SHAKOPEE, MN; Owner: STARBOARD BROADCASTING, INC.)
KFAN (1130 AM; 50 kW; MINNEAPOLIS, MN; Owner: AMFM RADIO LICENSES, L.L.C.)
WCCO (830 AM; 50 kW; MINNEAPOLIS, MN; Owner: INFINITY MEDIA CORPORATION)
WMNN (1330 AM; 10 kW; MINNEAPOLIS, MN; Owner: MINNESOTA PUBLIC RADIO.)
WCTS (1030 AM; 50 kW; MAPLEWOOD, MN; Owner: CNTL. BAPT. THEO/AL SEMI MINNEAPOLIS)
KSTP (1500 AM; 50 kW; ST. PAUL, MN; Owner: KSTP-AM, LLC (DELAWARE))
KTIS (900 AM; 25 kW; MINNEAPOLIS, MN; Owner: NORTHWESTERN COLLEGE)
KWOM (1600 AM; 5 kW; WATERTOWN, MN; Owner: WATERTOWN RADIO, INC.)
WWTC (1280 AM; 5 kW; MINNEAPOLIS, MN; Owner: SCA LICENSE CORPORATION)
KKMS (980 AM; 5 kW; RICHFIELD, MN)
KDIZ (1440 AM; 5 kW; GOLDEN VALLEY, MN; Owner: KQRS, INC.)
KCCO (950 AM; 1 kW; ST. LOUIS PARK, MN; Owner: THE AUDIO HOUSE, INC.)
KUOM (770 AM; daytime; 5 kW; MINNEAPOLIS, MN)
Strongest FM radio stations in Chaska:
KTCZ-FM (97.1 FM; MINNEAPOLIS, MN; Owner: AMFM RADIO LICENSES, L.L.C.)
KNOW-FM (91.1 FM; MINNEAPOLIS-ST. PAUL, MN; Owner: MINNESOTA PUBLIC RADIO)
WLTE (102.9 FM; MINNEAPOLIS, MN; Owner: INFINITY MEDIA CORPORATION)
KSTP-FM (94.5 FM; ST. PAUL, MN; Owner: KSTP-FM, LLC, A DELAWARE LLC)
WGVZ (105.7 FM; EDEN PRAIRIE, MN; Owner: KQRS, INC.)
KQQL (107.9 FM; ANOKA, MN; Owner: AMFM RADIO LICENSES, L.L.C.)
KEEY-FM (102.1 FM; ST. PAUL, MN; Owner: AMFM RADIO LICENSES, L.L.C.)
KTIS-FM (98.5 FM; MINNEAPOLIS, MN; Owner: NORTHWESTERN COLLEGE)
KTTB (96.3 FM; GLENCOE, MN; Owner: BLUE CHIP BROADCASTING LICENSES II, LTD.)
KDWB-FM (101.3 FM; RICHFIELD, MN; Owner: AMFM RADIO LICENSES, L.L.C.)
KQRS-FM (92.5 FM; GOLDEN VALLEY, MN; Owner: KQRS, Inc.)
KSJN (99.5 FM; MINNEAPOLIS, MN; Owner: MINNESOTA PUBLIC RADIO)
KXXR (93.7 FM; MINNEAPOLIS, MN; Owner: KQRS, INC.)
K214DF (90.7 FM; GOLDEN VALLEY, MN; Owner: EDUCATIONAL MEDIA FOUNDATION)
WCAL (89.3 FM; NORTHFIELD, MN; Owner: ST. OLAF COLLEGE)
KFAI (90.3 FM; MINNEAPOLIS, MN; Owner: FRESH AIR, INC.)
KJZI (100.3 FM; MINNEAPOLIS, MN; Owner: AMFM RADIO LICENSES, L.L.C.)
WGVX (105.1 FM; LAKEVILLE, MN; Owner: KQRS, INC.)
KBEM-FM (88.5 FM; MINNEAPOLIS, MN; Owner: BD. OF EDUCATION, S.S.D. NO. 1)
KNOF (95.3 FM; ST. PAUL, MN; Owner: SELBY GOSPEL BROADCASTING CORPORATION)
TV broadcast stations around Chaska:
KMSP-TV (Channel 9; MINNEAPOLIS, MN; Owner: FOX TELEVISION STATIONS, INC.)
KARE (Channel 11; MINNEAPOLIS, MN; Owner: MULTIMEDIA HOLDINGS CORPORATION)
KSTP-TV (Channel 5; ST. PAUL, MN; Owner: HUBBARD BROADCASTING, INC.)
KTCA-TV (Channel 2; ST. PAUL, MN; Owner: TWIN CITIES PUBLIC TELEVISION, INC.)
K07UI (Channel 7; MINNEAPOLIS, ETC., MN; Owner: WORD OF GOD FELLOWSHIP, INC.)
WCCO-TV (Channel 4; MINNEAPOLIS, MN; Owner: CBS BROADCASTING INC.)
K58BS (Channel 58; MINNEAPOLIS, MN; Owner: TRINITY BROADCASTING NETWORK)
K67HG (Channel 67; MINNEAPOLIS, MN; Owner: VENTANA TELEVISION, INC.)
K14KH (Channel 14; MINNEAPOLIS, MN; Owner: THREE ANGELS BROADCASTING NETWORK)
K19ER (Channel 19; ST. PAUL, MN; Owner: CATHOLIC VIEWS BROADCASTS, INC.)
KSTC-TV (Channel 45; MINNEAPOLIS, MN; Owner: HUBBARD BROADCASTING, INC.)
W62BD (Channel 62; MINNEAPOLIS, MN; Owner: WORD OF GOD FELLOWSHIP, INC.)
KTCI-TV (Channel 17; ST. PAUL, MN; Owner: TWIN CITIES PUBLIC TELEVISION, INC.)
KMWB (Channel 23; MINNEAPOLIS, MN; Owner: KLGT LICENSEE, LLC)
WFTC (Channel 29; MINNEAPOLIS, MN; Owner: FOX TELEVISION STATIONS, INC.)
WBWX-CA (Channel 13; MINNEAPOLIS, MN; Owner: THE BOX WORLDWIDE LLC)
KPXM (Channel 41; ST. CLOUD, MN; Owner: PAXSON MINNEAPOLIS LICENSE, INC.)
National Bridge Inventory (NBI) Statistics 52 Number of bridges597ft / 182m Total length $407,003,000 Total costs621,927 Total average daily traffic43,135 Total average daily truck traffic
New bridges - historical statistics
1 1910-1919 3 1930-1939 1 1960-1969 1 1970-1979 2 1980-1989 6 1990-1999 29 2000-2009 3 2010-2019 6 2020-2022
See full National Bridge Inventory statistics for Chaska, MN
Home Mortgage Disclosure Act Aggregated Statistics For Year 2009(Based on 2 full and 1 partial tracts) A) FHA, FSA/RHS & VA B) Conventional C) Refinancings D) Home Improvement Loans E) Loans on Dwellings For 5+ Families F) Non-occupant Loans on G) Loans On Manufactured Number Average Value Number Average Value Number Average Value Number Average Value Number Average Value Number Average Value Number Average Value
LOANS ORIGINATED 104 $182,387 108 $194,255 605 $229,919 19 $127,117 1 $848,400 13 $104,952 8 $32,226 APPLICATIONS APPROVED, NOT ACCEPTED 8 $193,512 12 $257,618 51 $263,933 4 $131,805 0 $0 1 $50,000 2 $36,485 APPLICATIONS DENIED 9 $150,523 17 $98,151 153 $241,267 16 $60,025 0 $0 7 $137,326 11 $32,716 APPLICATIONS WITHDRAWN 6 $194,300 11 $155,709 137 $228,305 11 $126,171 0 $0 7 $102,997 0 $0 FILES CLOSED FOR INCOMPLETENESS 2 $136,350 2 $53,495 38 $251,253 1 $29,990 0 $0 1 $77,750 3 $45,660
Aggregated Statistics For Year 2008(Based on 2 full and 1 partial tracts) A) FHA, FSA/RHS & VA B) Conventional C) Refinancings D) Home Improvement Loans E) Loans on Dwellings For 5+ Families F) Non-occupant Loans on G) Loans On Manufactured Number Average Value Number Average Value Number Average Value Number Average Value Number Average Value Number Average Value Number Average Value
LOANS ORIGINATED 84 $191,541 182 $232,368 242 $212,155 20 $76,757 1 $91,470 15 $173,504 11 $31,586 APPLICATIONS APPROVED, NOT ACCEPTED 5 $198,600 19 $191,553 45 $190,281 5 $49,240 0 $0 5 $165,162 10 $44,745 APPLICATIONS DENIED 10 $220,804 19 $175,797 143 $216,008 21 $70,077 0 $0 8 $163,994 7 $40,706 APPLICATIONS WITHDRAWN 6 $220,657 20 $202,543 63 $236,523 9 $108,063 0 $0 7 $153,131 1 $22,990 FILES CLOSED FOR INCOMPLETENESS 0 $0 6 $247,607 16 $238,871 3 $48,293 0 $0 2 $122,300 1 $78,970
Aggregated Statistics For Year 2007(Based on 2 full and 1 partial tracts) A) FHA, FSA/RHS & VA B) Conventional C) Refinancings D) Home Improvement Loans E) Loans on Dwellings For 5+ Families F) Non-occupant Loans on G) Loans On Manufactured Number Average Value Number Average Value Number Average Value Number Average Value Number Average Value Number Average Value Number Average Value
LOANS ORIGINATED 12 $168,724 288 $193,455 285 $194,367 37 $96,015 1 $1,343,490 34 $149,962 11 $48,619 APPLICATIONS APPROVED, NOT ACCEPTED 0 $0 27 $154,706 54 $199,338 12 $73,542 0 $0 0 $0 3 $44,700 APPLICATIONS DENIED 2 $121,485 44 $192,498 215 $217,134 20 $116,080 0 $0 12 $319,922 16 $31,153 APPLICATIONS WITHDRAWN 2 $145,030 32 $139,961 97 $217,968 3 $120,040 0 $0 7 $128,911 4 $50,730 FILES CLOSED FOR INCOMPLETENESS 0 $0 5 $258,932 16 $200,998 0 $0 0 $0 2 $384,030 0 $0
Aggregated Statistics For Year 2006(Based on 2 full and 1 partial tracts) A) FHA, FSA/RHS & VA B) Conventional C) Refinancings D) Home Improvement Loans E) Loans on Dwellings For 5+ Families F) Non-occupant Loans on G) Loans On Manufactured Number Average Value Number Average Value Number Average Value Number Average Value Number Average Value Number Average Value Number Average Value
LOANS ORIGINATED 20 $198,030 493 $174,073 397 $196,529 51 $53,314 1 $5,167,020 77 $150,771 5 $28,992 APPLICATIONS APPROVED, NOT ACCEPTED 0 $0 57 $174,457 67 $184,262 9 $66,427 0 $0 13 $172,394 3 $35,043 APPLICATIONS DENIED 1 $95,470 110 $164,417 217 $211,673 23 $54,732 0 $0 19 $218,062 23 $29,570 APPLICATIONS WITHDRAWN 3 $147,773 67 $136,960 126 $211,598 9 $57,349 0 $0 15 $122,243 0 $0 FILES CLOSED FOR INCOMPLETENESS 0 $0 20 $226,258 46 $238,775 0 $0 0 $0 2 $227,950 0 $0
Aggregated Statistics For Year 2005(Based on 2 full and 1 partial tracts) A) FHA, FSA/RHS & VA B) Conventional C) Refinancings D) Home Improvement Loans E) Loans on Dwellings For 5+ Families F) Non-occupant Loans on G) Loans On Manufactured Number Average Value Number Average Value Number Average Value Number Average Value Number Average Value Number Average Value Number Average Value
LOANS ORIGINATED 27 $191,164 580 $193,584 504 $202,955 55 $60,794 5 $99,920 68 $164,252 12 $34,237 APPLICATIONS APPROVED, NOT ACCEPTED 1 $127,490 67 $179,503 77 $212,428 13 $50,988 0 $0 4 $139,092 14 $41,498 APPLICATIONS DENIED 2 $168,650 97 $121,099 204 $186,386 23 $79,039 0 $0 15 $202,188 26 $37,922 APPLICATIONS WITHDRAWN 4 $233,605 70 $176,019 168 $224,851 13 $139,091 0 $0 11 $155,194 5 $38,384 FILES CLOSED FOR INCOMPLETENESS 1 $240,110 9 $160,460 69 $224,920 2 $49,215 0 $0 2 $82,895 0 $0
Aggregated Statistics For Year 2004(Based on 2 full and 1 partial tracts) A) FHA, FSA/RHS & VA B) Conventional C) Refinancings D) Home Improvement Loans F) Non-occupant Loans on G) Loans On Manufactured Number Average Value Number Average Value Number Average Value Number Average Value Number Average Value Number Average Value
LOANS ORIGINATED 47 $179,528 640 $196,154 601 $201,816 62 $77,040 39 $165,114 15 $64,279 APPLICATIONS APPROVED, NOT ACCEPTED 5 $199,906 49 $171,657 98 $188,972 7 $56,426 4 $191,978 15 $33,800 APPLICATIONS DENIED 4 $167,835 67 $160,258 175 $201,799 41 $45,759 7 $163,717 26 $40,881 APPLICATIONS WITHDRAWN 7 $205,690 62 $215,365 136 $191,742 11 $106,556 7 $183,420 1 $35,000 FILES CLOSED FOR INCOMPLETENESS 0 $0 15 $166,036 74 $192,320 4 $97,128 2 $145,785 0 $0
Aggregated Statistics For Year 2003(Based on 2 full and 1 partial tracts) A) FHA, FSA/RHS & VA B) Conventional C) Refinancings D) Home Improvement Loans E) Loans on Dwellings For 5+ Families F) Non-occupant Loans on Number Average Value Number Average Value Number Average Value Number Average Value Number Average Value Number Average Value
LOANS ORIGINATED 77 $174,261 587 $194,726 1,553 $185,378 46 $36,516 1 $1,300,000 37 $147,522 APPLICATIONS APPROVED, NOT ACCEPTED 3 $138,307 62 $177,835 124 $175,334 11 $29,945 0 $0 7 $177,583 APPLICATIONS DENIED 6 $174,680 64 $130,459 227 $164,918 19 $49,004 0 $0 5 $85,160 APPLICATIONS WITHDRAWN 5 $181,082 68 $204,988 161 $190,976 4 $35,455 0 $0 5 $165,744 FILES CLOSED FOR INCOMPLETENESS 1 $209,000 16 $188,643 53 $216,608 2 $48,500 0 $0 1 $140,000
Aggregated Statistics For Year 2002(Based on 2 full and 1 partial tracts) A) FHA, FSA/RHS & VA B) Conventional C) Refinancings D) Home Improvement Loans E) Loans on Dwellings For 5+ Families F) Non-occupant Loans on Number Average Value Number Average Value Number Average Value Number Average Value Number Average Value Number Average Value
LOANS ORIGINATED 104 $159,791 543 $180,725 1,052 $181,087 62 $29,941 2 $1,114,390 27 $125,388 APPLICATIONS APPROVED, NOT ACCEPTED 6 $144,167 66 $137,892 131 $157,376 17 $40,146 1 $264,890 4 $123,250 APPLICATIONS DENIED 7 $133,276 67 $78,252 163 $137,846 25 $34,958 0 $0 5 $68,150 APPLICATIONS WITHDRAWN 5 $188,576 35 $212,601 134 $157,498 13 $52,290 0 $0 3 $147,667 FILES CLOSED FOR INCOMPLETENESS 1 $119,000 11 $156,082 80 $169,994 0 $0 0 $0 2 $213,955
Aggregated Statistics For Year 2001(Based on 2 full and 1 partial tracts) A) FHA, FSA/RHS & VA B) Conventional C) Refinancings D) Home Improvement Loans F) Non-occupant Loans on Number Average Value Number Average Value Number Average Value Number Average Value Number Average Value
LOANS ORIGINATED 84 $150,225 413 $164,399 789 $153,640 61 $27,776 19 $134,871 APPLICATIONS APPROVED, NOT ACCEPTED 5 $128,596 47 $112,307 73 $146,209 16 $30,423 3 $193,960 APPLICATIONS DENIED 5 $151,638 83 $64,715 165 $116,251 22 $29,448 4 $128,610 APPLICATIONS WITHDRAWN 10 $135,622 29 $197,797 114 $168,910 3 $15,910 2 $283,345 FILES CLOSED FOR INCOMPLETENESS 0 $0 4 $189,735 30 $146,378 2 $47,785 0 $0
Aggregated Statistics For Year 2000(Based on 2 full and 1 partial tracts) A) FHA, FSA/RHS & VA B) Conventional C) Refinancings D) Home Improvement Loans E) Loans on Dwellings For 5+ Families F) Non-occupant Loans on Number Average Value Number Average Value Number Average Value Number Average Value Number Average Value Number Average Value
LOANS ORIGINATED 39 $123,182 425 $148,662 164 $102,878 75 $24,849 3 $2,734,990 9 $83,690 APPLICATIONS APPROVED, NOT ACCEPTED 0 $0 38 $119,947 40 $88,176 16 $25,435 0 $0 3 $38,337 APPLICATIONS DENIED 4 $160,770 111 $64,592 77 $85,340 26 $28,182 1 $50,000 3 $99,630 APPLICATIONS WITHDRAWN 0 $0 24 $165,891 57 $117,622 6 $55,393 0 $0 1 $84,040 FILES CLOSED FOR INCOMPLETENESS 1 $147,000 8 $195,194 22 $141,237 2 $22,490 0 $0 0 $0
Aggregated Statistics For Year 1999(Based on 2 full and 1 partial tracts) A) FHA, FSA/RHS & VA B) Conventional C) Refinancings D) Home Improvement Loans E) Loans on Dwellings For 5+ Families F) Non-occupant Loans on Number Average Value Number Average Value Number Average Value Number Average Value Number Average Value Number Average Value
LOANS ORIGINATED 50 $130,453 360 $142,922 304 $108,602 60 $23,054 3 $634,743 7 $92,436 APPLICATIONS APPROVED, NOT ACCEPTED 2 $108,450 49 $104,783 44 $96,995 13 $20,575 0 $0 2 $34,655 APPLICATIONS DENIED 3 $117,717 89 $62,308 143 $90,347 23 $34,357 0 $0 2 $31,330 APPLICATIONS WITHDRAWN 4 $98,862 22 $181,819 72 $117,343 12 $56,141 0 $0 2 $115,580 FILES CLOSED FOR INCOMPLETENESS 0 $0 5 $168,034 26 $106,130 2 $7,285 0 $0 1 $28,760
Detailed HMDA statistics for the following Tracts:
0908.00
, 0909.00 , 0910.00
Private Mortgage Insurance Companies Aggregated Statistics For Year 2009(Based on 2 full and 1 partial tracts) A) Conventional B) Refinancings Number Average Value Number Average Value
LOANS ORIGINATED 17 $267,177 18 $285,961 APPLICATIONS APPROVED, NOT ACCEPTED 5 $201,844 4 $331,408 APPLICATIONS DENIED 1 $294,000 5 $368,878 APPLICATIONS WITHDRAWN 0 $0 4 $282,240 FILES CLOSED FOR INCOMPLETENESS 1 $78,890 1 $185,930
Aggregated Statistics For Year 2008(Based on 2 full and 1 partial tracts) A) Conventional B) Refinancings C) Non-occupant Loans on Number Average Value Number Average Value Number Average Value
LOANS ORIGINATED 55 $246,950 25 $221,616 5 $152,076 APPLICATIONS APPROVED, NOT ACCEPTED 17 $257,978 12 $267,422 2 $143,455 APPLICATIONS DENIED 2 $286,410 4 $166,150 0 $0 APPLICATIONS WITHDRAWN 4 $205,822 1 $216,000 0 $0 FILES CLOSED FOR INCOMPLETENESS 2 $239,820 2 $267,100 1 $129,780
Aggregated Statistics For Year 2007(Based on 2 full and 1 partial tracts) A) Conventional B) Refinancings C) Non-occupant Loans on Number Average Value Number Average Value Number Average Value
LOANS ORIGINATED 99 $203,065 18 $230,572 6 $209,310 APPLICATIONS APPROVED, NOT ACCEPTED 9 $178,329 13 $257,547 1 $54,000 APPLICATIONS DENIED 2 $389,000 2 $250,235 0 $0 APPLICATIONS WITHDRAWN 6 $272,722 2 $272,070 0 $0 FILES CLOSED FOR INCOMPLETENESS 0 $0 0 $0 0 $0
Aggregated Statistics For Year 2006(Based on 2 full and 1 partial tracts) A) Conventional B) Refinancings C) Non-occupant Loans on Number Average Value Number Average Value Number Average Value
LOANS ORIGINATED 48 $211,339 12 $238,528 2 $188,190 APPLICATIONS APPROVED, NOT ACCEPTED 4 $175,725 2 $210,400 0 $0 APPLICATIONS DENIED 0 $0 0 $0 0 $0 APPLICATIONS WITHDRAWN 2 $237,955 1 $259,900 0 $0 FILES CLOSED FOR INCOMPLETENESS 0 $0 0 $0 0 $0
Aggregated Statistics For Year 2005(Based on 2 full and 1 partial tracts) A) Conventional B) Refinancings C) Non-occupant Loans on Number Average Value Number Average Value Number Average Value
LOANS ORIGINATED 60 $229,335 17 $222,081 5 $165,024 APPLICATIONS APPROVED, NOT ACCEPTED 6 $206,595 6 $256,347 1 $127,000 APPLICATIONS DENIED 0 $0 1 $80,040 0 $0 APPLICATIONS WITHDRAWN 2 $282,425 1 $110,910 0 $0 FILES CLOSED FOR INCOMPLETENESS 0 $0 1 $146,930 0 $0
Aggregated Statistics For Year 2004(Based on 2 full and 1 partial tracts) A) Conventional B) Refinancings C) Non-occupant Loans on D) Loans On Manufactured Number Average Value Number Average Value Number Average Value Number Average Value
LOANS ORIGINATED 91 $214,758 30 $218,538 4 $188,718 1 $158,000 APPLICATIONS APPROVED, NOT ACCEPTED 16 $239,346 8 $215,204 1 $117,200 0 $0 APPLICATIONS DENIED 3 $309,667 0 $0 0 $0 0 $0 APPLICATIONS WITHDRAWN 5 $219,844 3 $128,853 1 $166,360 0 $0 FILES CLOSED FOR INCOMPLETENESS 0 $0 0 $0 0 $0 0 $0
Aggregated Statistics For Year 2003(Based on 2 full and 1 partial tracts) A) Conventional B) Refinancings C) Non-occupant Loans on Number Average Value Number Average Value Number Average Value
LOANS ORIGINATED 131 $197,314 107 $188,622 4 $195,445 APPLICATIONS APPROVED, NOT ACCEPTED 16 $188,744 23 $196,247 0 $0 APPLICATIONS DENIED 1 $110,000 2 $194,090 1 $102,910 APPLICATIONS WITHDRAWN 5 $181,292 3 $136,667 1 $110,000 FILES CLOSED FOR INCOMPLETENESS 1 $155,000 1 $76,040 0 $0
Aggregated Statistics For Year 2002(Based on 2 full and 1 partial tracts) A) Conventional B) Refinancings C) Non-occupant Loans on Number Average Value Number Average Value Number Average Value
LOANS ORIGINATED 142 $189,140 71 $190,654 6 $170,755 APPLICATIONS APPROVED, NOT ACCEPTED 16 $174,720 11 $166,832 0 $0 APPLICATIONS DENIED 1 $207,000 2 $335,000 1 $207,000 APPLICATIONS WITHDRAWN 4 $196,488 7 $199,857 0 $0 FILES CLOSED FOR INCOMPLETENESS 2 $158,090 1 $112,620 0 $0
Aggregated Statistics For Year 2001(Based on 2 full and 1 partial tracts) A) Conventional B) Refinancings C) Non-occupant Loans on Number Average Value Number Average Value Number Average Value
LOANS ORIGINATED 88 $173,956 70 $175,244 3 $162,460 APPLICATIONS APPROVED, NOT ACCEPTED 11 $194,188 22 $182,815 3 $225,243 APPLICATIONS DENIED 0 $0 2 $126,845 0 $0 APPLICATIONS WITHDRAWN 1 $79,000 3 $203,277 1 $79,000 FILES CLOSED FOR INCOMPLETENESS 1 $162,000 1 $187,920 0 $0
Aggregated Statistics For Year 2000(Based on 2 full and 1 partial tracts) A) Conventional B) Refinancings C) Non-occupant Loans on Number Average Value Number Average Value Number Average Value
LOANS ORIGINATED 103 $166,490 22 $154,301 1 $56,600 APPLICATIONS APPROVED, NOT ACCEPTED 14 $159,210 4 $109,952 1 $56,600 APPLICATIONS DENIED 3 $169,597 2 $214,165 0 $0 APPLICATIONS WITHDRAWN 0 $0 0 $0 0 $0 FILES CLOSED FOR INCOMPLETENESS 1 $115,000 0 $0 0 $0
Aggregated Statistics For Year 1999(Based on 2 full and 1 partial tracts) A) Conventional B) Refinancings C) Non-occupant Loans on Number Average Value Number Average Value Number Average Value
LOANS ORIGINATED 116 $161,627 41 $128,945 2 $62,980 APPLICATIONS APPROVED, NOT ACCEPTED 10 $156,262 10 $142,110 2 $115,050 APPLICATIONS DENIED 3 $170,900 5 $96,994 0 $0 APPLICATIONS WITHDRAWN 5 $151,592 1 $188,120 0 $0 FILES CLOSED FOR INCOMPLETENESS 1 $82,250 1 $75,350 0 $0
Detailed PMIC statistics for the following Tracts:
0908.00
, 0909.00 , 0910.00 Fire-safe hotels and motels in Chaska, Minnesota:
Super 8 Motel Chaska, 830 Yellow Brick Rd, Chaska, Minnesota 55318 Phone: (952) 448-7030
Best Western Chaska River Inn, 101 W First St, Chaska, Minnesota 55318 Phone: (952) 448-7877, Fax: (952) 448-7290
Best Western Chaska River Inn & Suites, 1 Riv Bend Pl, Chaska, Minnesota 55318 Phone: (952) 448-7877, Fax: (952) 448-7290
Oak Ridge Hotel & Conference Center, 1 Oak Ridge Dr, Chaska, Minnesota 55318 Phone: (952) 368-3100
All 4 fire-safe hotels and motels in Chaska, Minnesota
Most common first names in Chaska, MN among deceased individuals Name Count Lived (average)
John 52 76.9 years Mary 40 80.0 years Robert 37 70.1 years William 36 76.1 years Helen 30 82.2 years Dorothy 29 81.6 years Margaret 25 78.2 years Donald 23 72.1 years Richard 21 68.0 years George 21 75.0 years
Most common last names in Chaska, MN among deceased individuals Last name Count Lived (average)
Johnson 28 79.3 years Anderson 16 77.6 years Nelson 14 76.4 years Gastler 13 78.6 years Schmidt 13 81.3 years Schindler 12 77.8 years Lano 11 72.0 years Olson 11 78.9 years Carlson 10 73.9 years Poppitz 10 75.6 years
Chaska compared to Minnesota state average:
Unemployed percentage significantly below state average. Black race population percentage below state average. Hispanic race population percentage above state average. Median age significantly below state average. Length of stay since moving in significantly above state average. House age significantly below state average. Percentage of population with a bachelor's degree or higher above state average.
#21 on the list of "Top 101 cities with the most local government spending on highway construction per resident (population 10,000+)"
#11 on the list of "Top 101 counties with the largest increase in the number of deaths per 1000 residents 2000-2006 to 2007-2013 (pop. 50,000+)"
#45 on the list of "Top 101 counties with the lowest percentage of residents relocating to foreign countries in 2011 (pop. 50,000+)"
#66 on the list of "Top 101 counties with the lowest number of deaths per 1000 residents 2007-2013"
#66 on the list of "Top 101 counties with the largest number of children under 18 without health insurance coverage in 2000"
#81 on the list of "Top 101 counties with the largest number of people without health insurance coverage in 2000 (pop. 50,000+)"
Top Patent Applicants
Scott R. Smith (30)
Thomas C. Tinucci (20)
James B. Stasson (19)
Scott Smith (18)
Thomas J. Gisel (17)
Kevin B. Moore (16)
Anthony J. Hanson (16)
Brian D. Wilson (14)
Debra Lea Enfield (14)
Alan N. Johnson (13)
Total of 729 patent applications in 2008-2024.


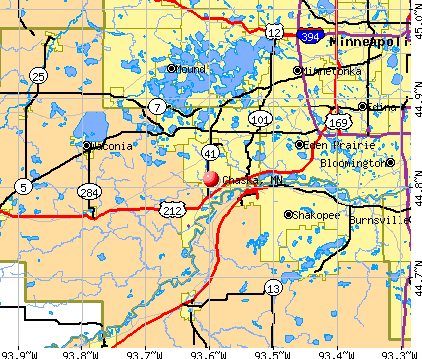


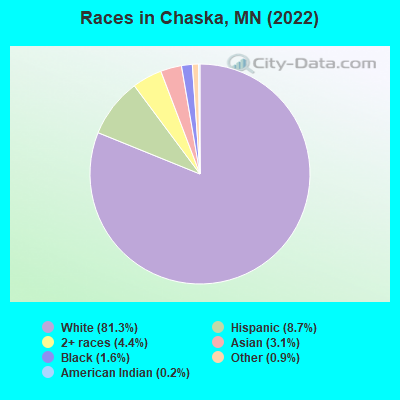
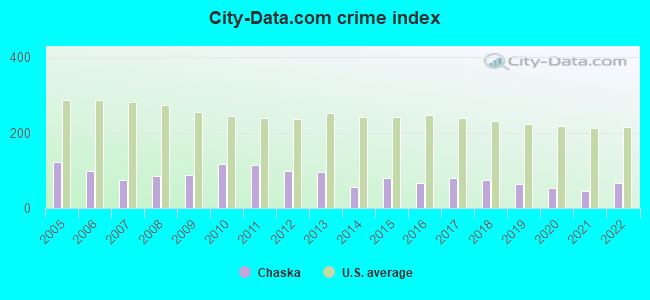
 Recent articles from our blog. Our writers, many of them Ph.D. graduates or candidates, create easy-to-read articles on a wide variety of topics.

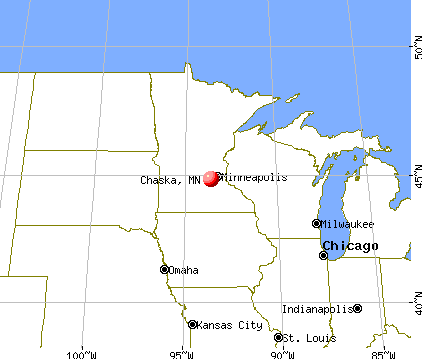
 (7.4 miles
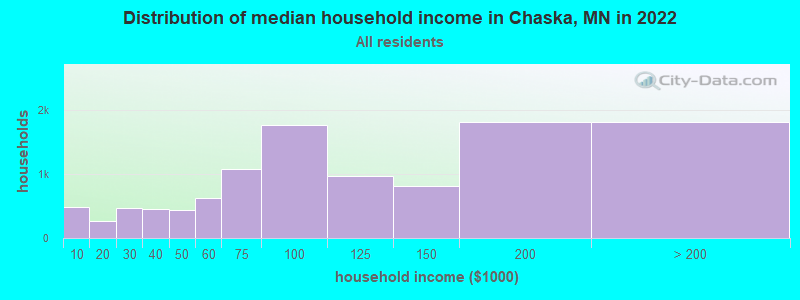
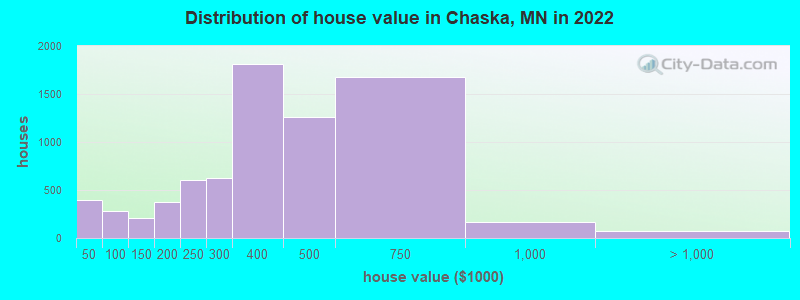
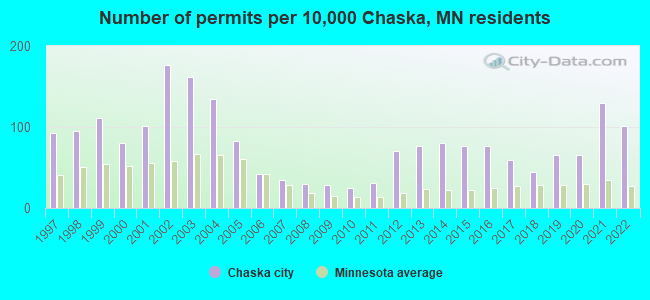
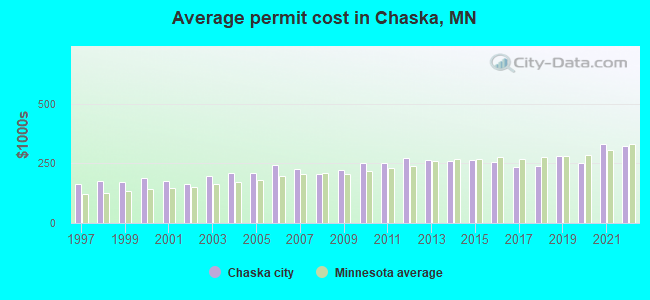
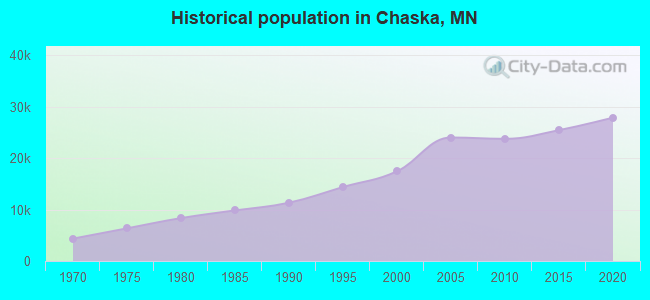
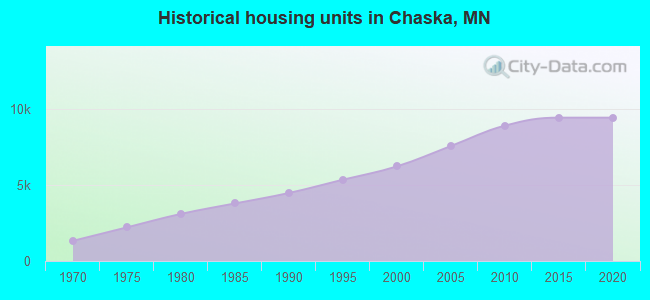
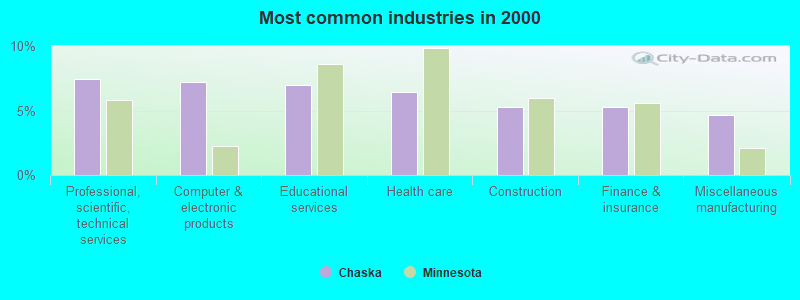
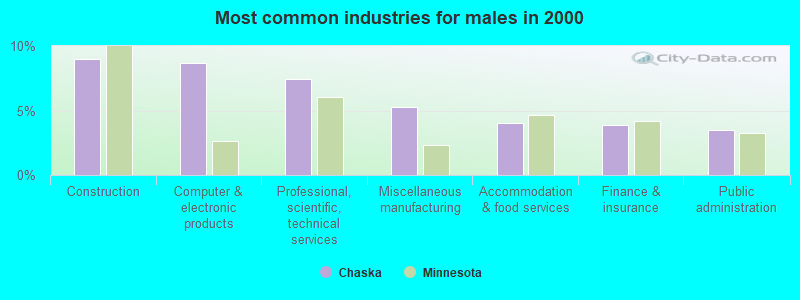
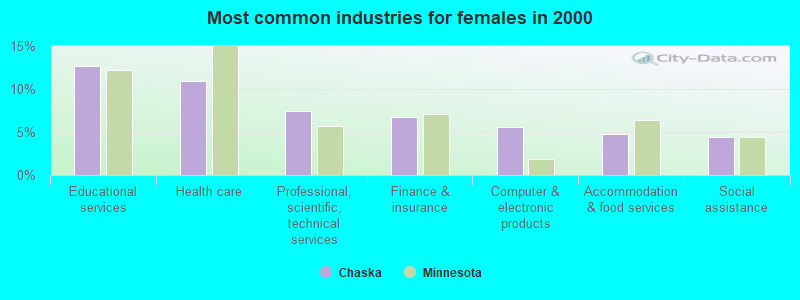
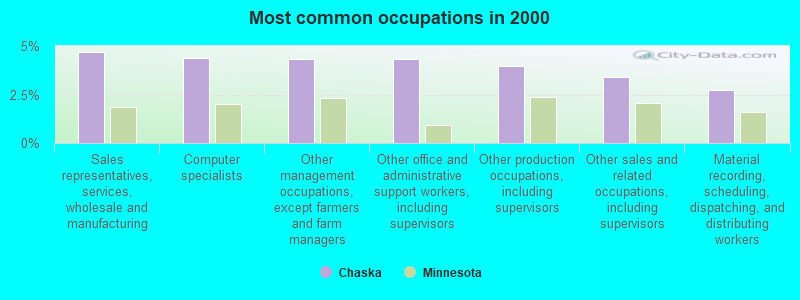
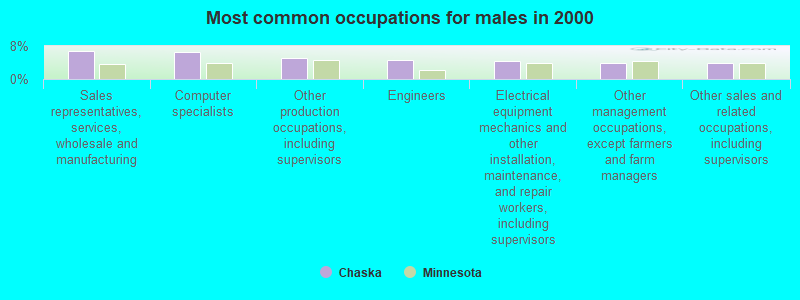
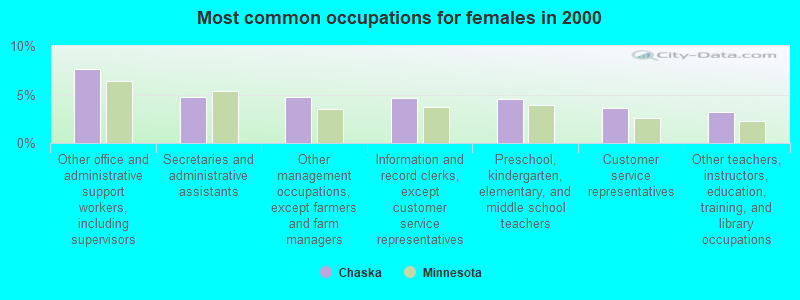
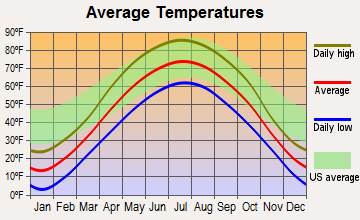
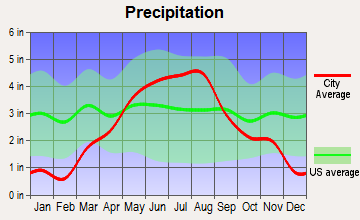
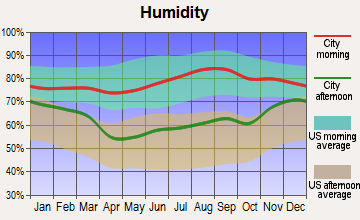
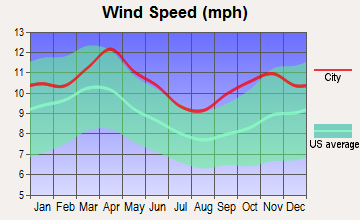
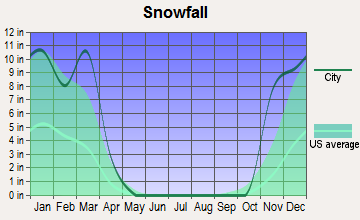
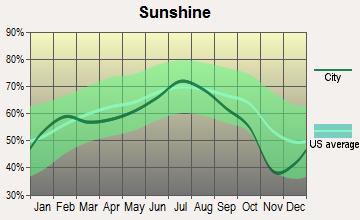
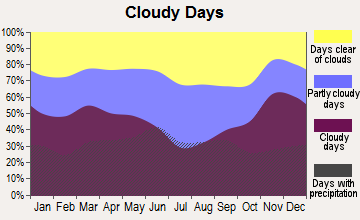


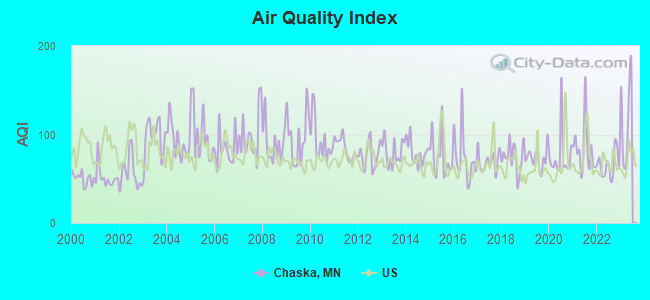
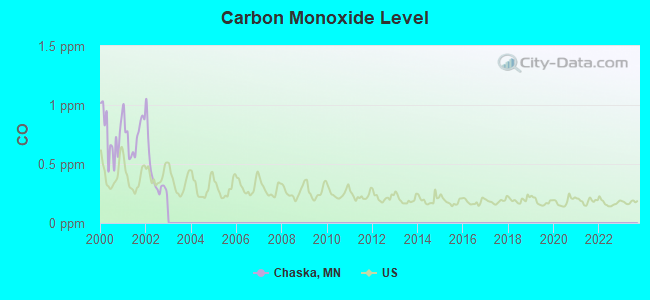
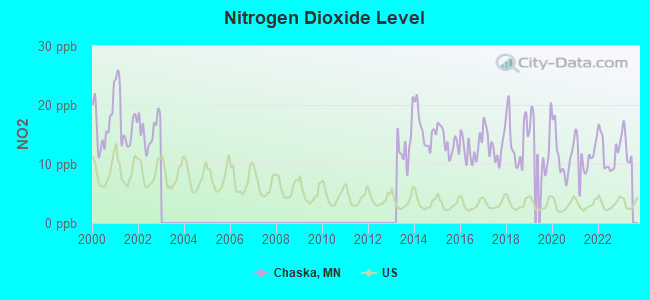
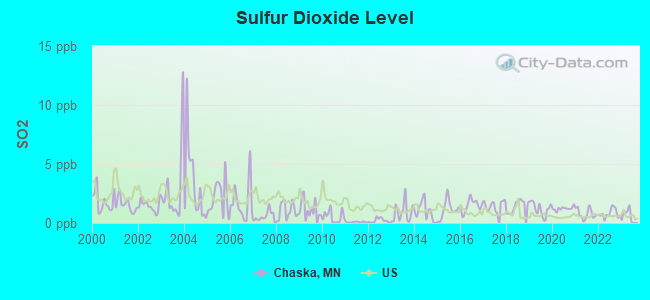
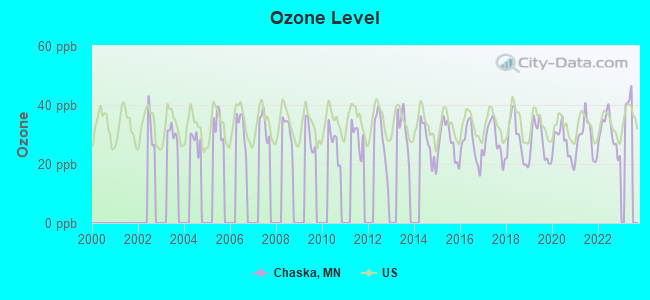
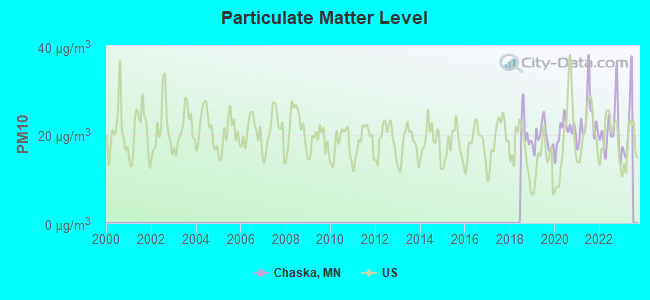
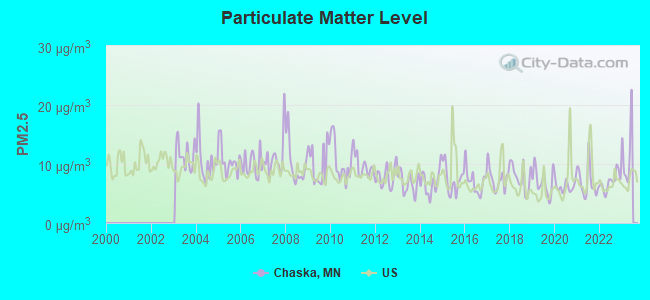
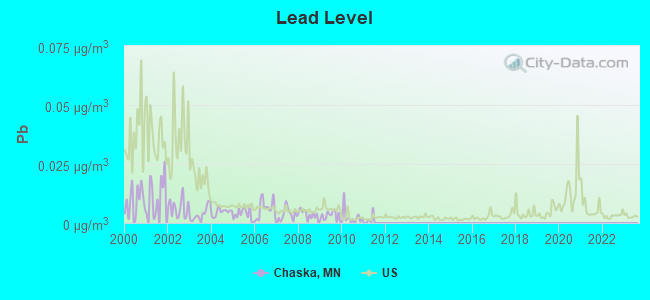
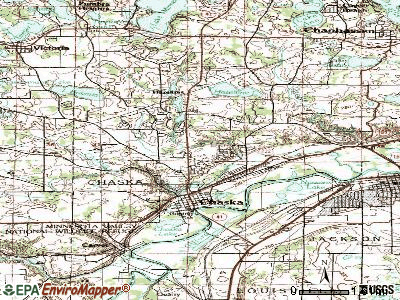
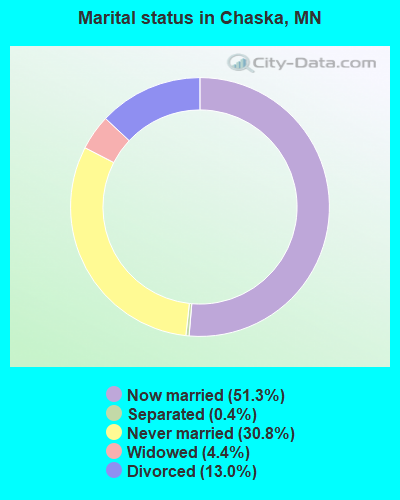
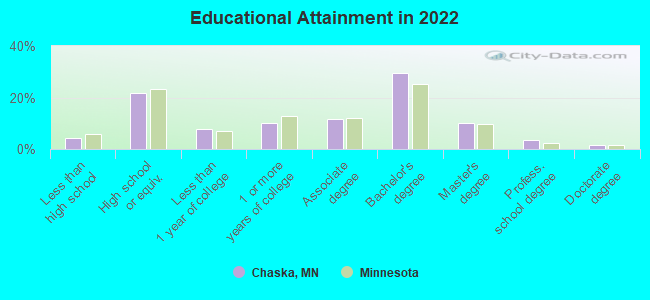
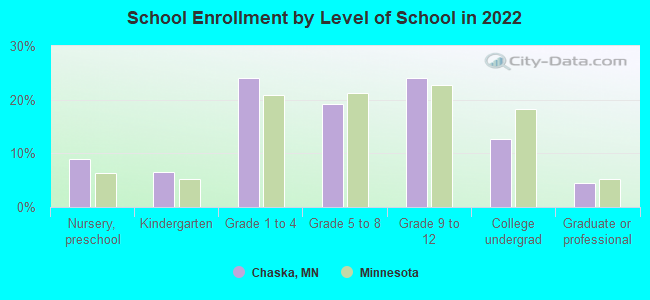
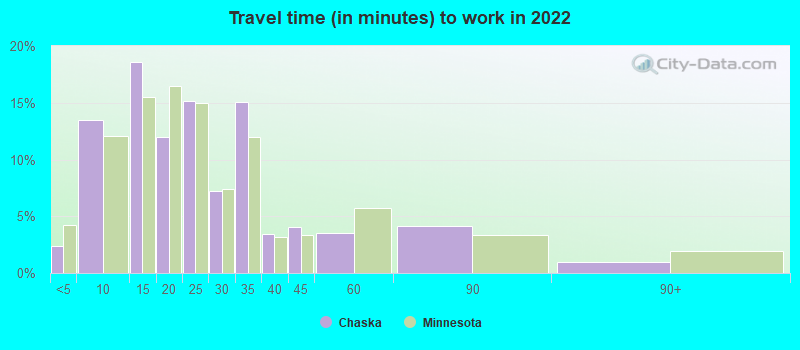
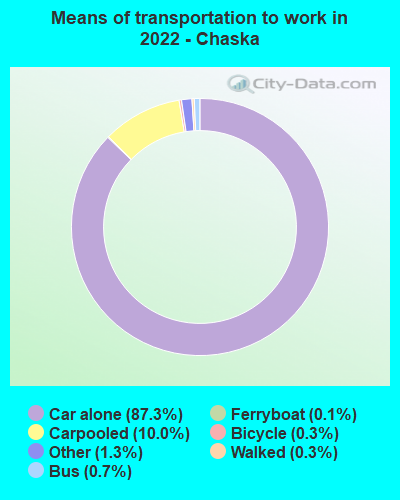
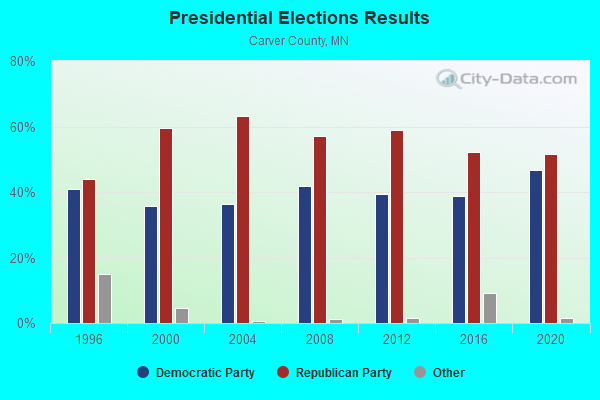
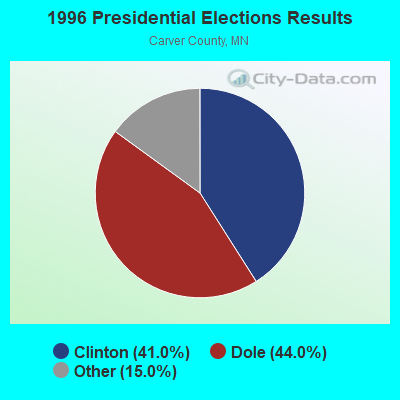
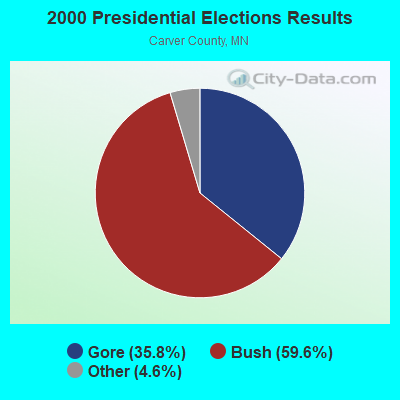
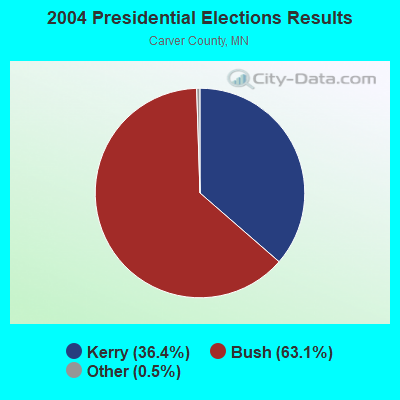
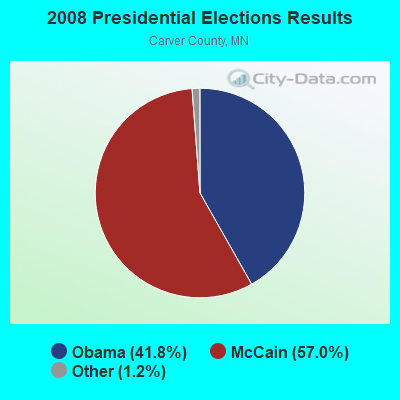
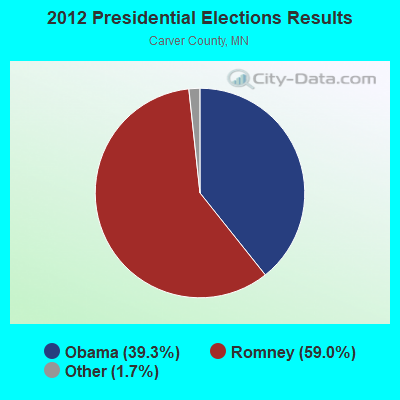
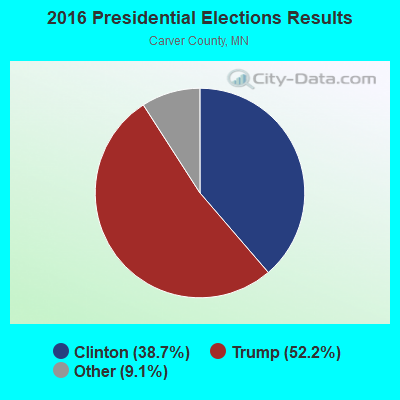
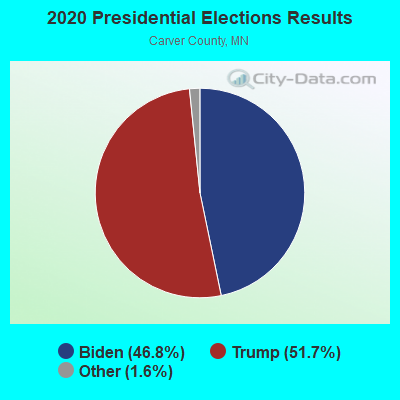
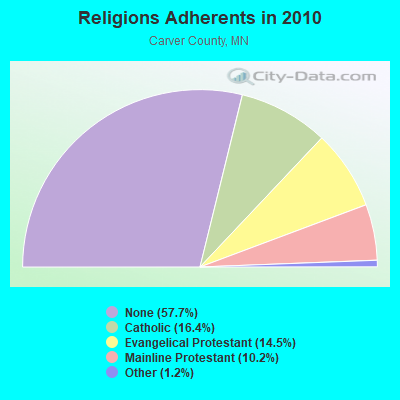
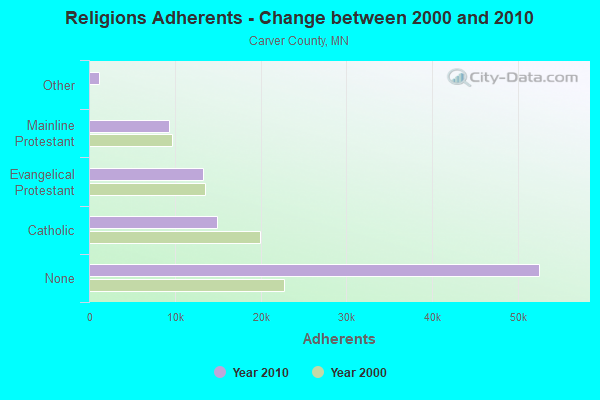
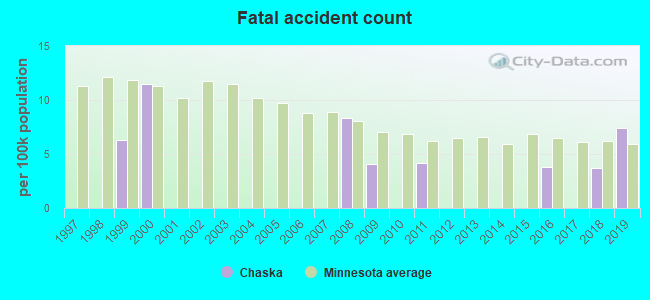
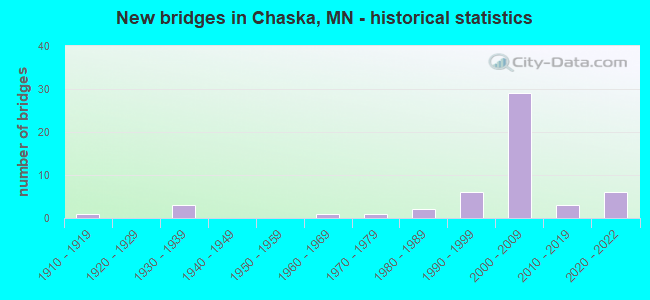
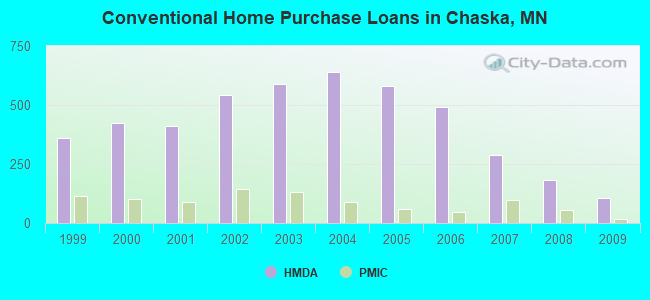
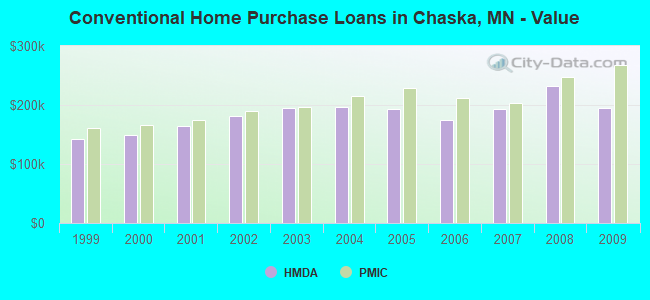
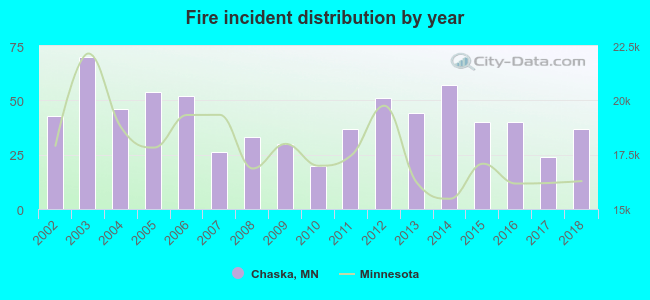 Based on the data from the years 2002 - 2018 the average number of fire incidents per year is 41. The highest number of fire incidents - 70 took place in 2003, and the least - 20 in 2010. The data has a decreasing trend.
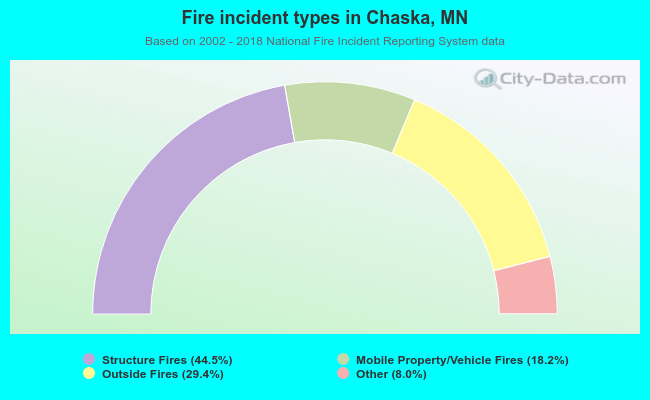 When looking into fire subcategories, the most reports belonged to: Structure Fires (44.5%), and Outside Fires (29.4%).