Cliffside Park, New Jersey Submit your own pictures of this borough and show them to the world
OSM Map
General Map
Google Map
MSN Map
OSM Map
General Map
Google Map
MSN Map
OSM Map
General Map
Google Map
MSN Map
OSM Map
General Map
Google Map
MSN Map
Please wait while loading the map...
Population in 2022: 25,560 (100% urban, 0% rural). Population change since 2000: +11.1%Males: 12,437 Females: 13,123
March 2022 cost of living index in Cliffside Park: 121.6 (high, U.S. average is 100) Percentage of residents living in poverty in 2022: 11.1%for White Non-Hispanic residents , 9.1% for Black residents , 10.3% for Hispanic or Latino residents , 21.9% for other race residents , 6.7% for two or more races residents )
Profiles of local businesses
Business Search - 14 Million verified businesses
Data:
Median household income ($)
Median household income (% change since 2000)
Household income diversity
Ratio of average income to average house value (%)
Ratio of average income to average rent
Median household income ($) - White
Median household income ($) - Black or African American
Median household income ($) - Asian
Median household income ($) - Hispanic or Latino
Median household income ($) - American Indian and Alaska Native
Median household income ($) - Multirace
Median household income ($) - Other Race
Median household income for houses/condos with a mortgage ($)
Median household income for apartments without a mortgage ($)
Races - White alone (%)
Races - White alone (% change since 2000)
Races - Black alone (%)
Races - Black alone (% change since 2000)
Races - American Indian alone (%)
Races - American Indian alone (% change since 2000)
Races - Asian alone (%)
Races - Asian alone (% change since 2000)
Races - Hispanic (%)
Races - Hispanic (% change since 2000)
Races - Native Hawaiian and Other Pacific Islander alone (%)
Races - Native Hawaiian and Other Pacific Islander alone (% change since 2000)
Races - Two or more races (%)
Races - Two or more races (% change since 2000)
Races - Other race alone (%)
Races - Other race alone (% change since 2000)
Racial diversity
Unemployment (%)
Unemployment (% change since 2000)
Unemployment (%) - White
Unemployment (%) - Black or African American
Unemployment (%) - Asian
Unemployment (%) - Hispanic or Latino
Unemployment (%) - American Indian and Alaska Native
Unemployment (%) - Multirace
Unemployment (%) - Other Race
Population density (people per square mile)
Population - Males (%)
Population - Females (%)
Population - Males (%) - White
Population - Males (%) - Black or African American
Population - Males (%) - Asian
Population - Males (%) - Hispanic or Latino
Population - Males (%) - American Indian and Alaska Native
Population - Males (%) - Multirace
Population - Males (%) - Other Race
Population - Females (%) - White
Population - Females (%) - Black or African American
Population - Females (%) - Asian
Population - Females (%) - Hispanic or Latino
Population - Females (%) - American Indian and Alaska Native
Population - Females (%) - Multirace
Population - Females (%) - Other Race
Coronavirus confirmed cases (May 19, 2024)
Deaths caused by coronavirus (May 19, 2024)
Coronavirus confirmed cases (per 100k population) (May 19, 2024)
Deaths caused by coronavirus (per 100k population) (May 19, 2024)
Daily increase in number of cases (May 19, 2024)
Weekly increase in number of cases (May 19, 2024)
Cases doubled (in days) (May 19, 2024)
Hospitalized patients (Apr 18, 2022)
Negative test results (Apr 18, 2022)
Total test results (Apr 18, 2022)
COVID Vaccine doses distributed (per 100k population) (Sep 19, 2023)
COVID Vaccine doses administered (per 100k population) (Sep 19, 2023)
COVID Vaccine doses distributed (Sep 19, 2023)
COVID Vaccine doses administered (Sep 19, 2023)
Likely homosexual households (%)
Likely homosexual households (% change since 2000)
Likely homosexual households - Lesbian couples (%)
Likely homosexual households - Lesbian couples (% change since 2000)
Likely homosexual households - Gay men (%)
Likely homosexual households - Gay men (% change since 2000)
Cost of living index
Median gross rent ($)
Median contract rent ($)
Median monthly housing costs ($)
Median house or condo value ($)
Median house or condo value ($ change since 2000)
Mean house or condo value by units in structure - 1, detached ($)
Mean house or condo value by units in structure - 1, attached ($)
Mean house or condo value by units in structure - 2 ($)
Mean house or condo value by units in structure by units in structure - 3 or 4 ($)
Mean house or condo value by units in structure - 5 or more ($)
Mean house or condo value by units in structure - Boat, RV, van, etc. ($)
Mean house or condo value by units in structure - Mobile home ($)
Median house or condo value ($) - White
Median house or condo value ($) - Black or African American
Median house or condo value ($) - Asian
Median house or condo value ($) - Hispanic or Latino
Median house or condo value ($) - American Indian and Alaska Native
Median house or condo value ($) - Multirace
Median house or condo value ($) - Other Race
Median resident age
Resident age diversity
Median resident age - Males
Median resident age - Females
Median resident age - White
Median resident age - Black or African American
Median resident age - Asian
Median resident age - Hispanic or Latino
Median resident age - American Indian and Alaska Native
Median resident age - Multirace
Median resident age - Other Race
Median resident age - Males - White
Median resident age - Males - Black or African American
Median resident age - Males - Asian
Median resident age - Males - Hispanic or Latino
Median resident age - Males - American Indian and Alaska Native
Median resident age - Males - Multirace
Median resident age - Males - Other Race
Median resident age - Females - White
Median resident age - Females - Black or African American
Median resident age - Females - Asian
Median resident age - Females - Hispanic or Latino
Median resident age - Females - American Indian and Alaska Native
Median resident age - Females - Multirace
Median resident age - Females - Other Race
Commute - mean travel time to work (minutes)
Travel time to work - Less than 5 minutes (%)
Travel time to work - Less than 5 minutes (% change since 2000)
Travel time to work - 5 to 9 minutes (%)
Travel time to work - 5 to 9 minutes (% change since 2000)
Travel time to work - 10 to 19 minutes (%)
Travel time to work - 10 to 19 minutes (% change since 2000)
Travel time to work - 20 to 29 minutes (%)
Travel time to work - 20 to 29 minutes (% change since 2000)
Travel time to work - 30 to 39 minutes (%)
Travel time to work - 30 to 39 minutes (% change since 2000)
Travel time to work - 40 to 59 minutes (%)
Travel time to work - 40 to 59 minutes (% change since 2000)
Travel time to work - 60 to 89 minutes (%)
Travel time to work - 60 to 89 minutes (% change since 2000)
Travel time to work - 90 or more minutes (%)
Travel time to work - 90 or more minutes (% change since 2000)
Marital status - Never married (%)
Marital status - Now married (%)
Marital status - Separated (%)
Marital status - Widowed (%)
Marital status - Divorced (%)
Median family income ($)
Median family income (% change since 2000)
Median non-family income ($)
Median non-family income (% change since 2000)
Median per capita income ($)
Median per capita income (% change since 2000)
Median family income ($) - White
Median family income ($) - Black or African American
Median family income ($) - Asian
Median family income ($) - Hispanic or Latino
Median family income ($) - American Indian and Alaska Native
Median family income ($) - Multirace
Median family income ($) - Other Race
Median year house/condo built
Median year apartment built
Year house built - Built 2005 or later (%)
Year house built - Built 2000 to 2004 (%)
Year house built - Built 1990 to 1999 (%)
Year house built - Built 1980 to 1989 (%)
Year house built - Built 1970 to 1979 (%)
Year house built - Built 1960 to 1969 (%)
Year house built - Built 1950 to 1959 (%)
Year house built - Built 1940 to 1949 (%)
Year house built - Built 1939 or earlier (%)
Average household size
Household density (households per square mile)
Average household size - White
Average household size - Black or African American
Average household size - Asian
Average household size - Hispanic or Latino
Average household size - American Indian and Alaska Native
Average household size - Multirace
Average household size - Other Race
Occupied housing units (%)
Vacant housing units (%)
Owner occupied housing units (%)
Renter occupied housing units (%)
Vacancy status - For rent (%)
Vacancy status - For sale only (%)
Vacancy status - Rented or sold, not occupied (%)
Vacancy status - For seasonal, recreational, or occasional use (%)
Vacancy status - For migrant workers (%)
Vacancy status - Other vacant (%)
Residents with income below the poverty level (%)
Residents with income below 50% of the poverty level (%)
Children below poverty level (%)
Poor families by family type - Married-couple family (%)
Poor families by family type - Male, no wife present (%)
Poor families by family type - Female, no husband present (%)
Poverty status for native-born residents (%)
Poverty status for foreign-born residents (%)
Poverty among high school graduates not in families (%)
Poverty among people who did not graduate high school not in families (%)
Residents with income below the poverty level (%) - White
Residents with income below the poverty level (%) - Black or African American
Residents with income below the poverty level (%) - Asian
Residents with income below the poverty level (%) - Hispanic or Latino
Residents with income below the poverty level (%) - American Indian and Alaska Native
Residents with income below the poverty level (%) - Multirace
Residents with income below the poverty level (%) - Other Race
Air pollution - Air Quality Index (AQI)
Air pollution - CO
Air pollution - NO2
Air pollution - SO2
Air pollution - Ozone
Air pollution - PM10
Air pollution - PM25
Air pollution - Pb
Crime - Murders per 100,000 population
Crime - Rapes per 100,000 population
Crime - Robberies per 100,000 population
Crime - Assaults per 100,000 population
Crime - Burglaries per 100,000 population
Crime - Thefts per 100,000 population
Crime - Auto thefts per 100,000 population
Crime - Arson per 100,000 population
Crime - City-data.com crime index
Crime - Violent crime index
Crime - Property crime index
Crime - Murders per 100,000 population (5 year average)
Crime - Rapes per 100,000 population (5 year average)
Crime - Robberies per 100,000 population (5 year average)
Crime - Assaults per 100,000 population (5 year average)
Crime - Burglaries per 100,000 population (5 year average)
Crime - Thefts per 100,000 population (5 year average)
Crime - Auto thefts per 100,000 population (5 year average)
Crime - Arson per 100,000 population (5 year average)
Crime - City-data.com crime index (5 year average)
Crime - Violent crime index (5 year average)
Crime - Property crime index (5 year average)
1996 Presidential Elections Results (%) - Democratic Party (Clinton)
1996 Presidential Elections Results (%) - Republican Party (Dole)
1996 Presidential Elections Results (%) - Other
2000 Presidential Elections Results (%) - Democratic Party (Gore)
2000 Presidential Elections Results (%) - Republican Party (Bush)
2000 Presidential Elections Results (%) - Other
2004 Presidential Elections Results (%) - Democratic Party (Kerry)
2004 Presidential Elections Results (%) - Republican Party (Bush)
2004 Presidential Elections Results (%) - Other
2008 Presidential Elections Results (%) - Democratic Party (Obama)
2008 Presidential Elections Results (%) - Republican Party (McCain)
2008 Presidential Elections Results (%) - Other
2012 Presidential Elections Results (%) - Democratic Party (Obama)
2012 Presidential Elections Results (%) - Republican Party (Romney)
2012 Presidential Elections Results (%) - Other
2016 Presidential Elections Results (%) - Democratic Party (Clinton)
2016 Presidential Elections Results (%) - Republican Party (Trump)
2016 Presidential Elections Results (%) - Other
2020 Presidential Elections Results (%) - Democratic Party (Biden)
2020 Presidential Elections Results (%) - Republican Party (Trump)
2020 Presidential Elections Results (%) - Other
Ancestries Reported - Arab (%)
Ancestries Reported - Czech (%)
Ancestries Reported - Danish (%)
Ancestries Reported - Dutch (%)
Ancestries Reported - English (%)
Ancestries Reported - French (%)
Ancestries Reported - French Canadian (%)
Ancestries Reported - German (%)
Ancestries Reported - Greek (%)
Ancestries Reported - Hungarian (%)
Ancestries Reported - Irish (%)
Ancestries Reported - Italian (%)
Ancestries Reported - Lithuanian (%)
Ancestries Reported - Norwegian (%)
Ancestries Reported - Polish (%)
Ancestries Reported - Portuguese (%)
Ancestries Reported - Russian (%)
Ancestries Reported - Scotch-Irish (%)
Ancestries Reported - Scottish (%)
Ancestries Reported - Slovak (%)
Ancestries Reported - Subsaharan African (%)
Ancestries Reported - Swedish (%)
Ancestries Reported - Swiss (%)
Ancestries Reported - Ukrainian (%)
Ancestries Reported - United States (%)
Ancestries Reported - Welsh (%)
Ancestries Reported - West Indian (%)
Ancestries Reported - Other (%)
Educational Attainment - No schooling completed (%)
Educational Attainment - Less than high school (%)
Educational Attainment - High school or equivalent (%)
Educational Attainment - Less than 1 year of college (%)
Educational Attainment - 1 or more years of college (%)
Educational Attainment - Associate degree (%)
Educational Attainment - Bachelor's degree (%)
Educational Attainment - Master's degree (%)
Educational Attainment - Professional school degree (%)
Educational Attainment - Doctorate degree (%)
School Enrollment - Nursery, preschool (%)
School Enrollment - Kindergarten (%)
School Enrollment - Grade 1 to 4 (%)
School Enrollment - Grade 5 to 8 (%)
School Enrollment - Grade 9 to 12 (%)
School Enrollment - College undergrad (%)
School Enrollment - Graduate or professional (%)
School Enrollment - Not enrolled in school (%)
School enrollment - Public schools (%)
School enrollment - Private schools (%)
School enrollment - Not enrolled (%)
Median number of rooms in houses and condos
Median number of rooms in apartments
Housing units lacking complete plumbing facilities (%)
Housing units lacking complete kitchen facilities (%)
Density of houses
Urban houses (%)
Rural houses (%)
Households with people 60 years and over (%)
Households with people 65 years and over (%)
Households with people 75 years and over (%)
Households with one or more nonrelatives (%)
Households with no nonrelatives (%)
Population in households (%)
Family households (%)
Nonfamily households (%)
Population in families (%)
Family households with own children (%)
Median number of bedrooms in owner occupied houses
Mean number of bedrooms in owner occupied houses
Median number of bedrooms in renter occupied houses
Mean number of bedrooms in renter occupied houses
Median number of vehichles in owner occupied houses
Mean number of vehichles in owner occupied houses
Median number of vehichles in renter occupied houses
Mean number of vehichles in renter occupied houses
Mortgage status - with mortgage (%)
Mortgage status - with second mortgage (%)
Mortgage status - with home equity loan (%)
Mortgage status - with both second mortgage and home equity loan (%)
Mortgage status - without a mortgage (%)
Average family size
Average family size - White
Average family size - Black or African American
Average family size - Asian
Average family size - Hispanic or Latino
Average family size - American Indian and Alaska Native
Average family size - Multirace
Average family size - Other Race
Geographical mobility - Same house 1 year ago (%)
Geographical mobility - Moved within same county (%)
Geographical mobility - Moved from different county within same state (%)
Geographical mobility - Moved from different state (%)
Geographical mobility - Moved from abroad (%)
Place of birth - Born in state of residence (%)
Place of birth - Born in other state (%)
Place of birth - Native, outside of US (%)
Place of birth - Foreign born (%)
Housing units in structures - 1, detached (%)
Housing units in structures - 1, attached (%)
Housing units in structures - 2 (%)
Housing units in structures - 3 or 4 (%)
Housing units in structures - 5 to 9 (%)
Housing units in structures - 10 to 19 (%)
Housing units in structures - 20 to 49 (%)
Housing units in structures - 50 or more (%)
Housing units in structures - Mobile home (%)
Housing units in structures - Boat, RV, van, etc. (%)
House/condo owner moved in on average (years ago)
Renter moved in on average (years ago)
Year householder moved into unit - Moved in 1999 to March 2000 (%)
Year householder moved into unit - Moved in 1995 to 1998 (%)
Year householder moved into unit - Moved in 1990 to 1994 (%)
Year householder moved into unit - Moved in 1980 to 1989 (%)
Year householder moved into unit - Moved in 1970 to 1979 (%)
Year householder moved into unit - Moved in 1969 or earlier (%)
Means of transportation to work - Drove car alone (%)
Means of transportation to work - Carpooled (%)
Means of transportation to work - Public transportation (%)
Means of transportation to work - Bus or trolley bus (%)
Means of transportation to work - Streetcar or trolley car (%)
Means of transportation to work - Subway or elevated (%)
Means of transportation to work - Railroad (%)
Means of transportation to work - Ferryboat (%)
Means of transportation to work - Taxicab (%)
Means of transportation to work - Motorcycle (%)
Means of transportation to work - Bicycle (%)
Means of transportation to work - Walked (%)
Means of transportation to work - Other means (%)
Working at home (%)
Industry diversity
Most Common Industries - Agriculture, forestry, fishing and hunting, and mining (%)
Most Common Industries - Agriculture, forestry, fishing and hunting (%)
Most Common Industries - Mining, quarrying, and oil and gas extraction (%)
Most Common Industries - Construction (%)
Most Common Industries - Manufacturing (%)
Most Common Industries - Wholesale trade (%)
Most Common Industries - Retail trade (%)
Most Common Industries - Transportation and warehousing, and utilities (%)
Most Common Industries - Transportation and warehousing (%)
Most Common Industries - Utilities (%)
Most Common Industries - Information (%)
Most Common Industries - Finance and insurance, and real estate and rental and leasing (%)
Most Common Industries - Finance and insurance (%)
Most Common Industries - Real estate and rental and leasing (%)
Most Common Industries - Professional, scientific, and management, and administrative and waste management services (%)
Most Common Industries - Professional, scientific, and technical services (%)
Most Common Industries - Management of companies and enterprises (%)
Most Common Industries - Administrative and support and waste management services (%)
Most Common Industries - Educational services, and health care and social assistance (%)
Most Common Industries - Educational services (%)
Most Common Industries - Health care and social assistance (%)
Most Common Industries - Arts, entertainment, and recreation, and accommodation and food services (%)
Most Common Industries - Arts, entertainment, and recreation (%)
Most Common Industries - Accommodation and food services (%)
Most Common Industries - Other services, except public administration (%)
Most Common Industries - Public administration (%)
Occupation diversity
Most Common Occupations - Management, business, science, and arts occupations (%)
Most Common Occupations - Management, business, and financial occupations (%)
Most Common Occupations - Management occupations (%)
Most Common Occupations - Business and financial operations occupations (%)
Most Common Occupations - Computer, engineering, and science occupations (%)
Most Common Occupations - Computer and mathematical occupations (%)
Most Common Occupations - Architecture and engineering occupations (%)
Most Common Occupations - Life, physical, and social science occupations (%)
Most Common Occupations - Education, legal, community service, arts, and media occupations (%)
Most Common Occupations - Community and social service occupations (%)
Most Common Occupations - Legal occupations (%)
Most Common Occupations - Education, training, and library occupations (%)
Most Common Occupations - Arts, design, entertainment, sports, and media occupations (%)
Most Common Occupations - Healthcare practitioners and technical occupations (%)
Most Common Occupations - Health diagnosing and treating practitioners and other technical occupations (%)
Most Common Occupations - Health technologists and technicians (%)
Most Common Occupations - Service occupations (%)
Most Common Occupations - Healthcare support occupations (%)
Most Common Occupations - Protective service occupations (%)
Most Common Occupations - Fire fighting and prevention, and other protective service workers including supervisors (%)
Most Common Occupations - Law enforcement workers including supervisors (%)
Most Common Occupations - Food preparation and serving related occupations (%)
Most Common Occupations - Building and grounds cleaning and maintenance occupations (%)
Most Common Occupations - Personal care and service occupations (%)
Most Common Occupations - Sales and office occupations (%)
Most Common Occupations - Sales and related occupations (%)
Most Common Occupations - Office and administrative support occupations (%)
Most Common Occupations - Natural resources, construction, and maintenance occupations (%)
Most Common Occupations - Farming, fishing, and forestry occupations (%)
Most Common Occupations - Construction and extraction occupations (%)
Most Common Occupations - Installation, maintenance, and repair occupations (%)
Most Common Occupations - Production, transportation, and material moving occupations (%)
Most Common Occupations - Production occupations (%)
Most Common Occupations - Transportation occupations (%)
Most Common Occupations - Material moving occupations (%)
People in Group quarters - Institutionalized population (%)
People in Group quarters - Correctional institutions (%)
People in Group quarters - Federal prisons and detention centers (%)
People in Group quarters - Halfway houses (%)
People in Group quarters - Local jails and other confinement facilities (including police lockups) (%)
People in Group quarters - Military disciplinary barracks (%)
People in Group quarters - State prisons (%)
People in Group quarters - Other types of correctional institutions (%)
People in Group quarters - Nursing homes (%)
People in Group quarters - Hospitals/wards, hospices, and schools for the handicapped (%)
People in Group quarters - Hospitals/wards and hospices for chronically ill (%)
People in Group quarters - Hospices or homes for chronically ill (%)
People in Group quarters - Military hospitals or wards for chronically ill (%)
People in Group quarters - Other hospitals or wards for chronically ill (%)
People in Group quarters - Hospitals or wards for drug/alcohol abuse (%)
People in Group quarters - Mental (Psychiatric) hospitals or wards (%)
People in Group quarters - Schools, hospitals, or wards for the mentally retarded (%)
People in Group quarters - Schools, hospitals, or wards for the physically handicapped (%)
People in Group quarters - Institutions for the deaf (%)
People in Group quarters - Institutions for the blind (%)
People in Group quarters - Orthopedic wards and institutions for the physically handicapped (%)
People in Group quarters - Wards in general hospitals for patients who have no usual home elsewhere (%)
People in Group quarters - Wards in military hospitals for patients who have no usual home elsewhere (%)
People in Group quarters - Juvenile institutions (%)
People in Group quarters - Long-term care (%)
People in Group quarters - Homes for abused, dependent, and neglected children (%)
People in Group quarters - Residential treatment centers for emotionally disturbed children (%)
People in Group quarters - Training schools for juvenile delinquents (%)
People in Group quarters - Short-term care, detention or diagnostic centers for delinquent children (%)
People in Group quarters - Type of juvenile institution unknown (%)
People in Group quarters - Noninstitutionalized population (%)
People in Group quarters - College dormitories (includes college quarters off campus) (%)
People in Group quarters - Military quarters (%)
People in Group quarters - On base (%)
People in Group quarters - Barracks, unaccompanied personnel housing (UPH), (Enlisted/Officer), ;and similar group living quarters for military personnel (%)
People in Group quarters - Transient quarters for temporary residents (%)
People in Group quarters - Military ships (%)
People in Group quarters - Group homes (%)
People in Group quarters - Homes or halfway houses for drug/alcohol abuse (%)
People in Group quarters - Homes for the mentally ill (%)
People in Group quarters - Homes for the mentally retarded (%)
People in Group quarters - Homes for the physically handicapped (%)
People in Group quarters - Other group homes (%)
People in Group quarters - Religious group quarters (%)
People in Group quarters - Dormitories (%)
People in Group quarters - Agriculture workers' dormitories on farms (%)
People in Group quarters - Job Corps and vocational training facilities (%)
People in Group quarters - Other workers' dormitories (%)
People in Group quarters - Crews of maritime vessels (%)
People in Group quarters - Other nonhousehold living situations (%)
People in Group quarters - Other noninstitutional group quarters (%)
Residents speaking English at home (%)
Residents speaking English at home - Born in the United States (%)
Residents speaking English at home - Native, born elsewhere (%)
Residents speaking English at home - Foreign born (%)
Residents speaking Spanish at home (%)
Residents speaking Spanish at home - Born in the United States (%)
Residents speaking Spanish at home - Native, born elsewhere (%)
Residents speaking Spanish at home - Foreign born (%)
Residents speaking other language at home (%)
Residents speaking other language at home - Born in the United States (%)
Residents speaking other language at home - Native, born elsewhere (%)
Residents speaking other language at home - Foreign born (%)
Class of Workers - Employee of private company (%)
Class of Workers - Self-employed in own incorporated business (%)
Class of Workers - Private not-for-profit wage and salary workers (%)
Class of Workers - Local government workers (%)
Class of Workers - State government workers (%)
Class of Workers - Federal government workers (%)
Class of Workers - Self-employed workers in own not incorporated business and Unpaid family workers (%)
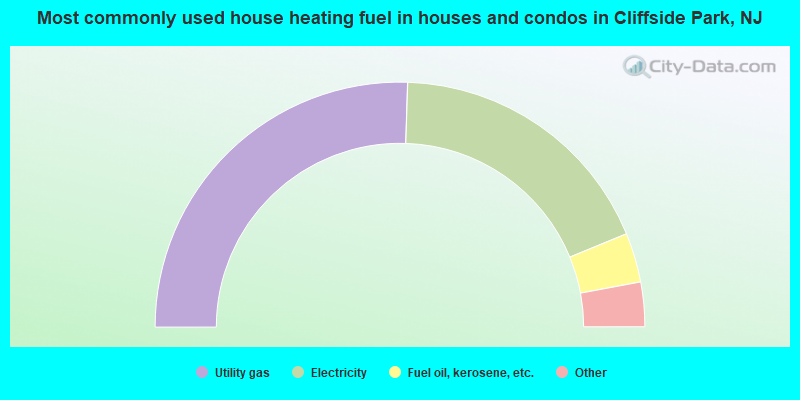
House heating fuel used in houses and condos - Utility gas (%)
House heating fuel used in houses and condos - Bottled, tank, or LP gas (%)
House heating fuel used in houses and condos - Electricity (%)
House heating fuel used in houses and condos - Fuel oil, kerosene, etc. (%)
House heating fuel used in houses and condos - Coal or coke (%)
House heating fuel used in houses and condos - Wood (%)
House heating fuel used in houses and condos - Solar energy (%)
House heating fuel used in houses and condos - Other fuel (%)
House heating fuel used in houses and condos - No fuel used (%)
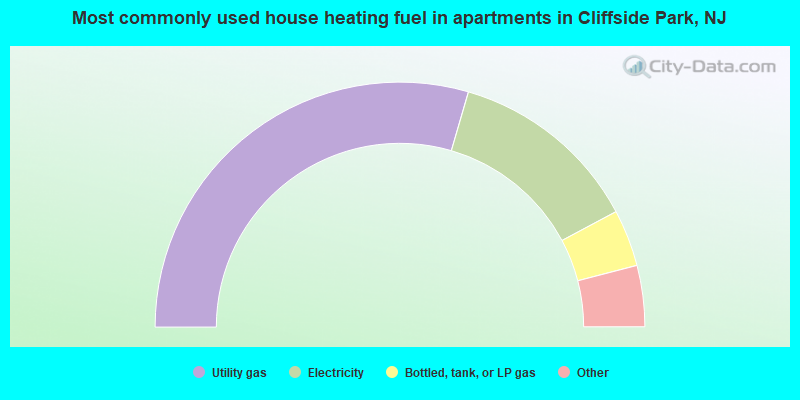
House heating fuel used in apartments - Utility gas (%)
House heating fuel used in apartments - Bottled, tank, or LP gas (%)
House heating fuel used in apartments - Electricity (%)
House heating fuel used in apartments - Fuel oil, kerosene, etc. (%)
House heating fuel used in apartments - Coal or coke (%)
House heating fuel used in apartments - Wood (%)
House heating fuel used in apartments - Solar energy (%)
House heating fuel used in apartments - Other fuel (%)
House heating fuel used in apartments - No fuel used (%)
Armed forces status - In Armed Forces (%)
Armed forces status - Civilian (%)
Armed forces status - Civilian - Veteran (%)
Armed forces status - Civilian - Nonveteran (%)
Fatal accidents locations in years 2005-2021
Fatal accidents locations in 2005
Fatal accidents locations in 2006
Fatal accidents locations in 2007
Fatal accidents locations in 2008
Fatal accidents locations in 2009
Fatal accidents locations in 2010
Fatal accidents locations in 2011
Fatal accidents locations in 2012
Fatal accidents locations in 2013
Fatal accidents locations in 2014
Fatal accidents locations in 2015
Fatal accidents locations in 2016
Fatal accidents locations in 2017
Fatal accidents locations in 2018
Fatal accidents locations in 2019
Fatal accidents locations in 2020
Fatal accidents locations in 2021
Alcohol use - People drinking some alcohol every month (%)
Alcohol use - People not drinking at all (%)
Alcohol use - Average days/month drinking alcohol
Alcohol use - Average drinks/week
Alcohol use - Average days/year people drink much
Audiometry - Average condition of hearing (%)
Audiometry - People that can hear a whisper from across a quiet room (%)
Audiometry - People that can hear normal voice from across a quiet room (%)
Audiometry - Ears ringing, roaring, buzzing (%)
Audiometry - Had a job exposure to loud noise (%)
Audiometry - Had off-work exposure to loud noise (%)
Blood Pressure & Cholesterol - Has high blood pressure (%)
Blood Pressure & Cholesterol - Checking blood pressure at home (%)
Blood Pressure & Cholesterol - Frequently checking blood cholesterol (%)
Blood Pressure & Cholesterol - Has high cholesterol level (%)
Consumer Behavior - Money monthly spent on food at supermarket/grocery store
Consumer Behavior - Money monthly spent on food at other stores
Consumer Behavior - Money monthly spent on eating out
Consumer Behavior - Money monthly spent on carryout/delivered foods
Consumer Behavior - Income spent on food at supermarket/grocery store (%)
Consumer Behavior - Income spent on food at other stores (%)
Consumer Behavior - Income spent on eating out (%)
Consumer Behavior - Income spent on carryout/delivered foods (%)
Current Health Status - General health condition (%)
Current Health Status - Blood donors (%)
Current Health Status - Has blood ever tested for HIV virus (%)
Current Health Status - Left-handed people (%)
Dermatology - People using sunscreen (%)
Diabetes - Diabetics (%)
Diabetes - Had a blood test for high blood sugar (%)
Diabetes - People taking insulin (%)
Diet Behavior & Nutrition - Diet health (%)
Diet Behavior & Nutrition - Milk product consumption (# of products/month)
Diet Behavior & Nutrition - Meals not home prepared (#/week)
Diet Behavior & Nutrition - Meals from fast food or pizza place (#/week)
Diet Behavior & Nutrition - Ready-to-eat foods (#/month)
Diet Behavior & Nutrition - Frozen meals/pizza (#/month)
Drug Use - People that ever used marijuana or hashish (%)
Drug Use - Ever used hard drugs (%)
Drug Use - Ever used any form of cocaine (%)
Drug Use - Ever used heroin (%)
Drug Use - Ever used methamphetamine (%)
Health Insurance - People covered by health insurance (%)
Kidney Conditions-Urology - Avg. # of times urinating at night
Medical Conditions - People with asthma (%)
Medical Conditions - People with anemia (%)
Medical Conditions - People with psoriasis (%)
Medical Conditions - People with overweight (%)
Medical Conditions - Elderly people having difficulties in thinking or remembering (%)
Medical Conditions - People who ever received blood transfusion (%)
Medical Conditions - People having trouble seeing even with glass/contacts (%)
Medical Conditions - People with arthritis (%)
Medical Conditions - People with gout (%)
Medical Conditions - People with congestive heart failure (%)
Medical Conditions - People with coronary heart disease (%)
Medical Conditions - People with angina pectoris (%)
Medical Conditions - People who ever had heart attack (%)
Medical Conditions - People who ever had stroke (%)
Medical Conditions - People with emphysema (%)
Medical Conditions - People with thyroid problem (%)
Medical Conditions - People with chronic bronchitis (%)
Medical Conditions - People with any liver condition (%)
Medical Conditions - People who ever had cancer or malignancy (%)
Mental Health - People who have little interest in doing things (%)
Mental Health - People feeling down, depressed, or hopeless (%)
Mental Health - People who have trouble sleeping or sleeping too much (%)
Mental Health - People feeling tired or having little energy (%)
Mental Health - People with poor appetite or overeating (%)
Mental Health - People feeling bad about themself (%)
Mental Health - People who have trouble concentrating on things (%)
Mental Health - People moving or speaking slowly or too fast (%)
Mental Health - People having thoughts they would be better off dead (%)
Oral Health - Average years since last visit a dentist
Oral Health - People embarrassed because of mouth (%)
Oral Health - People with gum disease (%)
Oral Health - General health of teeth and gums (%)
Oral Health - Average days a week using dental floss/device
Oral Health - Average days a week using mouthwash for dental problem
Oral Health - Average number of teeth
Pesticide Use - Households using pesticides to control insects (%)
Pesticide Use - Households using pesticides to kill weeds (%)
Physical Activity - People doing vigorous-intensity work activities (%)
Physical Activity - People doing moderate-intensity work activities (%)
Physical Activity - People walking or bicycling (%)
Physical Activity - People doing vigorous-intensity recreational activities (%)
Physical Activity - People doing moderate-intensity recreational activities (%)
Physical Activity - Average hours a day doing sedentary activities
Physical Activity - Average hours a day watching TV or videos
Physical Activity - Average hours a day using computer
Physical Functioning - People having limitations keeping them from working (%)
Physical Functioning - People limited in amount of work they can do (%)
Physical Functioning - People that need special equipment to walk (%)
Physical Functioning - People experiencing confusion/memory problems (%)
Physical Functioning - People requiring special healthcare equipment (%)
Prescription Medications - Average number of prescription medicines taking
Preventive Aspirin Use - Adults 40+ taking low-dose aspirin (%)
Reproductive Health - Vaginal deliveries (%)
Reproductive Health - Cesarean deliveries (%)
Reproductive Health - Deliveries resulted in a live birth (%)
Reproductive Health - Pregnancies resulted in a delivery (%)
Reproductive Health - Women breastfeeding newborns (%)
Reproductive Health - Women that had a hysterectomy (%)
Reproductive Health - Women that had both ovaries removed (%)
Reproductive Health - Women that have ever taken birth control pills (%)
Reproductive Health - Women taking birth control pills (%)
Reproductive Health - Women that have ever used Depo-Provera or injectables (%)
Reproductive Health - Women that have ever used female hormones (%)
Sexual Behavior - People 18+ that ever had sex (vaginal, anal, or oral) (%)
Sexual Behavior - Males 18+ that ever had vaginal sex with a woman (%)
Sexual Behavior - Males 18+ that ever performed oral sex on a woman (%)
Sexual Behavior - Males 18+ that ever had anal sex with a woman (%)
Sexual Behavior - Males 18+ that ever had any sex with a man (%)
Sexual Behavior - Females 18+ that ever had vaginal sex with a man (%)
Sexual Behavior - Females 18+ that ever performed oral sex on a man (%)
Sexual Behavior - Females 18+ that ever had anal sex with a man (%)
Sexual Behavior - Females 18+ that ever had any kind of sex with a woman (%)
Sexual Behavior - Average age people first had sex
Sexual Behavior - Average number of female sex partners in lifetime (males 18+)
Sexual Behavior - Average number of female vaginal sex partners in lifetime (males 18+)
Sexual Behavior - Average age people first performed oral sex on a woman (18+)
Sexual Behavior - Average number of woman performed oral sex on in lifetime (18+)
Sexual Behavior - Average number of male sex partners in lifetime (males 18+)
Sexual Behavior - Average number of male anal sex partners in lifetime (males 18+)
Sexual Behavior - Average age people first performed oral sex on a man (18+)
Sexual Behavior - Average number of male oral sex partners in lifetime (18+)
Sexual Behavior - People using protection when performing oral sex (%)
Sexual Behavior - Average number of times people have vaginal or anal sex a year
Sexual Behavior - People having sex without condom (%)
Sexual Behavior - Average number of male sex partners in lifetime (females 18+)
Sexual Behavior - Average number of male vaginal sex partners in lifetime (females 18+)
Sexual Behavior - Average number of female sex partners in lifetime (females 18+)
Sexual Behavior - Circumcised males 18+ (%)
Sleep Disorders - Average hours sleeping at night
Sleep Disorders - People that has trouble sleeping (%)
Smoking-Cigarette Use - People smoking cigarettes (%)
Taste & Smell - People 40+ having problems with smell (%)
Taste & Smell - People 40+ having problems with taste (%)
Taste & Smell - People 40+ that ever had wisdom teeth removed (%)
Taste & Smell - People 40+ that ever had tonsils teeth removed (%)
Taste & Smell - People 40+ that ever had a loss of consciousness because of a head injury (%)
Taste & Smell - People 40+ that ever had a broken nose or other serious injury to face or skull (%)
Taste & Smell - People 40+ that ever had two or more sinus infections (%)
Weight - Average height (inches)
Weight - Average weight (pounds)
Weight - Average BMI
Weight - People that are obese (%)
Weight - People that ever were obese (%)
Weight - People trying to lose weight (%)
According to our research of New Jersey and other state lists, there was 1 registered sex offender living in Cliffside Park, New Jersey as of May 19, 2024 . The ratio of all residents to sex offenders in Cliffside Park is 24,895 to 1.The ratio of registered sex offenders to all residents in this city is much lower than the state average.
Officers per 1,000 residents here:
1.53New Jersey average:
5.53
Latest news from Cliffside Park, NJ collected exclusively by city-data.com from local newspapers, TV, and radio stations
Ancestries: Italian (8.6%), Brazilian (4.4%), Russian (3.7%), Arab (3.3%), Turkish (2.7%), Palestinian (2.6%).
Current Local Time:
Land area: 0.96 square miles.
Population density: 26,494 people per square mile (very high).
12,165 residents are foreign born (22.6% Latin America , 11.8% Asia , 10.4% Europe ).
This borough:
47.6%New Jersey:
23.2%
Median real estate property taxes paid for housing units with mortgages in 2022: $9,742 (1.7%)Median real estate property taxes paid for housing units with no mortgage in 2022: $10,001 (2.1%)
Nearest city with pop. 50,000+: Manhattan, NY
Nearest cities:
Latitude: 40.82 N, Longitude: 73.99 W
Daytime population change due to commuting: -8,539 (-33.4%)Workers who live and work in this borough: 3,293 (25.1%)
Area code commonly used in this area: 201
Unemployment in December 2023:
Population change in the 1990s: +2,570 (+12.6%).
Most common occupations in Cliffside Park, NJ (%)
Both Males Females
Other sales and related occupations, including supervisors (5.7%)
Other management occupations, except farmers and farm managers (4.4%)
Sales representatives, services, wholesale and manufacturing (4.2%)
Secretaries and administrative assistants (4.1%)
Other office and administrative support workers, including supervisors (3.9%)
Building and grounds cleaning and maintenance occupations (3.1%)
Other production occupations, including supervisors (2.8%)
Other sales and related occupations, including supervisors (5.6%)
Sales representatives, services, wholesale and manufacturing (5.3%)
Other management occupations, except farmers and farm managers (5.0%)
Material recording, scheduling, dispatching, and distributing workers (3.6%)
Computer specialists (3.5%)
Driver/sales workers and truck drivers (3.5%)
Top executives (3.1%)
Secretaries and administrative assistants (9.0%)
Other office and administrative support workers, including supervisors (5.8%)
Other sales and related occupations, including supervisors (5.7%)
Building and grounds cleaning and maintenance occupations (4.4%)
Information and record clerks, except customer service representatives (4.0%)
Preschool, kindergarten, elementary, and middle school teachers (3.7%)
Other management occupations, except farmers and farm managers (3.6%)
Tornado activity:
Cliffside Park-area historical tornado activity is slightly below New Jersey state average. It is 40% smaller than the overall U.S. average.
On 5/28/1973, a category F3 (max. wind speeds 158-206 mph) tornado 26.8 miles away from the Cliffside Park borough center caused between $50,000 and $500,000 in damages.
On 7/15/1970, a category F2 (max. wind speeds 113-157 mph) tornado 7.7 miles away from the borough center caused between $5000 and $50,000 in damages.
Earthquake activity:
Cliffside Park-area historical earthquake activity is significantly above New Jersey state average. It is 69% smaller than the overall U.S. average. On 8/23/2011 at 17:51:04, a magnitude 5.8 (5.8 MW, Depth: 3.7 mi, Class: Moderate, Intensity: VI - VII) earthquake occurred 291.7 miles away from the city center On 10/7/1983 at 10:18:46, a magnitude 5.3 (5.1 MB, 5.3 LG, 5.1 ML) earthquake occurred 217.3 miles away from the city center On 1/16/1994 at 01:49:16, a magnitude 4.6 (4.6 MB, 4.6 LG, Depth: 3.1 mi, Class: Light, Intensity: IV - V) earthquake occurred 112.8 miles away from the city center On 4/20/2002 at 10:50:47, a magnitude 5.3 (5.3 ML, Depth: 3.0 mi) earthquake occurred 255.7 miles away from the city center On 4/20/2002 at 10:50:47, a magnitude 5.2 (5.2 MB, 4.2 MS, 5.2 MW, 5.0 MW) earthquake occurred 253.9 miles away from Cliffside Park center On 8/22/1992 at 12:20:32, a magnitude 4.8 (4.8 MB, 3.8 MS, 4.7 LG, Depth: 6.2 mi) earthquake occurred 227.9 miles away from Cliffside Park center Magnitude types: regional Lg-wave magnitude (LG), body-wave magnitude (MB), local magnitude (ML), surface-wave magnitude (MS), moment magnitude (MW) Natural disasters: The number of natural disasters in Bergen County (29) is a lot greater than the US average (15).Major Disasters (Presidential) Declared: 18Emergencies Declared: 10Floods: 7, Hurricanes: 7, Storms: 6, Heavy Rains: 4, Snowstorms: 4, Winter Storms: 3, Blizzards: 2, Water Shortages: 2, Power Outage: 1, Tornado: 1, Tropical Storm: 1, Wind: 1, Other: 3 (Note: some incidents may be assigned to more than one category). Hospitals and medical centers near Cliffside Park: FMC FAIRVIEW (Dialysis Facility, about 1 miles away; FAIRVIEW, NJ)
HOSPICE OF NEW YORK, LLC (Hospital, about 1 miles away; LONG ISLAND CITY, NY)
HUDSON VIEW CARE AND REHAB CTR (Nursing Home, about 2 miles away; NORTH BERGEN, NJ)
CARITAS HEALTH CARE, INC (Hospital, about 2 miles away; ELMHURST, NY)
ST MARYS CENTER INC (Nursing Home, about 2 miles away; NEW YORK, NY)
ST LUKE'S ROOSEVELT HOSPITAL (about 2 miles away; NEW YORK, NY)
AMSTERDAM NURSING HOME CORP (1992) (Nursing Home, about 2 miles away; NEW YORK, NY)
Amtrak stations near Cliffside Park: 5 miles: NEW YORK (PENN STA) (NEW YORK, 7TH AVE. & W. 32ND ST.) Services: ticket office, fully wheelchair accessible, enclosed waiting area, public restrooms, public payphones, full-service food facilities, snack bar, vending machines, ATM, paid short-term parking, paid long-term parking, call for car rental service, taxi stand, public transit connection.
8 miles: LA GUARDIA AIRPORT (QUEENS, ) - Bus Station Services: enclosed waiting area, public restrooms, public payphones, snack bar and vending machines, ATM, paid short-term parking, paid long-term parking, car rental agency, taxi stand.
10 miles: YONKERS (FOOT OF DOCK ST. & WELLS AVE.) Services: fully wheelchair accessible, enclosed waiting area, public restrooms, public payphones, snack bar, paid short-term parking, paid long-term parking, call for car rental service, taxi stand, public transit connection.
Colleges/universities with over 2000 students nearest to Cliffside Park:
Barnard College (about 2 miles; New York, NY ; Full-time enrollment: 2,425)
Teachers College at Columbia University (about 2 miles; New York, NY ; FT enrollment: 3,762)
Columbia University in the City of New York (about 2 miles; New York, NY ; FT enrollment: 23,396)
CUNY City College (about 3 miles; New York, NY ; FT enrollment: 12,533)
CUNY Hostos Community College (about 4 miles; Bronx, NY ; FT enrollment: 4,764)
CUNY John Jay College of Criminal Justice (about 4 miles; New York, NY ; FT enrollment: 12,091)
Yeshiva University (about 4 miles; New York, NY ; FT enrollment: 4,015)
Public high school in Cliffside Park:
Public elementary/middle schools in Cliffside Park: SCHOOL #3 Location: 397 PALISADE AVENUE, Grades: KG-6)
SCHOOL #4 Location: 279 COLUMBIA AVENUE, Grades: PK-6)
SCHOOL #5 Location: 214 DAY AVE, Grades: KG-6)
SCHOOL #6 Location: 440 OAKDENE AVE, Grades: KG-8)
Private elementary/middle school in Cliffside Park: CHILDREN'S HOME MONTESSORI SCHOOL Students: 53, Location: 777 ANDERSON AVE, Grades: PK-3)
See full list of schools located in Cliffside Park Library in Cliffside Park: CLIFFSIDE PARK FREE PUBLIC LIBRARY Operating income: $1,223,366; Location: 505 PALISADE AVENUE; 59,563 books ; 4,428 audio materials ; 5,145 video materials ; 2 local licensed databases ; 22 state licensed databases ; 3 other licensed databases ; 122 print serial subscriptions ; 7 electronic serial subscriptions )
User-submitted facts and corrections:
Cliffside Park has A very big spanish neighborhood
Notable location: (A) . Display/hide its location on the map
Churches in Cliffside Park include: (A) , First Baptist Church of Cliffside Park (B) , Trinity Evangelical Lutheran Church (C) , Grantwood Congregational Church (D) , Trinity Episcopal Church (E) , Good Shepherd Church (F) . Display/hide their locations on the map
Tourist attraction:
Birthplace of: Betsy Blair - Actress, Gus Lesnevich - Boxer.
Bergen County has a predicted average indoor radon screening level between 2 and 4 pCi/L (pico curies per liter) - Moderate Potential Average household size: This borough:
2.4 peopleNew Jersey:
2.7 people
Percentage of family households: This borough:
62.1%Whole state:
69.3%
Percentage of households with unmarried partners: This borough:
5.6%Whole state:
5.9%
Likely homosexual households (counted as self-reported same-sex unmarried-partner households)
Lesbian couples: 0.2% of all households Gay men: 0.3% of all households
3 people in other noninstitutional facilities in 2010people in other group homes in 2000people in religious group quarters in 2000
Banks with branches in Cliffside Park (2011 data):
TD Bank, National Association: Towers Branch at 733 Palisade Avenue, branch established on 1972/05/01; Grantwood Branch at 732 Anderson Avenue, branch established on 1963/06/10. Info updated 2010/10/04: Bank assets: $188,912.6 mil, Deposits: $153,149.8 mil, headquarters in Wilmington, DE, positive income , 1314 total offices , Holding Company: Toronto-Dominion Bank, The
Hudson City Savings Bank: Cliffside Park Branch at 684 Anderson Avenue, branch established on 1973/08/20. Info updated 2012/01/09: Bank assets: $45,373.6 mil, Deposits: $25,645.6 mil, headquarters in Paramus, NJ, negative income in the last year , Mortgage Lending Specialization, 135 total offices
Bank of New Jersey: Cliffside Park Branch at 354 Palisade Avenue, branch established on 2012/03/21. Info updated 2008/07/31: Bank assets: $469.8 mil, Deposits: $416.2 mil, headquarters in Fort Lee, NJ, positive income , Commercial Lending Specialization, 7 total offices , Holding Company: Bancorp Of New Jersey, Inc.
Wells Fargo Bank, National Association: Cliffside Park Branch at 650 Anderson Avenue, branch established on 1974/06/29. Info updated 2011/04/05: Bank assets: $1,161,490.0 mil, Deposits: $905,653.0 mil, headquarters in Sioux Falls, SD, positive income , 6395 total offices , Holding Company: Wells Fargo & Company
MARINERS BANK: Cliffside Park Branch at 757-763 Palisade Avenue, branch established on 2006/09/16. Info updated 2010/07/21: Bank assets: $295.9 mil, Deposits: $268.5 mil, headquarters in Edgewater, NJ, positive income , Commercial Lending Specialization, 7 total offices , Holding Company: Mariner's Bancorp
Oritani Bank: Anderson Ave Branch at 742 Anderson Ave, branch established on 1911/01/01. Info updated 2008/09/08: Bank assets: $2,567.1 mil, Deposits: $1,374.4 mil, headquarters in Township Of Washington, NJ, positive income , Commercial Lending Specialization, 25 total offices
Sovereign Bank, National Association: Cliffside Park Branch at 707 Anderson Avenue, branch established on 1995/11/17. Info updated 2012/01/31: Bank assets: $78,146.9 mil, Deposits: $48,042.9 mil, headquarters in Wilmington, DE, positive income , Commercial Lending Specialization, 718 total offices , Holding Company: Banco Santander, S.A.
For population 15 years and over in Cliffside Park:
Never married: 32.0%Now married: 51.7%Separated: 2.7%Widowed: 5.4%Divorced: 8.1% For population 25 years and over in Cliffside Park:
High school or higher: 87.4%Bachelor's degree or higher: 44.3%Graduate or professional degree: 16.7%Unemployed: 4.5%Mean travel time to work (commute): 29.3 minutes
Education Gini index (Inequality in education) Here:
14.9New Jersey average:
12.8
Religion statistics for Cliffside Park, NJ (based on Bergen County data)
Religion Adherents Congregations Catholic 430,007 80 Other 53,728 120 Mainline Protestant 45,613 210 Evangelical Protestant 33,419 234 Orthodox 14,373 20 Black Protestant 6,286 17 None 321,690 -
Source: Clifford Grammich, Kirk Hadaway, Richard Houseal, Dale E.Jones, Alexei Krindatch, Richie Stanley and Richard H.Taylor. 2012. 2010 U.S.Religion Census: Religious Congregations & Membership Study. Association of Statisticians of American Religious Bodies. Jones, Dale E., et al. 2002. Congregations and Membership in the United States 2000. Nashville, TN: Glenmary Research Center. Graphs represent county-level data
Food Environment Statistics: Number of grocery stores : 258This county :
2.90 / 10,000 pop.New Jersey :
2.90 / 10,000 pop.
Number of supercenters and club stores : 5Bergen County :
0.06 / 10,000 pop.New Jersey :
0.06 / 10,000 pop.
Number of convenience stores (no gas) : 134Bergen County :
1.51 / 10,000 pop.New Jersey :
1.76 / 10,000 pop.
Number of convenience stores (with gas) : 95This county :
1.07 / 10,000 pop.New Jersey :
0.81 / 10,000 pop.
Number of full-service restaurants : 718This county :
8.07 / 10,000 pop.New Jersey :
7.15 / 10,000 pop.
Adult diabetes rate : Bergen County :
8.0%New Jersey :
8.3%
Adult obesity rate : Here :
19.6%New Jersey :
23.3%
Low-income preschool obesity rate : Here :
17.9%New Jersey :
18.0%
Health and Nutrition: Healthy diet rate : Cliffside Park:
52.6%New Jersey:
50.6%
Average overall health of teeth and gums : This city:
50.3%New Jersey:
48.5%
Average BMI : Cliffside Park:
27.9New Jersey:
28.5
People feeling badly about themselves : Cliffside Park:
18.8%New Jersey:
20.0%
People not drinking alcohol at all : This city:
12.2%New Jersey:
11.1%
Average hours sleeping at night : Cliffside Park:
6.9New Jersey:
6.8
Overweight people : Cliffside Park:
32.0%State:
33.6%
General health condition : Cliffside Park:
57.9%New Jersey:
56.9%
Average condition of hearing : Cliffside Park:
79.6%New Jersey:
80.0%
More about Health and Nutrition of Cliffside Park, NJ Residents
Local government employment and payroll (March 2022)
Function
Full-time employees
Monthly full-time payroll
Average yearly full-time wage
Part-time employees
Monthly part-time payroll
Police Protection - Officers
52 $583,963 $134,761 0 $0 Police - Other
24 $95,186 $47,593 38 $81,344 Solid Waste Management
23 $126,248 $65,869 16 $22,043 Housing and Community Development (Local)
21 $110,720 $63,269 21 $43,912 Parks and Recreation
11 $50,627 $55,229 7 $15,874 Other and Unallocable
8 $39,091 $58,637 0 $0 Health
7 $42,579 $72,993 15 $13,444 Financial Administration
6 $37,255 $74,510 3 $5,354 Local Libraries
6 $33,728 $67,456 14 $19,725 Other Government Administration
5 $42,335 $101,604 8 $17,767 Judicial and Legal
3 $18,190 $72,760 5 $8,197 Firefighters
3 $22,637 $90,548 8 $12,123 Sewerage
0 $0 1 $410
Totals for Government
169 $1,202,558 $85,389 136 $240,195
Cliffside Park government finances - Expenditure in 2018 (per resident):
Construction - General - Other: $468,000 ($18.31)
Parks and Recreation: $88,000 ($3.44)Sewerage: $8,000 ($0.31)Regular Highways: $5,000 ($0.20)Current Operations - General - Other: $9,103,000 ($356.14)
Police Protection: $5,772,000 ($225.82)Housing and Community Development: $5,512,000 ($215.65)Libraries: $1,815,000 ($71.01)Regular Highways: $1,340,000 ($52.43)Parks and Recreation: $866,000 ($33.88)Health - Other: $852,000 ($33.33)Central Staff Services: $632,000 ($24.73)Judicial and Legal Services: $564,000 ($22.07)Solid Waste Management: $491,000 ($19.21)Local Fire Protection: $485,000 ($18.97)Financial Administration: $451,000 ($17.64)General Public Buildings: $379,000 ($14.83)Protective Inspection and Regulation - Other: $272,000 ($10.64)Sewerage: $20,000 ($0.78)General - Interest on Debt: $1,186,000 ($46.40)
Intergovernmental to Local - Other - Sewerage: $2,807,000 ($109.82)
Other - Solid Waste Management: $794,000 ($31.06)Other - Housing and Community Development: $81,000 ($3.17)Other Capital Outlay - Parks and Recreation: $1,000 ($0.04)
Police Protection: $1,000 ($0.04)General - Other: $1,000 ($0.04)Total Salaries and Wages: $706,000 ($27.62)
Cliffside Park government finances - Revenue in 2018 (per resident):
Charges - Housing and Community Development: $1,683,000 ($65.85)
Other: $604,000 ($23.63)Parks and Recreation: $102,000 ($3.99)Parking Facilities: $44,000 ($1.72)Federal Intergovernmental - Housing and Community Development: $5,322,000 ($208.22)
Other: $75,000 ($2.93)Local Intergovernmental - Other: $108,000 ($4.23)
Housing and Community Development: $57,000 ($2.23)Sewerage: $8,000 ($0.31)Miscellaneous - General Revenue - Other: $881,000 ($34.47)
Fines and Forfeits: $586,000 ($22.93)Rents: $114,000 ($4.46)Interest Earnings: $38,000 ($1.49)Sale of Property: $23,000 ($0.90)Donations From Private Sources: $17,000 ($0.67)State Intergovernmental - General Local Government Support: $1,216,000 ($47.57)
Other: $745,000 ($29.15)Health and Hospitals: $59,000 ($2.31)Housing and Community Development: $29,000 ($1.13)Tax - Property: $29,083,000 ($1137.83)
Other License: $522,000 ($20.42)Public Utilities Sales: $294,000 ($11.50)Alcoholic Beverage License: $37,000 ($1.45)
Cliffside Park government finances - Debt in 2018 (per resident):
Long Term Debt - Beginning Outstanding - Unspecified Public Purpose: $25,257,000 ($988.15)
Outstanding Unspecified Public Purpose: $24,062,000 ($941.39)Retired Unspecified Public Purpose: $1,195,000 ($46.75)
Cliffside Park government finances - Cash and Securities in 2018 (per resident):
Bond Funds - Cash and Securities: $2,522,000 ($98.67)
Other Funds - Cash and Securities: $11,861,000 ($464.05)
6.00% of this county's 2021 resident taxpayers lived in other counties in 2020 ($117,506 average adjusted gross income )
Here:
6.00%New Jersey average:
6.70%
0.01% of residents moved from foreign countries ($60 average AGI )Bergen County:
0.01%New Jersey average:
0.01%
Top counties from which taxpayers relocated into this county between 2020 and 2021:
6.43% of this county's 2020 resident taxpayers moved to other counties in 2021 ($129,044 average adjusted gross income )
Here:
6.43%New Jersey average:
7.02%
0.01% of residents moved to foreign countries ($163 average AGI )Bergen County:
0.01%New Jersey average:
0.02%
Top counties to which taxpayers relocated from this county between 2020 and 2021:
Businesses in Cliffside Park, NJ
Name Count Name Count
7-Eleven 1 H&R Block 1 AT&T 1 Nike 3 Domino's Pizza 1 Rite Aid 1 Dunkin Donuts 1 UPS 2 FedEx 2
Strongest AM radio stations in Cliffside Park:
WBBR (1130 AM; 50 kW; NEW YORK, NY; Owner: BLOOMBERG COMMUNICATIONS INC.)
WEPN (1050 AM; 50 kW; NEW YORK, NY; Owner: NEW YORK AM RADIO, LLC)
WOR (710 AM; 50 kW; NEW YORK, NY; Owner: BUCKLEY BROADCASTING CORPORATION)
WADO (1280 AM; 50 kW; NEW YORK, NY; Owner: WADO-AM LICENSE CORP.)
WABC (770 AM; 50 kW; NEW YORK, NY; Owner: WABC-AM RADIO, INC.)
WMCA (570 AM; 50 kW; NEW YORK, NY; Owner: SALEM MEDIA OF NEW YORK, LLC)
WINS (1010 AM; 50 kW; NEW YORK, NY; Owner: INFINITY BROADCASTING OPERATIONS, INC.)
WWRL (1600 AM; 25 kW; NEW YORK, NY; Owner: ACCESS.1 COMMUNICATIONS CORP.-NY)
WLIB (1190 AM; 30 kW; NEW YORK, NY; Owner: ICBC BROADCAST HOLDINGS-NY, INC.)
WZRC (1480 AM; 5 kW; NEW YORK, NY; Owner: MULTICULTURAL RADIO BRODCASTING, INC)
WFAN (660 AM; 50 kW; NEW YORK, NY; Owner: INFINITY BROADCASTING OPERATIONS, INC.)
WQEW (1560 AM; 50 kW; NEW YORK, NY; Owner: THE NEW YORK TIMES ELECTRONIC MEDIA COMPANY)
WCBS (880 AM; 50 kW; NEW YORK, NY; Owner: INFINITY BROADCASTING OPERATIONS, INC.)
Strongest FM radio stations in Cliffside Park:
WKCR-FM (89.9 FM; NEW YORK, NY; Owner: TRUSTEES OF COLUMBIA UNIVERSITY IN NEW YORK)
WKTU (103.5 FM; LAKE SUCCESS, NY; Owner: AMFM RADIO LICENSES, LLC)
WCBS-FM (101.1 FM; NEW YORK, NY; Owner: INFINITY BROADCASTING OPERATIONS, INC.)
WAXQ (104.3 FM; NEW YORK, NY; Owner: AMFM NEW YORK LICENSES, LLC)
WHTZ (100.3 FM; NEWARK, NJ; Owner: AMFM RADIO LICENSES, L.L.C.)
WWPR-FM (105.1 FM; NEW YORK, NY; Owner: AMFM RADIO LICENSES, L.L.C.)
WQCD (101.9 FM; NEW YORK, NY; Owner: EMMIS RADIO LICENSE CORPORATION)
WCAA (105.9 FM; NEWARK, NJ; Owner: WADO-AM LICENSE CORP. ("WADO"))
WBAI (99.5 FM; NEW YORK, NY; Owner: PACIFICA FOUNDATION, INC.)
WBLS (107.5 FM; NEW YORK, NY; Owner: ICBC BROADCAST HOLDINGS-NY, INC.)
WLTW (106.7 FM; NEW YORK, NY; Owner: AMFM NEW YORK LICENSES, LLC)
WQXR-FM (96.3 FM; NEW YORK, NY; Owner: THE NEW YORK TIMES ELECTRONIC MEDIA COMPANY)
WSKQ-FM (97.9 FM; NEW YORK, NY; Owner: WSKQ LICENSING, INC.)
WXRK (92.3 FM; NEW YORK, NY; Owner: INFINITY BROADCASTING OPERATIONS, INC.)
WQHT (97.1 FM; NEW YORK, NY; Owner: EMMIS LICENSE CORPORATION OF NEW YORK)
W276AQ (103.1 FM; FORT LEE, NJ; Owner: GERARD A. TURRO)
WNEW (102.7 FM; NEW YORK, NY; Owner: INFINITY BROADCASTING OPERATIONS, INC.)
WHCR-FM (90.3 FM; NEW YORK, NY; Owner: CITY COLLEGE OF NEW YORK)
WNYC-FM (93.9 FM; NEW YORK, NY; Owner: WNYC RADIO)
WPAT-FM (93.1 FM; PATERSON, NJ; Owner: WPAT LICENSING, INC.)
TV broadcast stations around Cliffside Park:
WNYW (Channel 5; NEW YORK, NY; Owner: FOX TELEVISION STATIONS, INC.)
WNJU (Channel 47; LINDEN, NJ; Owner: WNJU LICENSE CORPORATION)
WFUT (Channel 68; NEWARK, NJ; Owner: UNIVISION NEW YORK LLC)
WNYE-TV (Channel 25; NEW YORK, NY; Owner: NEW YORK CITY BOARD OF EDUCATION)
WXNY-LP (Channel 32; NEW YORK, NY; Owner: ISLAND BROADCASTING COMPANY)
WCBS-TV (Channel 2; NEW YORK, NY; Owner: CBS BROADCASTING INC.)
WKOB-LP (Channel 53; NEW YORK, NY; Owner: WKOB COMMUNICATIONS, INC.)
WEBR-CA (Channel 17; MANHATTAN, NY; Owner: K LICENSEE INC.)
WRNN-LP (Channel 57; NYACK, NY; Owner: LP NYACK LIMITED PARTNERSHIP)
WABC-TV (Channel 7; NEW YORK, NY; Owner: AMERICAN BROADCASTING COMPANIES, INC)
WPIX (Channel 11; NEW YORK, NY; Owner: WPIX, INC.)
WWOR-TV (Channel 9; SECAUCUS, NJ; Owner: FOX TELEVISION STATIONS, INC.)
WPXN-TV (Channel 31; NEW YORK, NY; Owner: PAXSON COMMUNICATIONS LICENSE COMPANY, LLC)
WNBC (Channel 4; NEW YORK, NY; Owner: NATIONAL BROADCASTING COMPANY, INC.)
WNET (Channel 13; NEWARK, NJ; Owner: EDUCATIONAL BROADCASTING CORPORATION)
WXTV (Channel 41; PATERSON, NJ; Owner: WXTV LICENSE PARTNERSHIP, G.P.)
W60AI (Channel 60; NEW YORK, NY; Owner: VENTANA TELEVISION, INC.)
WNXY-LP (Channel 26; NEW YORK, NY; Owner: ISLAND BROADCASTING COMPANY)
W33BS (Channel 33; DARIEN, CT; Owner: CT&T BROADCASTING, INC.)
WNYN-LP (Channel 39; NEW YORK, NY; Owner: ISLAND BROADCASTING COMPANY)
WNYX-LP (Channel 35; NEW YORK, NY; Owner: ISLAND BROADCASTING COMPANY)
WPXO-LP (Channel 34; EAST ORANGE, NJ; Owner: PAXSON COMMUNICATIONS LPTV, INC.)
W68DN (Channel 68; CHERRY HILL, ETC., NJ; Owner: MARCIA COHEN)
W38CL (Channel 38; BRONX, NY; Owner: RENARD COMMUNICATIONS CORP.)
WFME-TV (Channel 66; WEST MILFORD, NJ; Owner: FAMILY STATIONS, INC.)
FCC Registered Antenna Towers: 5
Marin Fettman, 344 Gorge Road (Nj-05-811b) (Lat: 40.815750 Lon: -73.989139), Type: 13.1, Overall height: 13.1 m, Registrant: Omnipoint Holdings, Inc., Marin.Fettman@t-Mobile.Com, , Belle-vue, Phone: (425) 378-4000 Dan Menser, 344 Gorge Road (Nj-05-811b) (Lat: 40.815750 Lon: -73.989139), Type: 13.1, Overall height: 13.1 m, Registrant: Omnipoint Holdings, Inc., Dan.Menser@t-Mobile.Com, , Belle-vue, Phone: (425) 378-4000 Marin Fettman, 344 Gorge Road (Nj-05-811b) (Lat: 40.815750 Lon: -73.989139), Type: 13.1, Overall height: 13.1 m, Registrant: T-Mobile Northeast LLC, Marin.Fettman@t-Mobile.Com, , Belle-vue, Phone: (425) 378-4000 Marin Fettman, 344 Gorge Road (Nj-05-811b) (Lat: 40.815750 Lon: -73.989139), Type: 13.1, Overall height: 13.1 m, Registrant: Omnipoint Communications Inc., Marin.Fettman@t-Mobile.Com, , Belle-vue, Phone: (425) 383-4000 Marin Fettman, 344 Gorge Road (Nj-05-811b) (Lat: 40.815750 Lon: -73.989139), Type: 13.1, Overall height: 13.1 m, Registrant: Marin.Fettman@t-Mobile.Com, , Belle-vue, Phone: (425) 383-4000 FCC Registered Broadcast Land Mobile Towers: 5
Municipal Bldg Palisades Ave & Gorge Rd (Lat: 40.822333 Lon: -73.988472), Call Sign: KED411, Assigned Frequencies: 33.8600 MHz, 154.280 MHz, 154.355 MHz, 154.445 MHz, Grant Date: 02/12/2015, Expiration Date: 02/01/2025, Registrant: Goosetown Communications, 58 No. Harrison Ave., Congers, NY 10920, Phone: (845) 268-7500, Fax: (845) 268-5345, Email:
300 Winston Dr (Lat: 40.828722 Lon: -73.978750), Call Sign: KEF825, Assigned Frequencies: 154.445 MHz, Grant Date: 04/03/2015, Expiration Date: 06/11/2025, Registrant: Business Radio Licensing, 30251 Golden Lantern, Suite E # 501, Laguna Niguel, CA 92677, Phone: (949) 348-8510, Fax: (949) 348-8514, Email:
500 Gorge Rd (Lat: 40.823722 Lon: -73.987917), Call Sign: KEB387, Assigned Frequencies: 155.610 MHz, 154.680 MHz, 155.475 MHz, Grant Date: 12/01/2011, Expiration Date: 01/21/2022, Cancellation Date: 03/26/2022, Registrant: Goosetown Comm., 58 No. Harrison Ave., Congers, NY 10920, Phone: (845) 268-7500, Fax: (845) 268-5345, Email:
200 Winston Dr (Lat: 40.826389 Lon: -73.980000), Call Sign: WPKD639, Assigned Frequencies: 451.537 MHz, 456.537 MHz, 452.662 MHz, 457.662 MHz, Grant Date: 01/03/2002, Expiration Date: 01/25/2012, Cancellation Date: 03/31/2012, Certifier: Jack Pirreca, Registrant: National License Corporation, 9050 Briarclift Rd, Indianapolis, IN 46256, Phone: (317) 849-5866, Fax: (317) 841-3328, Email:
Lat: 40.827611 Lon: -73.982639, Call Sign: WQGN792, Assigned Frequencies: 158.310 MHz, 154.585 MHz, 158.302 MHz, Grant Date: 02/09/2017, Expiration Date: 03/12/2027, Certifier: Matthew Halton, Registrant: Wireless Management Corp, Fair Lawn, NJ 07410, Phone: (201) 926-3510, Fax: (201) 796-5805, Email:
FCC Registered Microwave Towers: 3
NJ-NNJ5713A, 633 Palisades Avenue (Lat: 40.823889 Lon: -73.984444), Type: Bant, Structure height: 21.3 m, Overall height: 24.3 m, Call Sign: WQLT400, Assigned Frequencies: 17965.0 MHz, Grant Date: 07/07/2020, Expiration Date: 04/20/2030, Cancellation Date: 09/13/2021, Certifier: Nadja S Sodos-Wallace, Registrant: T-Mobile Usa, Inc., 12920 Se 38th Street, Bellevue, WA 98006, Phone: (425) 383-8402, Fax: (425) 383-4840, Email:
TS-NYC0314, 200-300 Winston Dr (Lat: 40.828306 Lon: -73.979417), Type: Building, Structure height: 173.4 m, Overall height: 175 m, Call Sign: WQUA446, Assigned Frequencies: 10995.0 MHz, 10995.0 MHz, 10995.0 MHz, 10995.0 MHz, 10995.0 MHz, 10835.0 MHz, 10835.0 MHz, 10835.0 MHz, 10835.0 MHz, 10835.0 MHz... (+3 more), Grant Date: 05/20/2014, Expiration Date: 05/20/2024, Certifier: Arthur Giftakis, Registrant: Micronet Communications, Inc., 812 Lexington Dr, Plano, TX 75075, Phone: (972) 422-7200, Email:
NJCLP0001, 800 Palisade Avenue (Lat: 40.828556 Lon: -73.979667), Type: Building, Structure height: 170 m, Overall height: 172 m, Call Sign: WREB502, Assigned Frequencies: 17815.0 MHz, 17815.0 MHz, Grant Date: 09/11/2019, Expiration Date: 09/11/2029, Certifier: Dana Staggs, Registrant: Widmo Holdings LLC, 38 Chauncy Street, 2nd Floor, Boston, MA 02111, Phone: (617) 861-8300, Email:
FCC Registered Paging Towers: 1
200 Winston Drive (Lat: 40.827222 Lon: -73.979167), Type: Bant, Structure height: 93 m, Overall height: 101 m, Call Sign: KEC932, Assigned Frequencies: 454.800 MHz, 454.725 MHz, 454.750 MHz, 454.675 MHz, 454.700 MHz, 454.775 MHz, 454.825 MHz, Grant Date: 10/22/2019, Expiration Date: 09/01/2029, Certifier: William Tolpegin, Registrant: Aura Network Systems, Inc., 1765 Greensboro Station Place, 9th Floor, Mclean, VA 22102, Phone: (703) 973-8730, Email:
FCC Registered Amateur Radio Licenses: 29 (
See the full list of FCC Registered Amateur Radio Licenses in Cliffside Park )
FAA Registered Aircraft: 9 (
See the full list of FAA Registered Aircraft in Cliffside Park )
Home Mortgage Disclosure Act Aggregated Statistics For Year 2009(Based on 3 full tracts) A) FHA, FSA/RHS & VA B) Conventional C) Refinancings D) Home Improvement Loans E) Loans on Dwellings For 5+ Families F) Non-occupant Loans on G) Loans On Manufactured Number Average Value Number Average Value Number Average Value Number Average Value Number Average Value Number Average Value Number Average Value
LOANS ORIGINATED 19 $358,947 124 $287,871 303 $299,069 16 $122,625 4 $1,375,000 25 $240,480 2 $245,000 APPLICATIONS APPROVED, NOT ACCEPTED 2 $349,000 16 $306,812 32 $305,719 3 $7,667 1 $2,400,000 1 $309,000 0 $0 APPLICATIONS DENIED 9 $404,333 37 $306,676 219 $308,753 11 $159,182 0 $0 16 $254,875 0 $0 APPLICATIONS WITHDRAWN 9 $355,222 25 $273,120 82 $320,646 4 $292,750 1 $499,000 5 $274,000 0 $0 FILES CLOSED FOR INCOMPLETENESS 3 $413,000 11 $261,545 36 $353,944 6 $195,333 0 $0 5 $297,800 0 $0
Aggregated Statistics For Year 2008(Based on 3 full tracts) A) FHA, FSA/RHS & VA B) Conventional C) Refinancings D) Home Improvement Loans E) Loans on Dwellings For 5+ Families F) Non-occupant Loans on G) Loans On Manufactured Number Average Value Number Average Value Number Average Value Number Average Value Number Average Value Number Average Value Number Average Value
LOANS ORIGINATED 10 $317,000 196 $311,694 171 $295,901 33 $125,939 4 $922,750 35 $288,514 0 $0 APPLICATIONS APPROVED, NOT ACCEPTED 2 $306,500 39 $347,026 56 $274,679 4 $74,250 2 $584,000 8 $294,500 0 $0 APPLICATIONS DENIED 8 $312,750 55 $348,564 138 $364,159 19 $161,053 4 $225,000 22 $279,864 1 $25,000 APPLICATIONS WITHDRAWN 4 $319,250 33 $344,030 54 $342,852 5 $63,200 0 $0 6 $233,333 0 $0 FILES CLOSED FOR INCOMPLETENESS 0 $0 17 $265,706 16 $348,875 1 $50,000 0 $0 6 $190,000 0 $0
Aggregated Statistics For Year 2007(Based on 3 full tracts) A) FHA, FSA/RHS & VA B) Conventional C) Refinancings D) Home Improvement Loans E) Loans on Dwellings For 5+ Families F) Non-occupant Loans on G) Loans On Manufactured Number Average Value Number Average Value Number Average Value Number Average Value Number Average Value Number Average Value Number Average Value
LOANS ORIGINATED 0 $0 295 $308,108 272 $335,290 28 $134,821 9 $2,696,889 60 $330,283 0 $0 APPLICATIONS APPROVED, NOT ACCEPTED 0 $0 46 $317,870 73 $348,192 8 $166,625 0 $0 6 $348,667 0 $0 APPLICATIONS DENIED 2 $329,000 95 $431,126 189 $377,481 34 $129,029 2 $312,500 36 $352,333 3 $224,000 APPLICATIONS WITHDRAWN 1 $365,000 40 $314,100 95 $393,158 7 $247,429 1 $376,000 9 $358,333 1 $250,000 FILES CLOSED FOR INCOMPLETENESS 0 $0 8 $363,375 24 $439,000 0 $0 0 $0 5 $435,800 0 $0
Aggregated Statistics For Year 2006(Based on 3 full tracts) B) Conventional C) Refinancings D) Home Improvement Loans E) Loans on Dwellings For 5+ Families F) Non-occupant Loans on G) Loans On Manufactured Number Average Value Number Average Value Number Average Value Number Average Value Number Average Value Number Average Value
LOANS ORIGINATED 391 $319,120 390 $317,428 67 $134,776 8 $1,087,500 59 $327,915 1 $417,000 APPLICATIONS APPROVED, NOT ACCEPTED 52 $325,846 64 $298,812 23 $103,087 0 $0 14 $354,786 0 $0 APPLICATIONS DENIED 103 $380,981 154 $383,753 42 $148,690 2 $325,000 24 $374,667 1 $315,000 APPLICATIONS WITHDRAWN 65 $335,600 87 $290,425 9 $237,889 2 $1,667,500 9 $283,556 0 $0 FILES CLOSED FOR INCOMPLETENESS 10 $361,400 35 $379,143 2 $43,000 0 $0 7 $358,857 0 $0
Aggregated Statistics For Year 2005(Based on 3 full tracts) A) FHA, FSA/RHS & VA B) Conventional C) Refinancings D) Home Improvement Loans E) Loans on Dwellings For 5+ Families F) Non-occupant Loans on G) Loans On Manufactured Number Average Value Number Average Value Number Average Value Number Average Value Number Average Value Number Average Value Number Average Value
LOANS ORIGINATED 1 $225,000 484 $331,442 365 $315,441 46 $137,652 8 $733,875 75 $317,120 1 $265,000 APPLICATIONS APPROVED, NOT ACCEPTED 0 $0 61 $321,115 81 $270,519 21 $58,190 0 $0 10 $329,200 1 $123,000 APPLICATIONS DENIED 1 $354,000 98 $294,755 155 $340,845 41 $115,415 2 $213,000 16 $339,625 3 $103,333 APPLICATIONS WITHDRAWN 1 $240,000 65 $346,031 109 $286,404 12 $246,250 2 $237,500 16 $322,375 0 $0 FILES CLOSED FOR INCOMPLETENESS 0 $0 13 $324,077 68 $339,441 2 $14,000 0 $0 2 $197,500 0 $0
Aggregated Statistics For Year 2004(Based on 3 full tracts) A) FHA, FSA/RHS & VA B) Conventional C) Refinancings D) Home Improvement Loans E) Loans on Dwellings For 5+ Families F) Non-occupant Loans on G) Loans On Manufactured Number Average Value Number Average Value Number Average Value Number Average Value Number Average Value Number Average Value Number Average Value
LOANS ORIGINATED 1 $472,000 437 $296,407 399 $256,248 57 $109,439 5 $672,600 72 $282,583 1 $80,000 APPLICATIONS APPROVED, NOT ACCEPTED 0 $0 83 $301,060 66 $226,864 9 $123,111 0 $0 14 $257,786 0 $0 APPLICATIONS DENIED 2 $313,500 82 $322,976 150 $267,207 39 $67,333 0 $0 26 $264,885 1 $7,000 APPLICATIONS WITHDRAWN 1 $428,000 60 $315,767 82 $259,280 7 $140,000 1 $300,000 14 $262,929 0 $0 FILES CLOSED FOR INCOMPLETENESS 0 $0 9 $273,778 18 $306,389 2 $57,500 0 $0 1 $65,000 0 $0
Aggregated Statistics For Year 2003(Based on 3 full tracts) A) FHA, FSA/RHS & VA B) Conventional C) Refinancings D) Home Improvement Loans E) Loans on Dwellings For 5+ Families F) Non-occupant Loans on Number Average Value Number Average Value Number Average Value Number Average Value Number Average Value Number Average Value
LOANS ORIGINATED 5 $256,000 380 $262,297 949 $206,435 31 $63,258 8 $817,875 76 $221,211 APPLICATIONS APPROVED, NOT ACCEPTED 0 $0 48 $270,708 135 $173,519 9 $59,889 0 $0 10 $163,700 APPLICATIONS DENIED 0 $0 43 $285,535 220 $223,655 34 $37,059 1 $1,750,000 27 $221,593 APPLICATIONS WITHDRAWN 0 $0 48 $308,167 144 $255,264 11 $73,909 1 $319,000 10 $258,800 FILES CLOSED FOR INCOMPLETENESS 0 $0 8 $244,375 41 $251,463 1 $116,000 0 $0 8 $200,875
Aggregated Statistics For Year 2002(Based on 3 full tracts) A) FHA, FSA/RHS & VA B) Conventional C) Refinancings D) Home Improvement Loans E) Loans on Dwellings For 5+ Families F) Non-occupant Loans on Number Average Value Number Average Value Number Average Value Number Average Value Number Average Value Number Average Value
LOANS ORIGINATED 7 $194,429 346 $243,723 590 $272,642 45 $52,511 8 $556,375 73 $191,616 APPLICATIONS APPROVED, NOT ACCEPTED 0 $0 41 $264,293 104 $185,183 15 $52,867 0 $0 8 $185,875 APPLICATIONS DENIED 2 $256,500 63 $309,302 137 $173,577 29 $48,379 1 $300,000 12 $195,583 APPLICATIONS WITHDRAWN 0 $0 28 $219,071 104 $185,952 5 $138,600 1 $2,000,000 6 $154,500 FILES CLOSED FOR INCOMPLETENESS 0 $0 12 $181,667 25 $194,120 1 $10,000 0 $0 7 $197,714
Aggregated Statistics For Year 2001(Based on 3 full tracts) A) FHA, FSA/RHS & VA B) Conventional C) Refinancings D) Home Improvement Loans E) Loans on Dwellings For 5+ Families F) Non-occupant Loans on Number Average Value Number Average Value Number Average Value Number Average Value Number Average Value Number Average Value
LOANS ORIGINATED 17 $222,176 335 $200,991 367 $189,324 38 $48,605 9 $527,889 41 $178,439 APPLICATIONS APPROVED, NOT ACCEPTED 1 $241,000 56 $203,768 70 $178,700 10 $62,400 1 $240,000 4 $211,500 APPLICATIONS DENIED 0 $0 51 $206,961 109 $140,321 41 $48,390 0 $0 14 $214,000 APPLICATIONS WITHDRAWN 1 $137,000 40 $211,825 92 $158,913 11 $33,818 0 $0 2 $89,000 FILES CLOSED FOR INCOMPLETENESS 0 $0 13 $209,538 26 $184,423 3 $68,333 0 $0 0 $0
Aggregated Statistics For Year 2000(Based on 3 full tracts) A) FHA, FSA/RHS & VA B) Conventional C) Refinancings D) Home Improvement Loans E) Loans on Dwellings For 5+ Families F) Non-occupant Loans on Number Average Value Number Average Value Number Average Value Number Average Value Number Average Value Number Average Value
LOANS ORIGINATED 14 $209,143 306 $183,183 113 $139,407 43 $43,163 3 $198,000 27 $137,111 APPLICATIONS APPROVED, NOT ACCEPTED 2 $222,000 37 $156,622 32 $131,969 17 $42,471 0 $0 4 $81,750 APPLICATIONS DENIED 3 $167,000 85 $208,882 87 $137,460 35 $29,057 0 $0 10 $203,800 APPLICATIONS WITHDRAWN 5 $182,200 34 $172,235 57 $117,825 11 $35,364 0 $0 5 $133,200 FILES CLOSED FOR INCOMPLETENESS 1 $231,000 16 $185,875 16 $154,312 4 $81,250 0 $0 4 $167,750
Aggregated Statistics For Year 1999(Based on 1 full and 2 partial tracts) A) FHA, FSA/RHS & VA B) Conventional C) Refinancings D) Home Improvement Loans E) Loans on Dwellings For 5+ Families F) Non-occupant Loans on Number Average Value Number Average Value Number Average Value Number Average Value Number Average Value Number Average Value
LOANS ORIGINATED 25 $187,550 292 $166,797 203 $143,247 33 $37,624 6 $342,463 34 $138,683 APPLICATIONS APPROVED, NOT ACCEPTED 1 $206,130 31 $175,427 43 $122,791 8 $17,012 0 $0 4 $107,925 APPLICATIONS DENIED 5 $170,580 63 $173,460 79 $115,771 39 $41,426 3 $197,623 23 $111,359 APPLICATIONS WITHDRAWN 4 $217,870 30 $194,954 56 $132,529 10 $33,758 0 $0 6 $179,712 FILES CLOSED FOR INCOMPLETENESS 1 $80,780 12 $169,298 19 $128,808 3 $23,517 0 $0 2 $124,220
Detailed HMDA statistics for the following Tracts:
0061.00
, 0062.00 , 0063.00
Private Mortgage Insurance Companies Aggregated Statistics For Year 2009(Based on 3 full tracts) A) Conventional B) Refinancings Number Average Value Number Average Value
LOANS ORIGINATED 10 $346,700 5 $340,200 APPLICATIONS APPROVED, NOT ACCEPTED 6 $311,000 4 $304,750 APPLICATIONS DENIED 4 $388,250 10 $317,100 APPLICATIONS WITHDRAWN 2 $235,000 0 $0 FILES CLOSED FOR INCOMPLETENESS 0 $0 0 $0
Aggregated Statistics For Year 2008(Based on 3 full tracts) A) Conventional B) Refinancings C) Non-occupant Loans on Number Average Value Number Average Value Number Average Value
LOANS ORIGINATED 33 $349,424 10 $337,900 0 $0 APPLICATIONS APPROVED, NOT ACCEPTED 11 $365,364 9 $419,000 0 $0 APPLICATIONS DENIED 7 $269,143 2 $468,000 2 $365,000 APPLICATIONS WITHDRAWN 5 $283,800 0 $0 0 $0 FILES CLOSED FOR INCOMPLETENESS 0 $0 0 $0 0 $0
Aggregated Statistics For Year 2007(Based on 3 full tracts) A) Conventional B) Refinancings C) Non-occupant Loans on Number Average Value Number Average Value Number Average Value
LOANS ORIGINATED 26 $374,692 10 $450,200 2 $438,000 APPLICATIONS APPROVED, NOT ACCEPTED 4 $401,000 2 $407,500 0 $0 APPLICATIONS DENIED 1 $347,000 0 $0 0 $0 APPLICATIONS WITHDRAWN 2 $314,500 4 $590,500 1 $590,000 FILES CLOSED FOR INCOMPLETENESS 0 $0 0 $0 0 $0
Aggregated Statistics For Year 2006(Based on 3 full tracts) A) Conventional B) Refinancings C) Non-occupant Loans on Number Average Value Number Average Value Number Average Value
LOANS ORIGINATED 22 $347,455 1 $629,000 1 $535,000 APPLICATIONS APPROVED, NOT ACCEPTED 8 $336,875 3 $448,000 0 $0 APPLICATIONS DENIED 0 $0 0 $0 0 $0 APPLICATIONS WITHDRAWN 3 $356,667 0 $0 1 $576,000 FILES CLOSED FOR INCOMPLETENESS 0 $0 0 $0 0 $0
Aggregated Statistics For Year 2005(Based on 3 full tracts) A) Conventional B) Refinancings C) Non-occupant Loans on Number Average Value Number Average Value Number Average Value
LOANS ORIGINATED 31 $346,226 3 $489,667 1 $268,000 APPLICATIONS APPROVED, NOT ACCEPTED 12 $326,167 3 $322,333 1 $369,000 APPLICATIONS DENIED 1 $333,000 0 $0 0 $0 APPLICATIONS WITHDRAWN 5 $283,400 2 $561,000 0 $0 FILES CLOSED FOR INCOMPLETENESS 1 $176,000 0 $0 0 $0
Aggregated Statistics For Year 2004(Based on 3 full tracts) A) Conventional B) Refinancings C) Non-occupant Loans on Number Average Value Number Average Value Number Average Value
LOANS ORIGINATED 47 $315,638 7 $276,286 1 $293,000 APPLICATIONS APPROVED, NOT ACCEPTED 15 $385,467 2 $355,500 1 $428,000 APPLICATIONS DENIED 1 $495,000 0 $0 0 $0 APPLICATIONS WITHDRAWN 6 $300,333 0 $0 0 $0 FILES CLOSED FOR INCOMPLETENESS 4 $351,500 0 $0 1 $383,000
Aggregated Statistics For Year 2003(Based on 3 full tracts) A) Conventional B) Refinancings C) Non-occupant Loans on Number Average Value Number Average Value Number Average Value
LOANS ORIGINATED 69 $281,594 14 $247,786 5 $335,600 APPLICATIONS APPROVED, NOT ACCEPTED 13 $303,692 6 $309,167 0 $0 APPLICATIONS DENIED 1 $252,000 1 $195,000 0 $0 APPLICATIONS WITHDRAWN 4 $258,500 0 $0 1 $216,000 FILES CLOSED FOR INCOMPLETENESS 0 $0 0 $0 0 $0
Aggregated Statistics For Year 2002(Based on 3 full tracts) A) Conventional B) Refinancings C) Non-occupant Loans on Number Average Value Number Average Value Number Average Value
LOANS ORIGINATED 83 $264,301 13 $273,615 4 $247,000 APPLICATIONS APPROVED, NOT ACCEPTED 18 $266,500 1 $258,000 0 $0 APPLICATIONS DENIED 4 $267,750 0 $0 1 $373,000 APPLICATIONS WITHDRAWN 11 $258,909 1 $236,000 0 $0 FILES CLOSED FOR INCOMPLETENESS 2 $174,500 0 $0 0 $0
Aggregated Statistics For Year 2001(Based on 3 full tracts) A) Conventional B) Refinancings C) Non-occupant Loans on Number Average Value Number Average Value Number Average Value
LOANS ORIGINATED 80 $226,450 17 $196,941 5 $233,800 APPLICATIONS APPROVED, NOT ACCEPTED 10 $288,600 8 $269,000 1 $167,000 APPLICATIONS DENIED 6 $245,000 0 $0 0 $0 APPLICATIONS WITHDRAWN 1 $270,000 0 $0 0 $0 FILES CLOSED FOR INCOMPLETENESS 2 $230,500 0 $0 0 $0
Aggregated Statistics For Year 2000(Based on 3 full tracts) A) Conventional B) Refinancings C) Non-occupant Loans on Number Average Value Number Average Value Number Average Value
LOANS ORIGINATED 75 $190,480 8 $197,625 1 $144,000 APPLICATIONS APPROVED, NOT ACCEPTED 11 $220,091 1 $186,000 1 $86,000 APPLICATIONS DENIED 3 $248,333 0 $0 0 $0 APPLICATIONS WITHDRAWN 0 $0 0 $0 0 $0 FILES CLOSED FOR INCOMPLETENESS 0 $0 0 $0 0 $0
Aggregated Statistics For Year 1999(Based on 1 full and 2 partial tracts) A) Conventional B) Refinancings C) Non-occupant Loans on Number Average Value Number Average Value Number Average Value
LOANS ORIGINATED 85 $175,506 16 $162,638 10 $109,116 APPLICATIONS APPROVED, NOT ACCEPTED 10 $155,740 5 $126,918 3 $80,643 APPLICATIONS DENIED 14 $243,716 0 $0 2 $80,640 APPLICATIONS WITHDRAWN 2 $151,545 0 $0 1 $80,640 FILES CLOSED FOR INCOMPLETENESS 4 $187,705 0 $0 1 $221,910
Detailed PMIC statistics for the following Tracts:
0061.00
, 0062.00 , 0063.00 Cliffside Park compared to New Jersey state average:
Unemployed percentage significantly below state average. Black race population percentage significantly below state average. Hispanic race population percentage above state average. Foreign-born population percentage significantly above state average. Number of rooms per house below state average. Cliffside Park on our top lists :
#5 on the list of "Top 101 cities with the most people taking a bus, a trolley bus, a streetcar, or a trolley car to work (population 5,000+)"
#12 on the list of "Top 101 cities with the highest housing density (population 2,000+)"
#26 on the list of "Top 101 cities with the most residents born in Other Western Europe (population 500+)"
#26 on the list of "Top 101 cities with the most residents born in Turkey (population 500+)"
#32 on the list of "Top 101 cities with the most people taking a ferryboat to work (population 5,000+)"
#81 on the list of "Top 101 cities with the most residents born in Russia (population 500+)"
#84 on the list of "Top 101 cities with the most residents born in Other Eastern Europe (population 500+)"
#85 on the list of "Top 101 cities with the most residents born in Korea (population 500+)"
#85 on the list of "Top 101 cities with the most residents born in Other Western Asia (population 500+)"
#90 on the list of "Top 101 cities with the most residents born in Western Asia (population 500+)"
#96 on the list of "Top 101 cities with the most residents born in Europe (population 500+)"
#99 on the list of "Top 101 cities with the most residents born in Eastern Europe (population 500+)"
#99 on the list of "Top 101 cities with the most residents born in Dominican Republic (population 500+)"
#62 (07010) on the list of "Top 101 zip codes with the largest percentage of Greek first ancestries (pop 5,000+)"
#81 (07010) on the list of "Top 101 zip codes with the largest percentage of Arab first ancestries (pop 5,000+)"
#90 (07010) on the list of "Top 101 zip codes with the largest percentage of Russian first ancestries (pop 5,000+)"
#11 on the list of "Top 101 counties with the largest number of people without health insurance coverage in 2000 (pop. 50,000+)"
#11 on the list of "Top 101 counties with the most Orthodox adherents"
#14 on the list of "Top 101 counties with the lowest number of infant deaths per 1000 residents 2007-2013 (pop. 50,000+)"
#16 on the list of "Top 101 counties with the most Orthodox congregations"
#19 on the list of "Top 101 counties with the most Mainline Protestant congregations"
Top Patent Applicants
Randice Lisa Altschul (22)
Pratik P. Joshi (9)
Mehmet C. Oz (6)
Shuren Ma (4)
Malini Chakrabarti (4)
Myriam Lopez (3)
Eun-Sol Kim (3)
Jamieson W. Crawford (3)
Jamieson Crawford (2)
Joze Bevk (2)
Total of 112 patent applications in 2008-2024.


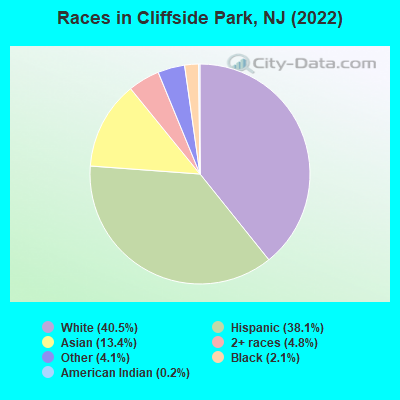
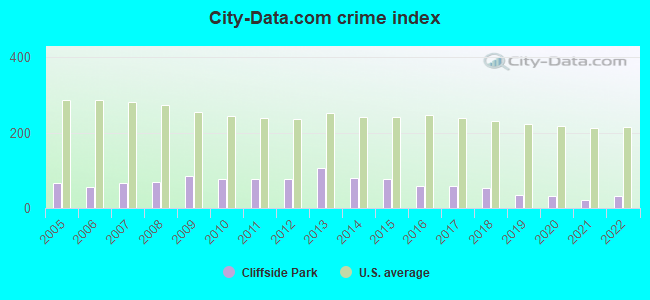
 Recent articles from our blog. Our writers, many of them Ph.D. graduates or candidates, create easy-to-read articles on a wide variety of topics.

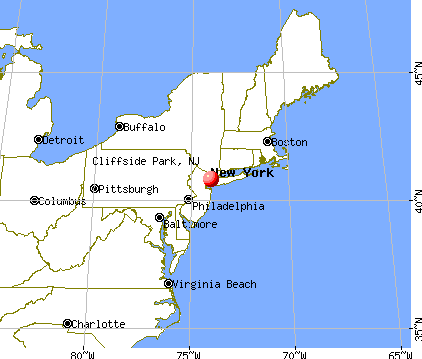
 (3.7 miles
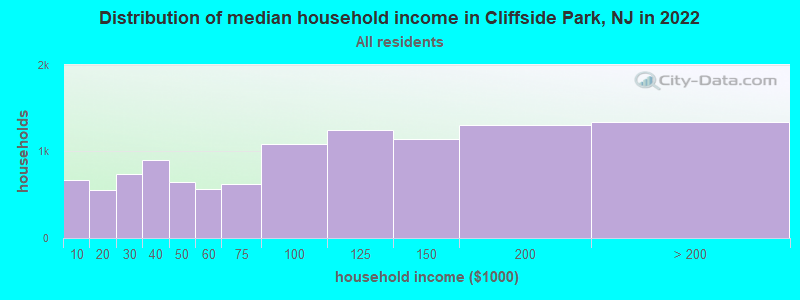
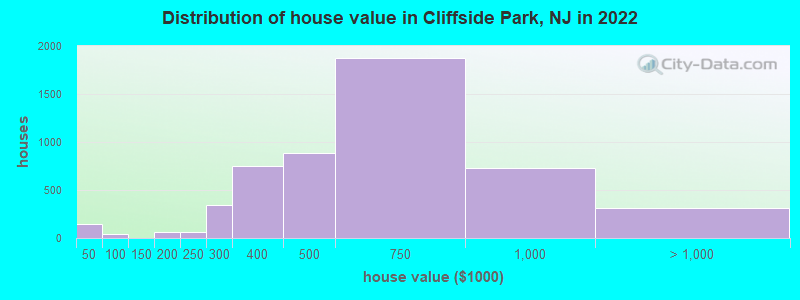
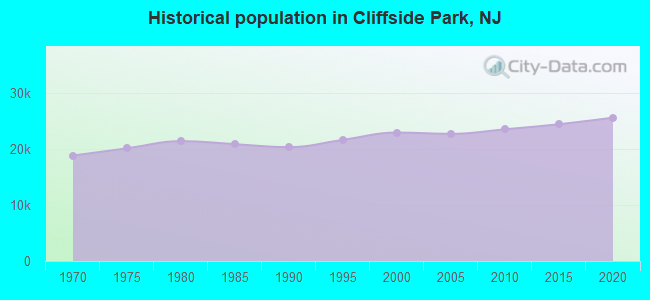
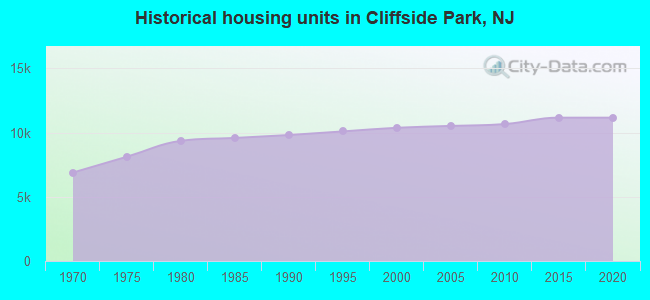
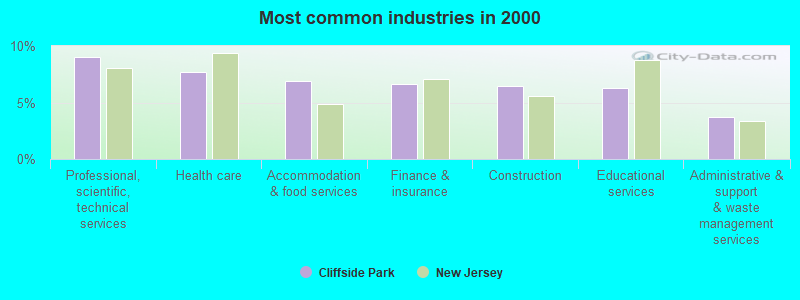
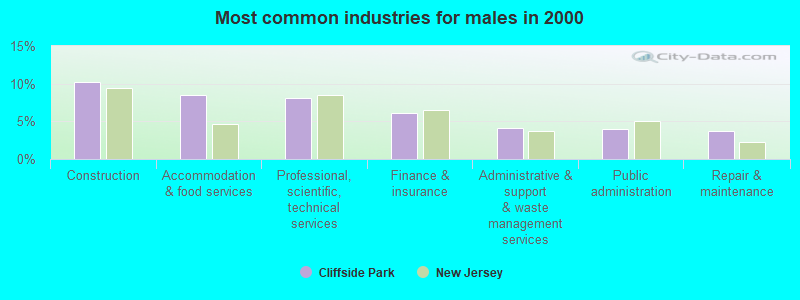
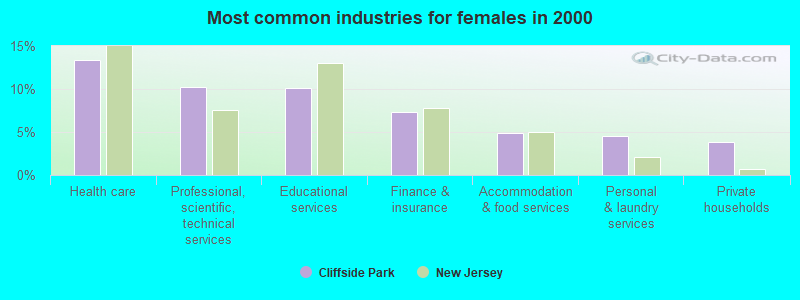
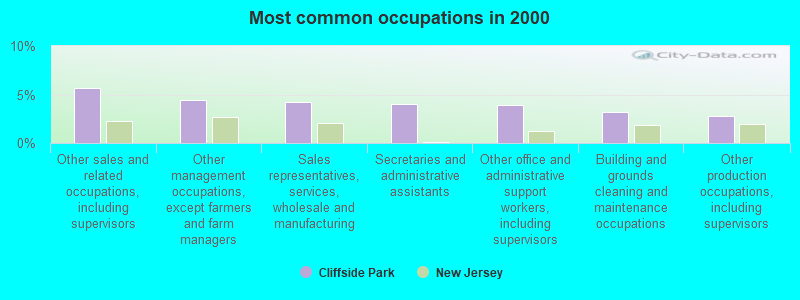
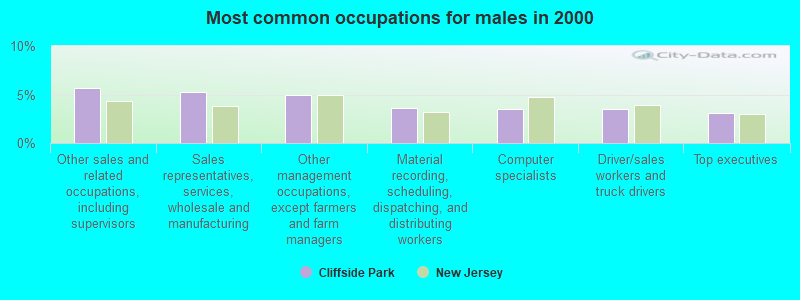
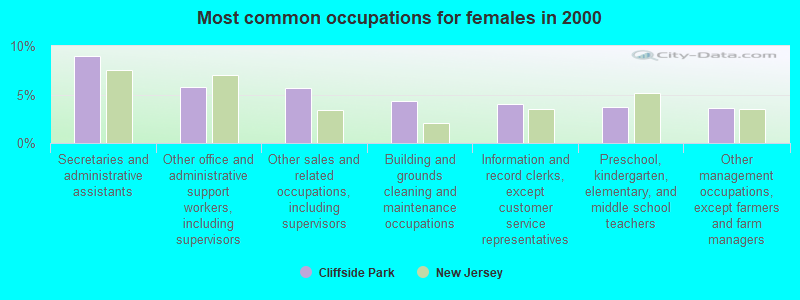
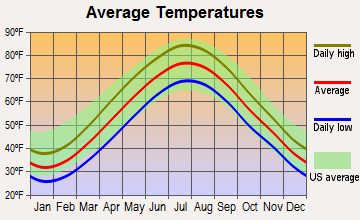
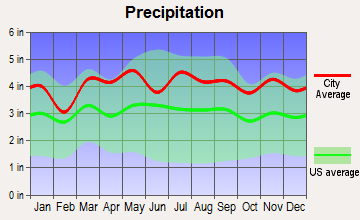
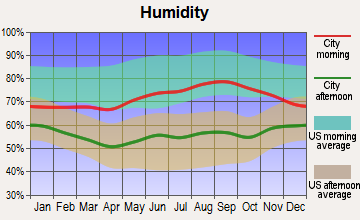
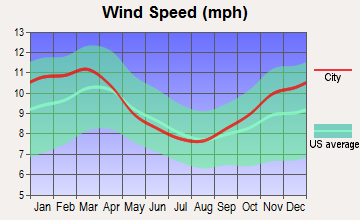
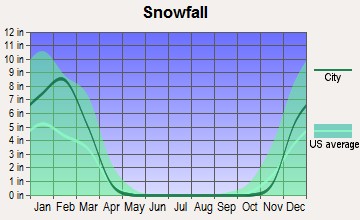
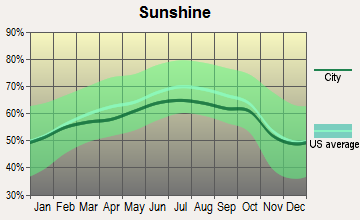
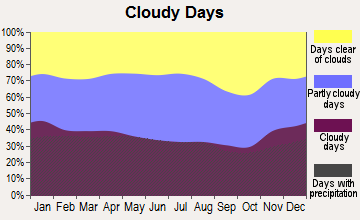


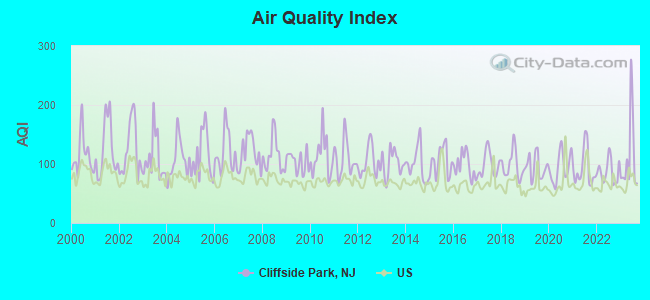
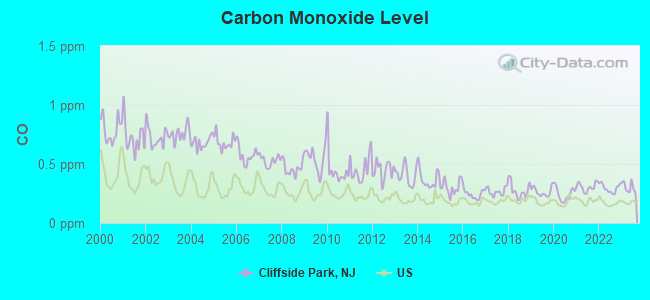
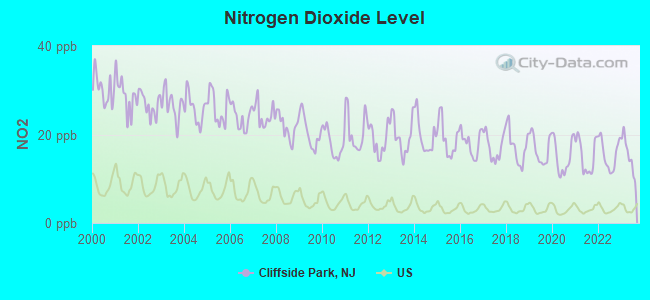
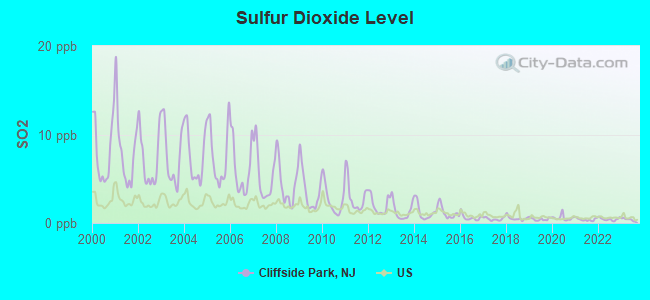
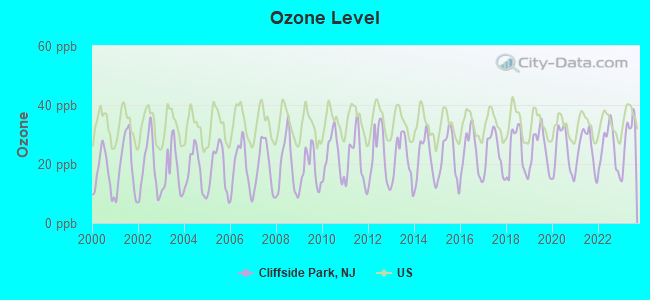
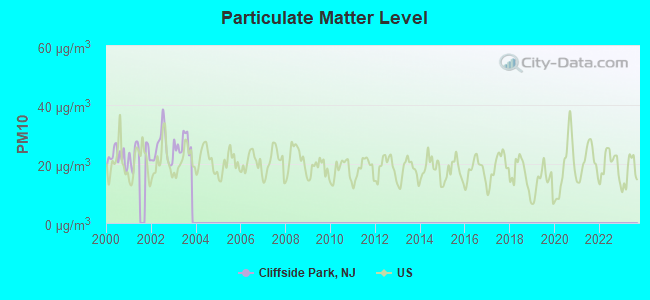
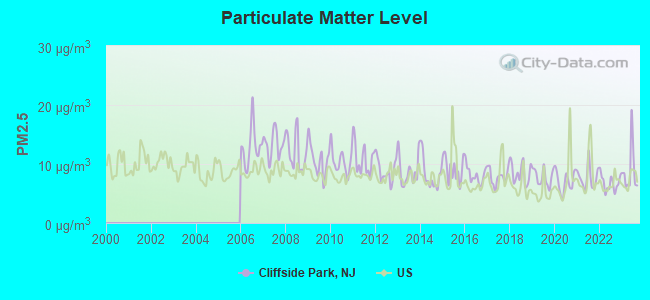
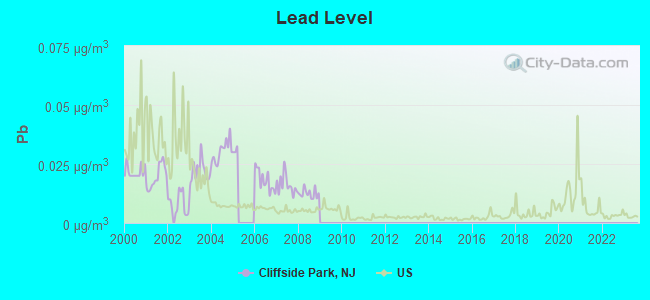
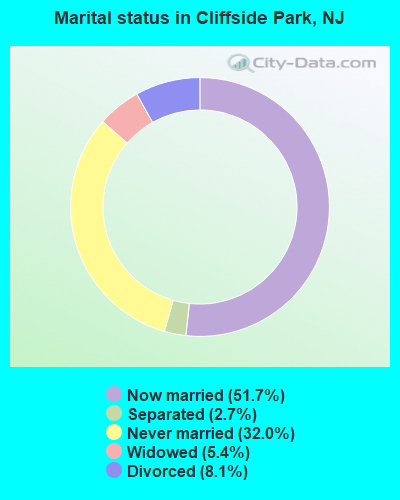
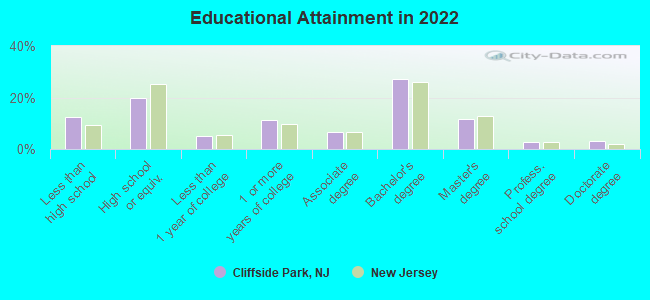
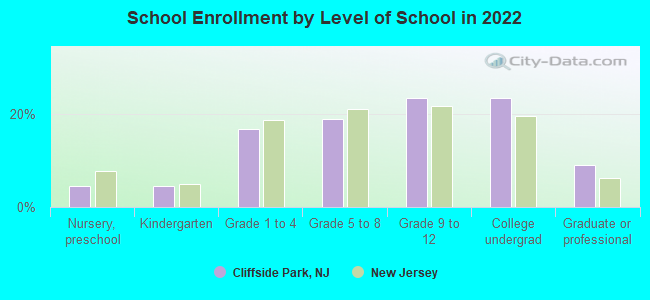
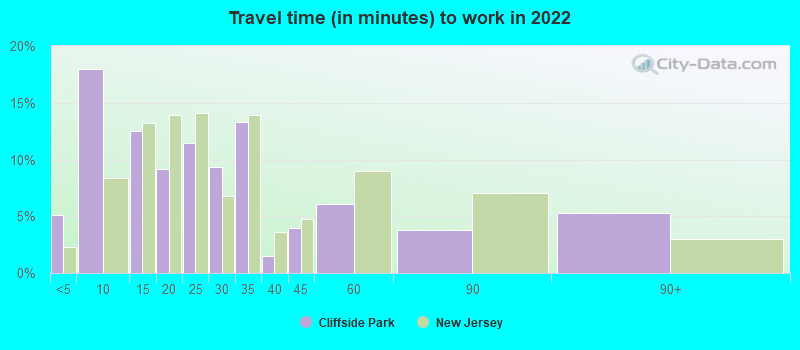
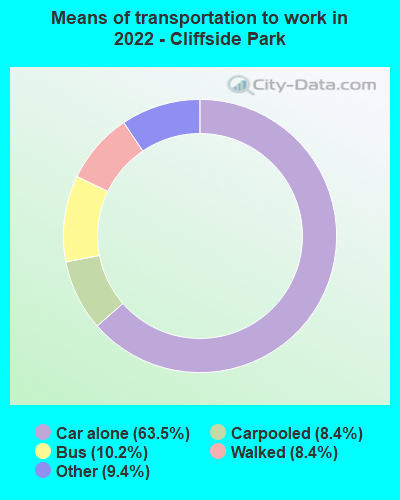
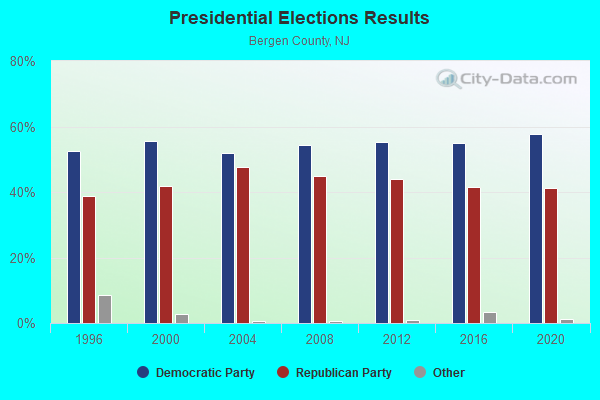
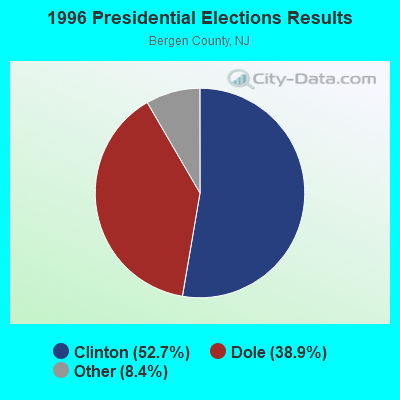
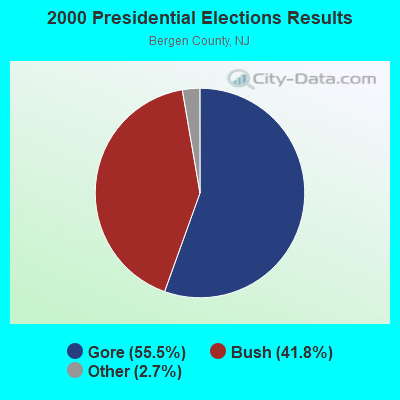
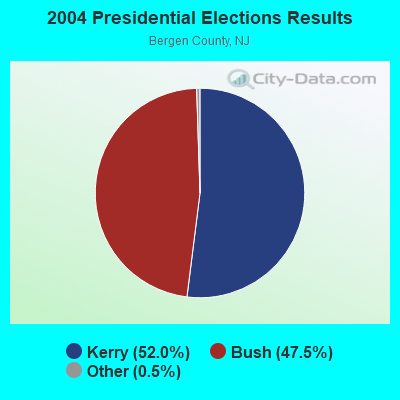
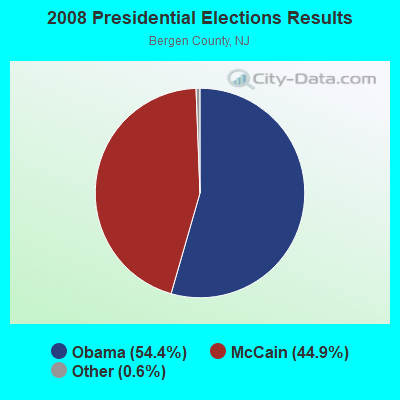


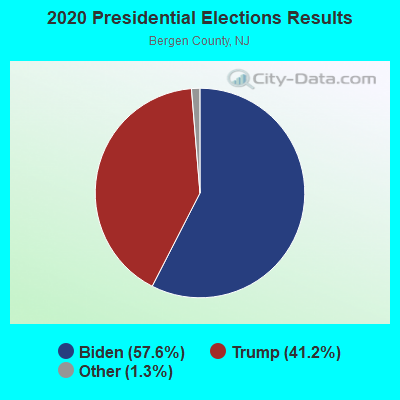
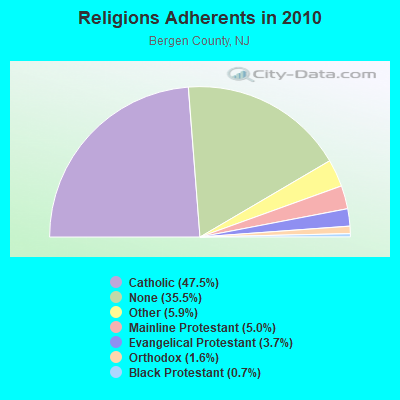
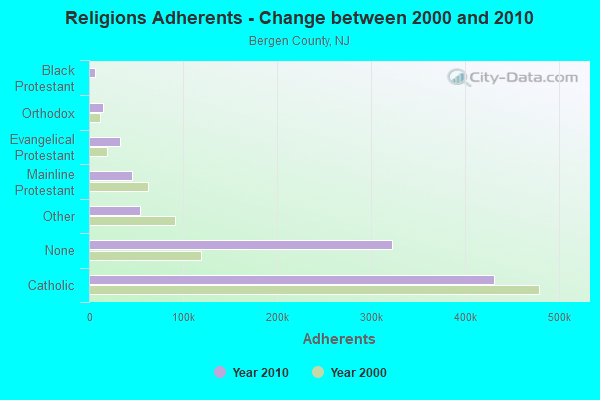
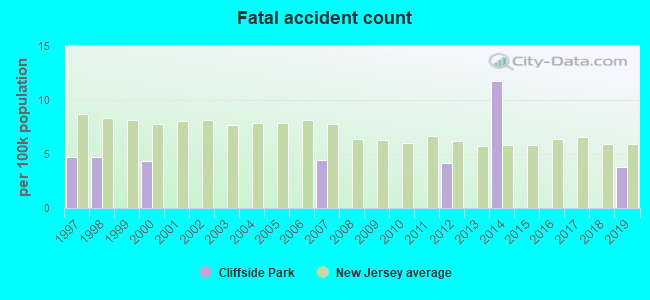
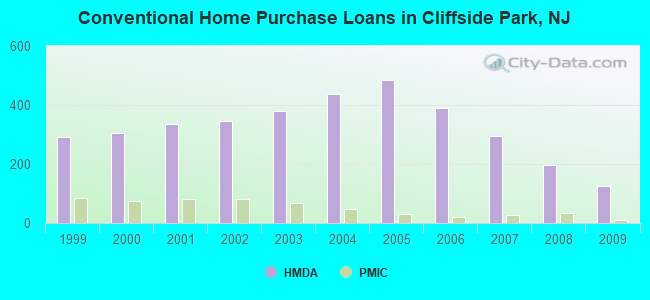
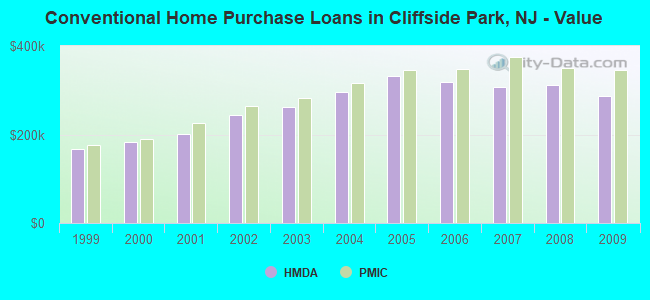
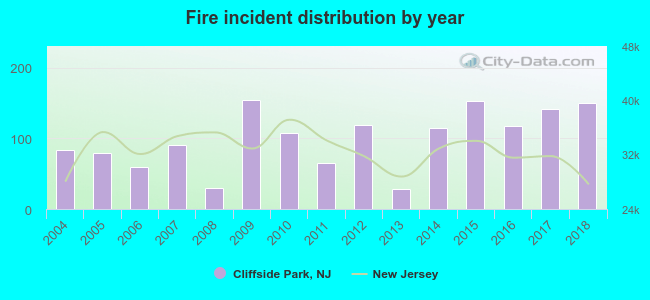 According to the data from the years 2004 - 2018 the average number of fire incidents per year is 100. The highest number of reported fires - 154 took place in 2009, and the least - 29 in 2013. The data has a rising trend.
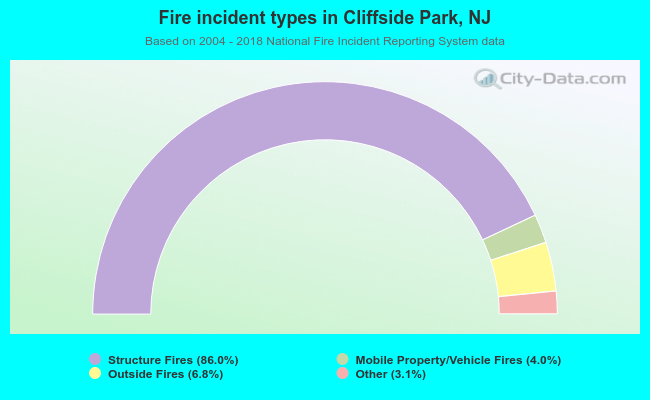 When looking into fire subcategories, the most incidents belonged to: Structure Fires (86.0%), and Outside Fires (6.8%).