Fruita, Colorado
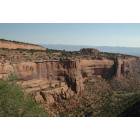
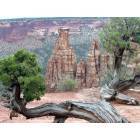
Fruita: Colorado National Monument
Fruita: Colorado National Monument
Fruita: Colorado National Monument
Fruita: Colorado National Monument

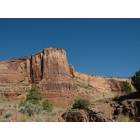
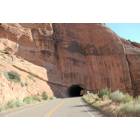
Fruita: Monument CO October 2005
Fruita: Monument CO October 2005
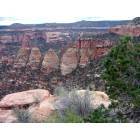
Fruita: Monument CO October 2005
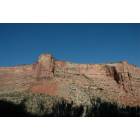
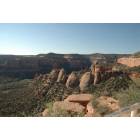
Fruita: Colorado National Monument
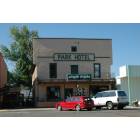
Fruita: hotel
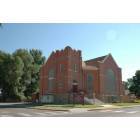
Fruita: Church, UMC
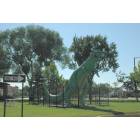
Fruita: Dinosaur
- see
23
more - add
your
Submit your own pictures of this city and show them to the world
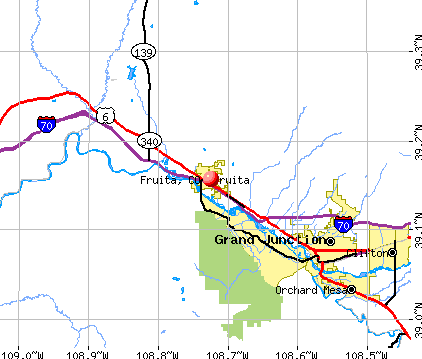
- OSM Map
- General Map
- Google Map
- MSN Map
Population change since 2000: +112.4%
| Males: 6,395 | |
| Females: 7,365 |
| Median resident age: | 41.4 years |
| Colorado median age: | 37.7 years |
Zip codes: 81507, 81521, 81524.
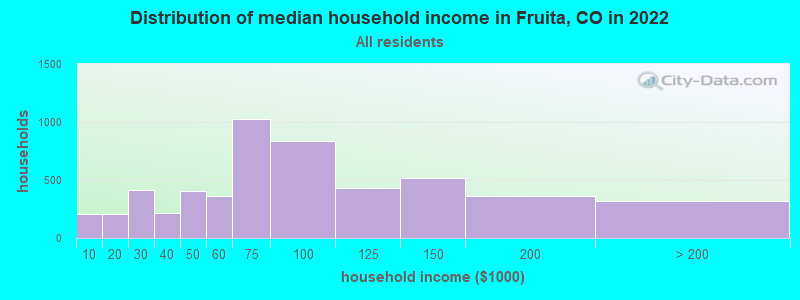
Fruita Zip Code Map| Fruita: | $74,318 |
| CO: | $89,302 |
Estimated per capita income in 2022: $34,776 (it was $16,024 in 2000)
Fruita city income, earnings, and wages data
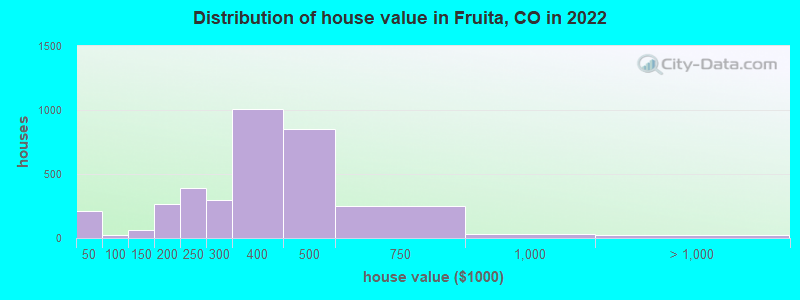
Estimated median house or condo value in 2022: $396,321 (it was $101,600 in 2000)
| Fruita: | $396,321 |
| CO: | $531,100 |
Mean prices in 2022: all housing units: $328,851; detached houses: $346,846; townhouses or other attached units: $292,057; mobile homes: $149,368
Median gross rent in 2022: $1,502.
(4.2% for White Non-Hispanic residents, 11.1% for Hispanic or Latino residents, 59.7% for American Indian residents)
Detailed information about poverty and poor residents in Fruita, CO


Compare current foreclosures near Fruita, CO:
| Photo | Address | Area | Beds / Baths | Price | Details |
|---|---|---|---|---|---|

|
#1
Aquarius Ave
Fruita, CO 81521
|
1,200 sq. feet
|
1 baths 3 beds |
show details | |

|
#2
Laura Ave
Fruita, CO 81521
|
2,095 sq. feet
|
2 baths 5 beds |
show details | |

|
#3
W Meadow Ave
Fruita, CO 81521
|
1,595 sq. feet
|
2 baths 3 beds |
show details | |

|
#4
Wimberly Dr
Fruita, CO 81521
|
1,659 sq. feet
|
2 baths 3 beds |
show details | |

|
#5
Wimberly Dr
Fruita, CO 81521
|
1,659 sq. feet
|
2 baths 3 beds |
show details | |

|
#6
Amethyst Dr
Fruita, CO 81521
|
1,666 sq. feet
|
2 baths 4 beds |
show details | |

|
#7
Virgo Way
Fruita, CO 81521
|
1,232 sq. feet
|
2 baths 3 beds |
show details | |

|
#8
Park St
Fruita, CO 81521
|
1,348 sq. feet
|
2 baths 3 beds |
show details | |

|
#9
Elderberry Dr
Fruita, CO 81521
|
1,857 sq. feet
|
2 baths 3 beds |
show details | |

|
#10
Libra Ct
Fruita, CO 81521
|
960 sq. feet
|
2 baths 2 beds |
show details |
| Photo | Address | Area | Beds / Baths | Price | Details |
|---|---|---|---|---|---|

|
#11
Primrose Ln
Fruita, CO 81521
|
1,244 sq. feet
|
2 baths 2 beds |
show details | |

|
#12
Leo Ave
Fruita, CO 81521
|
1,028 sq. feet
|
2 baths 3 beds |
show details | |

|
#13
Sunflower Ave
Fruita, CO 81521
|
1,619 sq. feet
|
2 baths 3 beds |
show details | |

|
#14
Libra Ct
Fruita, CO 81521
|
1,568 sq. feet
|
2 baths 3 beds |
show details | |

|
#15
21 Rd
Fruita, CO 81521
|
960 sq. feet
|
1 baths 3 beds |
show details | |

|
#16
La Mesa Ln
Fruita, CO 81521
|
2,605 sq. feet
|
2 baths 3 beds |
show details | |

|
#17
Ponderosa Dr
Fruita, CO 81521
|
1,478 sq. feet
|
2 baths 3 beds |
show details | |

|
#18
E Concord Dr
Fruita, CO 81521
|
1,172 sq. feet
|
1 baths 3 beds |
show details | |

|
#19
N Peach Way
Fruita, CO 81521
|
1,508 sq. feet
|
1 baths 3 beds |
show details | |

|
#20
Wimberly Dr
Fruita, CO 81521
|
1,659 sq. feet
|
2 baths 3 beds |
show details |
| Photo | Address | Area | Beds / Baths | Price | Details |
|---|---|---|---|---|---|

|
#21
Elberta Dr
Fruita, CO 81521
|
2,429 sq. feet
|
3 baths 4 beds |
show details | |

|
#22
E Harrison Ave
Fruita, CO 81521
|
1,200 sq. feet
|
1 baths 2 beds |
show details | |

|
#23
I 3/10 Rd
Fruita, CO 81521
|
- sq. feet
|
- baths - beds |
show details | |

|
#24
Wolf Creek Ct
Fruita, CO 81521
|
- sq. feet
|
- baths - beds |
show details | |

|
#25
Elderberry Dr
Fruita, CO 81521
|
- sq. feet
|
- baths - beds |
show details | |

|
#26
Powis Ln
Fruita, CO 81521
|
- sq. feet
|
- baths - beds |
show details | |

|
#27
Satterfield Ave
Fruita, CO 81521
|
- sq. feet
|
- baths - beds |
show details | |

|
#28
E Good Hope Cir Apt C
Clifton, CO 81520
|
1,266 sq. feet
|
1 baths 3 beds |
show details | |

|
#29
Chickadee Ct
Grand Junction, CO 81504
|
938 sq. feet
|
2 baths 2 beds |
show details | |

|
#30
Shelley Dr
Grand Junction, CO 81503
|
1,456 sq. feet
|
1 baths 3 beds |
show details |
| Photo | Address | Area | Beds / Baths | Price | Details |
|---|---|---|---|---|---|

|
#31
Glendale Way
Grand Junction, CO 81504
|
1,128 sq. feet
|
1 baths 3 beds |
show details | |

|
#32
1/2 Brooks Ct
Grand Junction, CO 81504
|
1,674 sq. feet
|
2 baths 3 beds |
show details | |

|
#33
1/2 Saxon Ct
Grand Junction, CO 81504
|
1,100 sq. feet
|
1 baths 3 beds |
show details | |

|
#34
Highview Rd
Clifton, CO 81520
|
1,128 sq. feet
|
2 baths 3 beds |
show details | |

|
#35
Susan St
Clifton, CO 81520
|
1,248 sq. feet
|
1 baths 4 beds |
show details | |

|
#36
Duke Dr
Grand Junction, CO 81501
|
1,436 sq. feet
|
2 baths 3 beds |
show details | |

|
#37
Red Maple Ct
Clifton, CO 81520
|
1,429 sq. feet
|
1 baths 3 beds |
show details | |

|
#38
Ash Dr
Grand Junction, CO 81506
|
1,714 sq. feet
|
2 baths 4 beds |
show details | |

|
#39
Garland Ct
Clifton, CO 81520
|
836 sq. feet
|
1 baths 3 beds |
show details | |

|
#40
Fire Willow St
Grand Junction, CO 81504
|
1,216 sq. feet
|
1 baths 3 beds |
show details |
| Photo | Address | Area | Beds / Baths | Price | Details |
|---|---|---|---|---|---|

|
#41
Garland St
Clifton, CO 81520
|
1,332 sq. feet
|
1 baths 3 beds |
show details | |

|
#42
D 1/4 Rd
Clifton, CO 81520
|
884 sq. feet
|
1 baths 2 beds |
show details | |

|
#43
N Grandby Ct
Clifton, CO 81520
|
1,048 sq. feet
|
1 baths 3 beds |
show details | |

|
#44
31 34 Road
Grand Junction, CO 81504
|
2,063 sq. feet
|
2 baths 3 beds |
show details | |

|
#45
E Parkview Dr
Grand Junction, CO 81503
|
2,113 sq. feet
|
1 baths 5 beds |
show details | |

|
#46
Unaweep Ave
Grand Junction, CO 81503
|
859 sq. feet
|
1 baths 2 beds |
show details | |

|
#47
Bowstring Dr
Clifton, CO 81520
|
994 sq. feet
|
1 baths 3 beds |
show details | |

|
#48
S Placer Ct
Grand Junction, CO 81504
|
1,248 sq. feet
|
2 baths 3 beds |
show details | |

|
#49
Sequel Way
Grand Junction, CO 81504
|
1,345 sq. feet
|
2 baths 3 beds |
show details | |

|
Check over 1 million property listings on Foreclosure.com!
|
browse all offers | |||


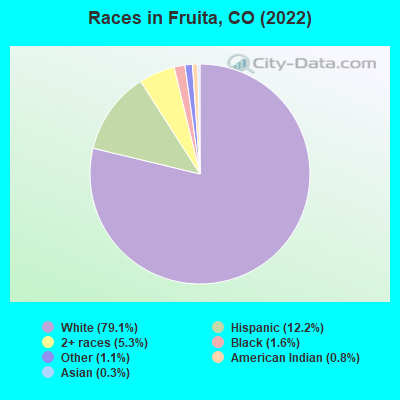
- 10,82079.1%White alone
- 1,66412.2%Hispanic
- 7215.3%Two or more races
- 2151.6%Black alone
- 1491.1%Other race alone
- 1090.8%American Indian alone
- 360.3%Asian alone
According to our research of Colorado and other state lists, there were 35 registered sex offenders living in Fruita, Colorado as of May 19, 2024.
The ratio of all residents to sex offenders in Fruita is 370 to 1.
The ratio of registered sex offenders to all residents in this city is near the state average.
Type |
2009 |
2010 |
2011 |
2012 |
2013 |
2014 |
2015 |
2016 |
2017 |
2018 |
2019 |
2020 |
2021 |
2022 |
|---|---|---|---|---|---|---|---|---|---|---|---|---|---|---|
| Murders (per 100,000) | 0 (0.0) | 1 (7.9) | 0 (0.0) | 0 (0.0) | 0 (0.0) | 0 (0.0) | 1 (7.8) | 0 (0.0) | 0 (0.0) | 0 (0.0) | 1 (7.4) | 0 (0.0) | 0 (0.0) | 0 (0.0) |
| Rapes (per 100,000) | 6 (80.0) | 5 (39.5) | 5 (38.9) | 2 (15.6) | 11 (86.5) | 3 (23.5) | 4 (31.3) | 4 (31.2) | 6 (46.3) | 5 (37.3) | 4 (29.6) | 3 (22.1) | 5 (34.6) | 17 (124.7) |
| Robberies (per 100,000) | 3 (40.0) | 1 (7.9) | 1 (7.8) | 2 (15.6) | 2 (15.7) | 2 (15.7) | 3 (23.5) | 3 (23.4) | 4 (30.8) | 2 (14.9) | 1 (7.4) | 5 (36.8) | 2 (13.8) | 2 (14.7) |
| Assaults (per 100,000) | 6 (80.0) | 5 (39.5) | 11 (85.5) | 14 (108.9) | 7 (55.0) | 16 (125.5) | 14 (109.5) | 9 (70.2) | 16 (123.4) | 21 (156.8) | 17 (125.9) | 9 (66.3) | 22 (152.1) | 13 (95.4) |
| Burglaries (per 100,000) | 60 (799.9) | 52 (411.2) | 34 (264.3) | 38 (295.7) | 34 (267.2) | 42 (329.5) | 49 (383.1) | 49 (382.1) | 33 (254.4) | 51 (380.9) | 24 (177.7) | 21 (154.7) | 14 (96.8) | 21 (154.0) |
| Thefts (per 100,000) | 213 (2,840) | 215 (1,700) | 152 (1,181) | 195 (1,517) | 158 (1,242) | 164 (1,287) | 167 (1,306) | 134 (1,045) | 134 (1,033) | 159 (1,187) | 174 (1,289) | 124 (913.5) | 126 (871.1) | 114 (836.3) |
| Auto thefts (per 100,000) | 8 (106.7) | 8 (63.3) | 12 (93.3) | 13 (101.2) | 9 (70.7) | 9 (70.6) | 6 (46.9) | 1 (7.8) | 5 (38.5) | 7 (52.3) | 10 (74.1) | 12 (88.4) | 10 (69.1) | 6 (44.0) |
| Arson (per 100,000) | 1 (13.3) | 9 (71.2) | 3 (23.3) | 1 (7.8) | 2 (15.7) | 4 (31.4) | 4 (31.3) | 7 (54.6) | 2 (15.4) | 3 (22.4) | 2 (14.8) | 4 (29.5) | 4 (27.7) | 6 (44.0) |
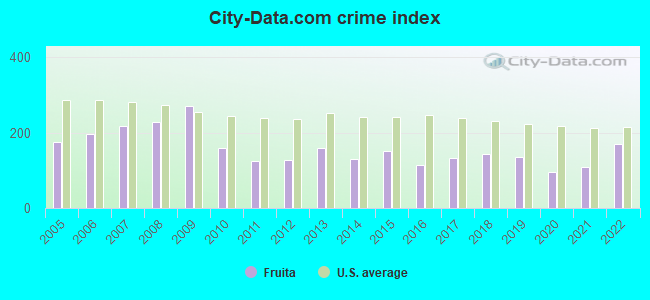
| City-Data.com crime index | 270.1 | 159.6 | 123.7 | 128.4 | 158.9 | 128.8 | 152.4 | 115.2 | 133.1 | 144.1 | 135.8 | 96.4 | 109.4 | 171.0 |
The City-Data.com crime index weighs serious crimes and violent crimes more heavily. Higher means more crime, U.S. average is 246.1. It adjusts for the number of visitors and daily workers commuting into cities.
Crime rate in Fruita detailed stats: murders, rapes, robberies, assaults, burglaries, thefts, arson
Full-time law enforcement employees in 2021, including police officers: 22 (18 officers - 16 male; 2 female).
| Officers per 1,000 residents here: | 1.24 |
| Colorado average: | 2.14 |
 Recent articles from our blog. Our writers, many of them Ph.D. graduates or candidates, create easy-to-read articles on a wide variety of topics.


Latest news from Fruita, CO collected exclusively by city-data.com from local newspapers, TV, and radio stations
Ancestries: German (18.0%), American (11.4%), Italian (9.6%), English (8.2%), Irish (7.4%), European (3.7%).
Current Local Time: MST time zone
Incorporated on 4/18/1894
Elevation: 4503 feet
Land area: 5.94 square miles.
Population density: 2,317 people per square mile (low).
64 residents are foreign born
| This city: | 0.5% |
| Colorado: | 9.5% |
Median real estate property taxes paid for housing units with mortgages in 2022: $1,607 (0.4%)
Median real estate property taxes paid for housing units with no mortgage in 2022: $1,362 (0.4%)
Nearest city with pop. 50,000+: Provo, UT  (173.4 miles , pop. 105,166).
Nearest city with pop. 200,000+: Northeast Jefferson, CO (197.4 miles , pop. 450,166).
Nearest city with pop. 1,000,000+: Phoenix, AZ (431.7 miles , pop. 1,321,045).
Nearest cities:
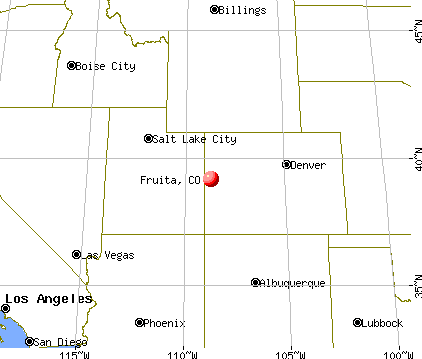
), ), ), )Latitude: 39.16 N, Longitude: 108.72 W
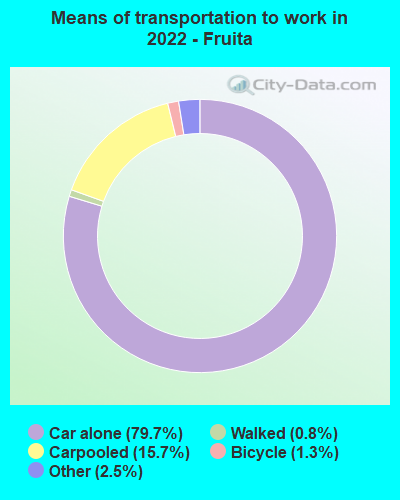
Daytime population change due to commuting: -2,828 (-20.7%)
Workers who live and work in this city: 1,496 (23.0%)
Area code: 970

Fruita tourist attractions:
Fruita, Colorado accommodation & food services, waste management - Economy and Business Data
| Here: | 3.5% |
| Colorado: | 3.2% |
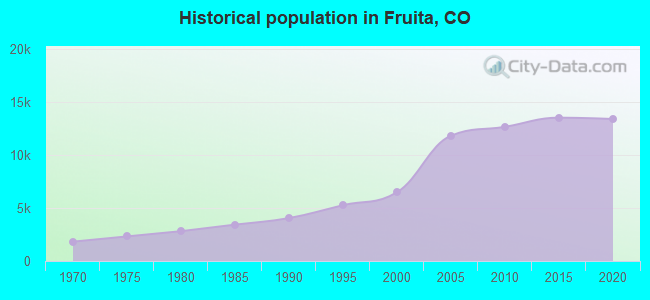
Population change in the 1990s: +2,108 (+48.2%).
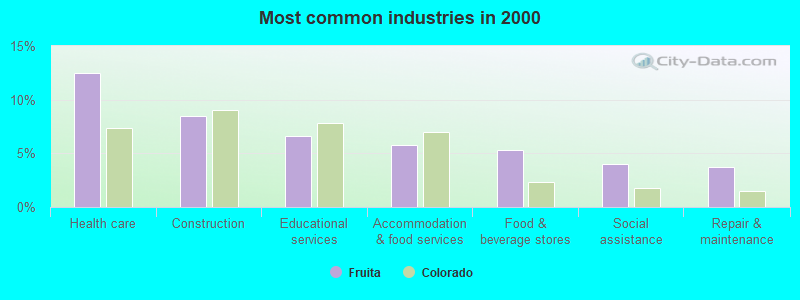
- Health care (12.5%)
- Construction (8.5%)
- Educational services (6.6%)
- Accommodation & food services (5.8%)
- Food & beverage stores (5.3%)
- Social assistance (4.0%)
- Repair & maintenance (3.8%)
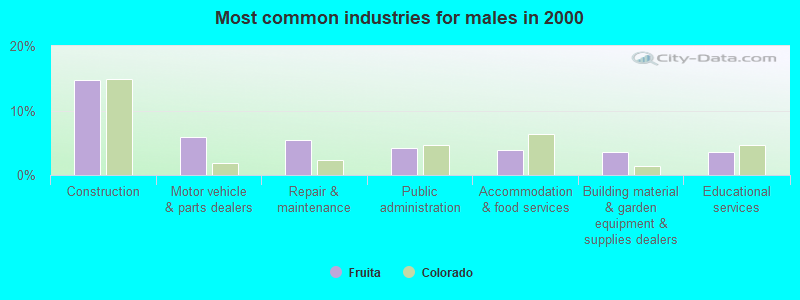
- Construction (14.7%)
- Motor vehicle & parts dealers (6.0%)
- Repair & maintenance (5.4%)
- Public administration (4.2%)
- Accommodation & food services (3.9%)
- Building material & garden equipment & supplies dealers (3.6%)
- Educational services (3.6%)
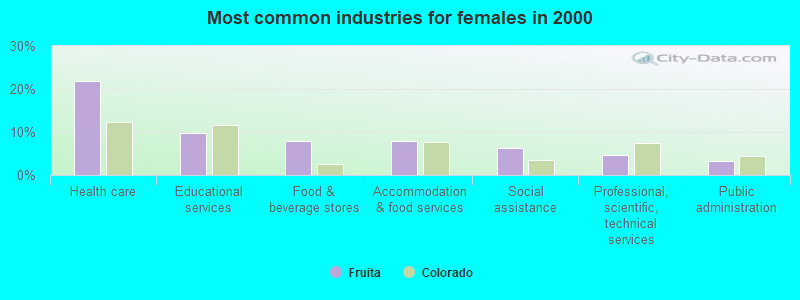
- Health care (21.9%)
- Educational services (9.7%)
- Food & beverage stores (7.9%)
- Accommodation & food services (7.8%)
- Social assistance (6.4%)
- Professional, scientific, technical services (4.8%)
- Public administration (3.2%)
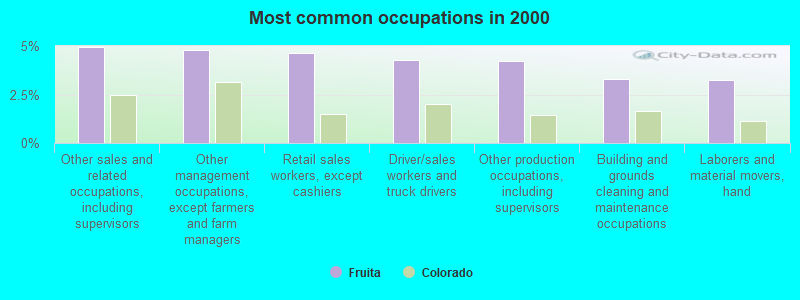
- Other sales and related occupations, including supervisors (5.0%)
- Other management occupations, except farmers and farm managers (4.8%)
- Retail sales workers, except cashiers (4.6%)
- Driver/sales workers and truck drivers (4.3%)
- Other production occupations, including supervisors (4.2%)
- Building and grounds cleaning and maintenance occupations (3.3%)
- Laborers and material movers, hand (3.2%)
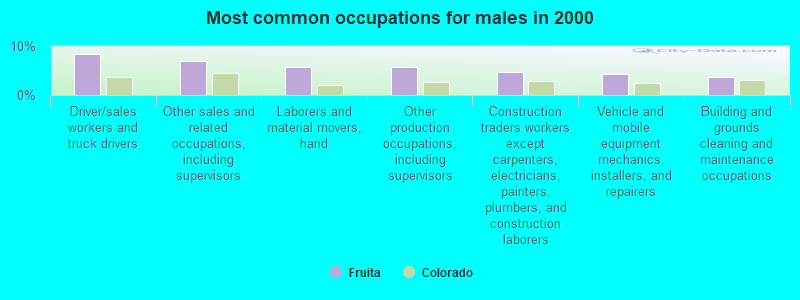
- Driver/sales workers and truck drivers (8.3%)
- Other sales and related occupations, including supervisors (7.0%)
- Laborers and material movers, hand (5.8%)
- Other production occupations, including supervisors (5.7%)
- Construction traders workers except carpenters, electricians, painters, plumbers, and construction laborers (4.7%)
- Vehicle and mobile equipment mechanics, installers, and repairers (4.3%)
- Building and grounds cleaning and maintenance occupations (3.8%)
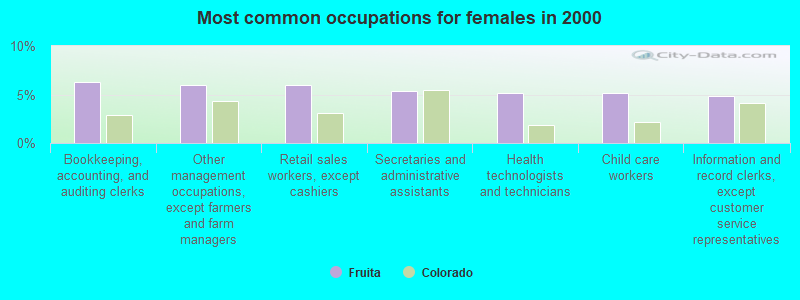
- Bookkeeping, accounting, and auditing clerks (6.2%)
- Other management occupations, except farmers and farm managers (6.0%)
- Retail sales workers, except cashiers (6.0%)
- Secretaries and administrative assistants (5.3%)
- Health technologists and technicians (5.2%)
- Child care workers (5.1%)
- Information and record clerks, except customer service representatives (4.8%)
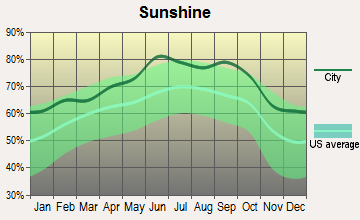
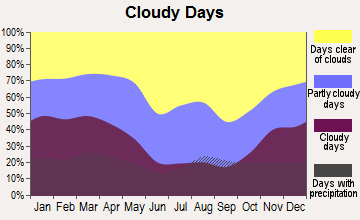
Average climate in Fruita, Colorado
Based on data reported by over 4,000 weather stations


|
|


(lower is better)
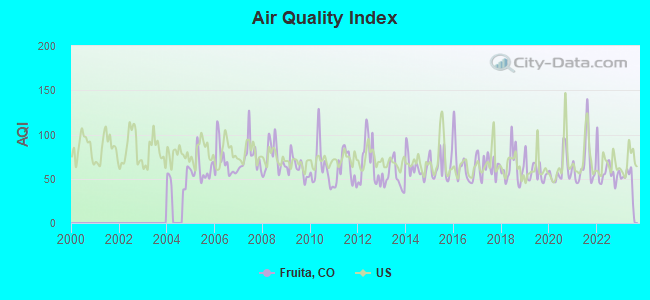
Air Quality Index (AQI) level in 2023 was 50.5. This is significantly better than average.
| City: | 50.5 |
| U.S.: | 72.6 |
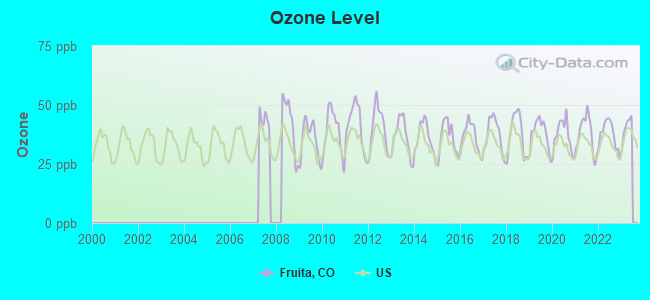
Ozone [ppb] level in 2022 was 37.5. This is about average. Closest monitor was 3.6 miles away from the city center.
| City: | 37.5 |
| U.S.: | 33.3 |
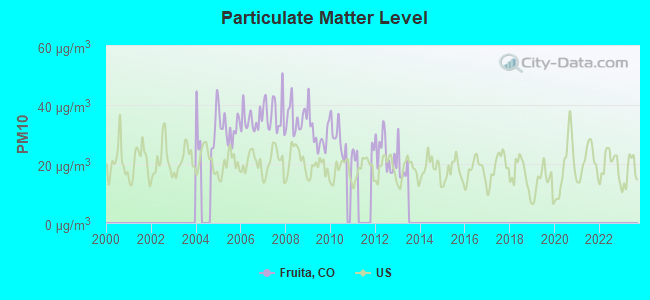
Particulate Matter (PM10) [µg/m3] level in 2012 was 23.4. This is worse than average. Closest monitor was 0.7 miles away from the city center.
| City: | 23.4 |
| U.S.: | 19.2 |
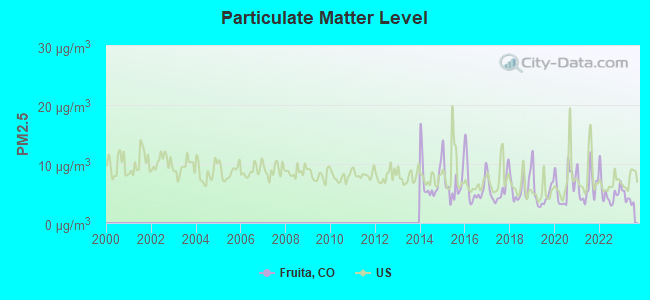
Particulate Matter (PM2.5) [µg/m3] level in 2023 was 4.18. This is significantly better than average. Closest monitor was 9.7 miles away from the city center.
| City: | 4.18 |
| U.S.: | 8.11 |
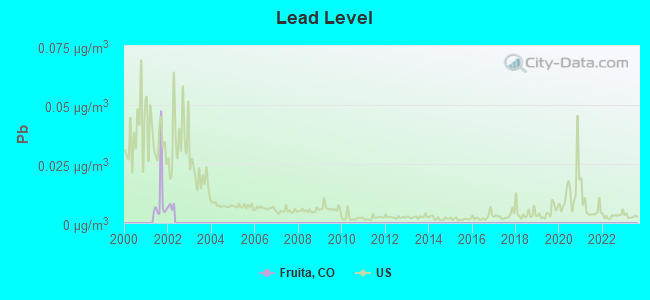
Lead (Pb) [µg/m3] level in 2001 was 0.0105. This is about average. Closest monitor was 0.7 miles away from the city center.
| City: | 0.0105 |
| U.S.: | 0.0093 |
Earthquake activity:
Fruita-area historical earthquake activity is significantly above Colorado state average. It is 1522% greater than the overall U.S. average.On 8/18/1959 at 06:37:13, a magnitude 7.7 (7.7 UK, Class: Major, Intensity: VIII - XII) earthquake occurred 387.1 miles away from Fruita center, causing $26,000,000 total damage
On 10/3/1915 at 06:52:48, a magnitude 7.6 (7.6 UK) earthquake occurred 475.1 miles away from the city center
On 10/28/1983 at 14:06:06, a magnitude 7.3 (6.2 MB, 7.3 MS, 7.0 MW) earthquake occurred 429.6 miles away from the city center, causing 2 deaths (2 shaking deaths) and 3 injuries, causing $15,000,000 total damage
On 3/28/1975 at 02:31:05, a magnitude 6.2 (6.1 MB, 6.0 MS, 6.2 ML, Class: Strong, Intensity: VII - IX) earthquake occurred 278.9 miles away from Fruita center
On 3/18/2020 at 13:09:31, a magnitude 5.7 (5.7 MW, Depth: 7.4 mi, Class: Moderate, Intensity: VI - VII) earthquake occurred 209.2 miles away from Fruita center
On 6/28/1992 at 11:57:34, a magnitude 7.6 (6.2 MB, 7.6 MS, 7.3 MW, Depth: 0.7 mi) earthquake occurred 552.7 miles away from Fruita center, causing 3 deaths (1 shaking deaths, 2 other deaths) and 400 injuries, causing $100,000,000 total damage and $40,000,000 insured losses
Magnitude types: body-wave magnitude (MB), local magnitude (ML), surface-wave magnitude (MS), moment magnitude (MW)
Natural disasters:
The number of natural disasters in Mesa County (6) is a lot smaller than the US average (15).Major Disasters (Presidential) Declared: 2
Emergencies Declared: 2
Causes of natural disasters: Fires: 2, Drought: 1, Flood: 1, Hurricane: 1, Landslide: 1, Mudslide: 1, Storm: 1, Other: 1 (Note: some incidents may be assigned to more than one category).
Hospitals and medical centers in Fruita:
Amtrak station near Fruita:
- 11 miles: GRAND JUNCTION (339 S. 1ST ST.) . Services: ticket office, fully wheelchair accessible, enclosed waiting area, public restrooms, public payphones, full-service food facilities, snack bar, vending machines, free short-term parking, free long-term parking, call for car rental service, call for taxi service.
Colleges/universities with over 2000 students nearest to Fruita:
- Colorado Mesa University (about 12 miles; Grand Junction, CO; Full-time enrollment: 7,671)
- Colorado Mountain College (about 80 miles; Glenwood Springs, CO; FT enrollment: 3,463)
- Western State Colorado University (about 106 miles; Gunnison, CO; FT enrollment: 2,023)
- Fort Lewis College (about 139 miles; Durango, CO; FT enrollment: 3,631)
- Snow College (about 154 miles; Ephraim, UT; FT enrollment: 3,224)
- San Juan College (about 168 miles; Farmington, NM; FT enrollment: 5,112)
- Western Wyoming Community College (about 171 miles; Rock Springs, WY; FT enrollment: 2,086)
Public high schools in Fruita:
- FRUITA MONUMENT HIGH SCHOOL (Students: 1,351, Location: 1102 WILDCAT AVE, Grades: 10-12)
- FRUITA 8/9 SCHOOL (Students: 754, Location: 1835 J ROAD, Grades: 8-9)
Public elementary/middle schools in Fruita:
- RIM ROCK ELEMENTARY SCHOOL (Students: 593, Location: 1810 J 6 ROAD, Grades: PK-5)
- SHELLEDY ELEMENTARY SCHOOL (Students: 569, Location: 353 NORTH MESA, Grades: PK-5)
- FRUITA MIDDLE SCHOOL (Students: 547, Location: 239 N MAPLE, Grades: 6-7)
Points of interest:
Notable location: Lower Valley Fire Protection District Station 1 (A). Display/hide its location on the map
Streams, rivers, and creeks: Adobe Creek (A), Little Salt Wash (B). Display/hide their locations on the map
Tourist attractions: Dinamation International Society-Dinosr Dscvry MSM (Museums; 550 Jurassic Court), Museums - Museum of Western Colorado- Dinosaur Journey (Cultural Attractions- Events- & Facilities; 550 Jurassic Court), Mesa Amusements Inc (Amusement & Theme Parks; 1082 Kiefer Avenue), Colorado Welcome Center (340 Highway 340).
Hotels: H Motel (333 Highway 6 And 50), Comfort Inn of Fruita (400 Jurassic Court), Balanced Rock Motel (126 South Coulson Street), La Quinta Inn and Suites Fruita (570 Raptor Road).
Birthplace of: Daven Harmeling - College basketball player (Washington State Cougars), Jon Rakiecki - College basketball player (Colorado State Rams).
| This city: | 2.6 people |
| Colorado: | 2.5 people |
| This city: | 72.1% |
| Whole state: | 63.9% |
| This city: | 5.5% |
| Whole state: | 6.5% |
Likely homosexual households (counted as self-reported same-sex unmarried-partner households)
- Lesbian couples: 0.3% of all households
- Gay men: 0.1% of all households
12 people in other noninstitutional facilities in 2010
233 people in other noninstitutional group quarters in 2000
Banks with branches in Fruita (2011 data):
- Grand Valley Bank: Fruita Branch at 452 South Maple, branch established on 1995/08/28. Info updated 2009/01/13: Bank assets: $264.2 mil, Deposits: $230.2 mil, headquarters in Heber City, UT, positive income, 7 total offices, Holding Company: Porter Mountain Iii, Lllp
- Alpine Bank: Fruita Branch at 125 N. Park Square, branch established on 2006/11/08. Info updated 2006/11/03: Bank assets: $2,256.5 mil, Deposits: $1,918.7 mil, headquarters in Glenwood Springs, CO, positive income, Commercial Lending Specialization, 43 total offices, Holding Company: Alpine Banks Of Colorado
- U.S. Bank National Association: Fruita Branch at 412 Kokopelli Boulevard, branch established on 2005/07/08. Info updated 2012/01/30: Bank assets: $330,470.8 mil, Deposits: $236,091.5 mil, headquarters in Cincinnati, OH, positive income, 3121 total offices, Holding Company: U.S. Bancorp
- Bank of the West: Fruita Branch at 141 North Park Square, branch established on 1946/04/06. Info updated 2009/11/16: Bank assets: $62,408.3 mil, Deposits: $43,995.2 mil, headquarters in San Francisco, CA, positive income, 647 total offices, Holding Company: Bnp Paribas
For population 15 years and over in Fruita:
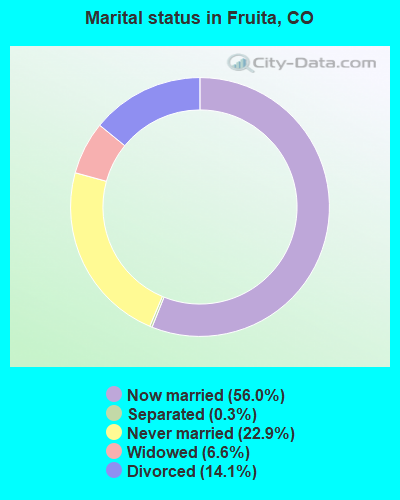
- Never married: 22.9%
- Now married: 56.0%
- Separated: 0.3%
- Widowed: 6.6%
- Divorced: 14.1%
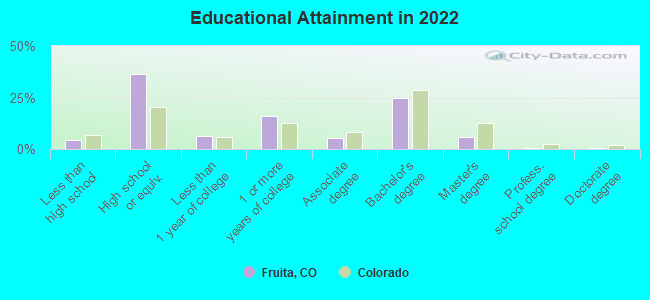
For population 25 years and over in Fruita:
- High school or higher: 94.0%
- Bachelor's degree or higher: 30.7%
- Graduate or professional degree: 8.2%
- Unemployed: 7.5%
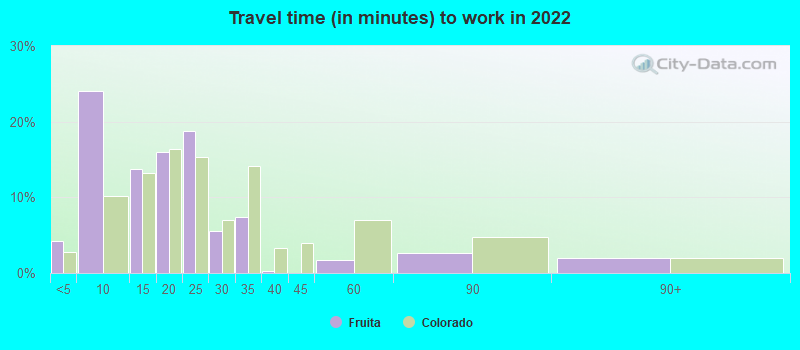
- Mean travel time to work (commute): 18.8 minutes
| Here: | 8.6 |
| Colorado average: | 11.1 |
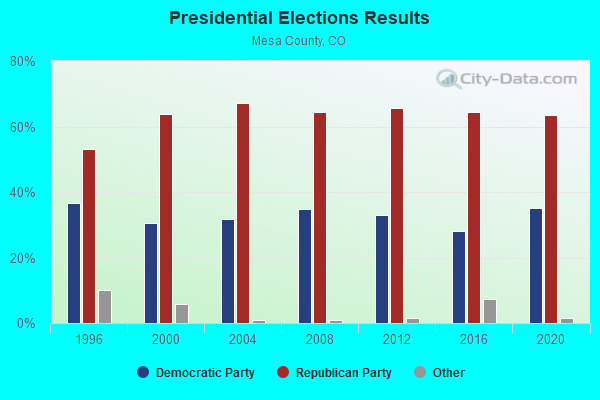
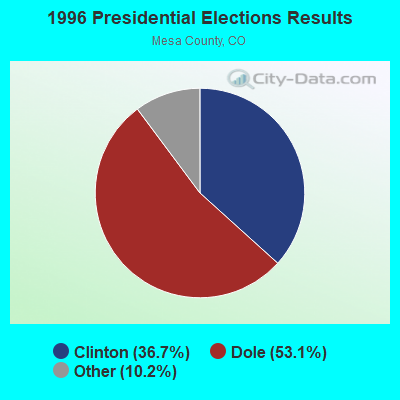
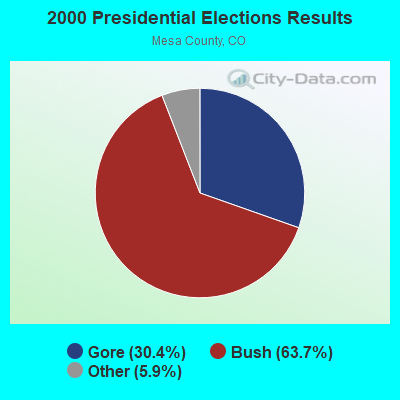
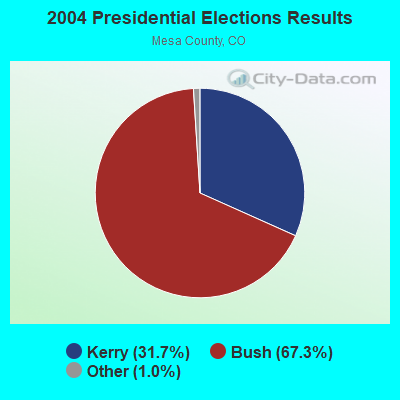

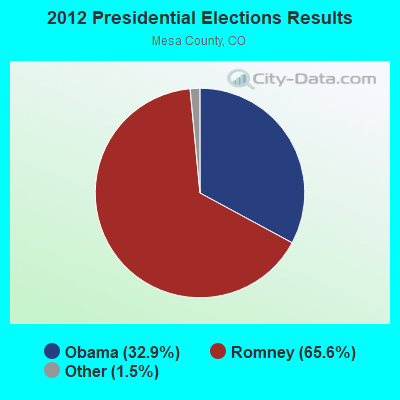
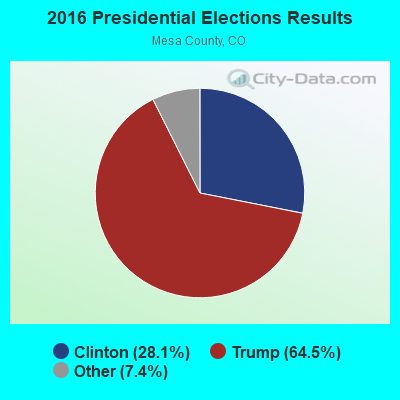
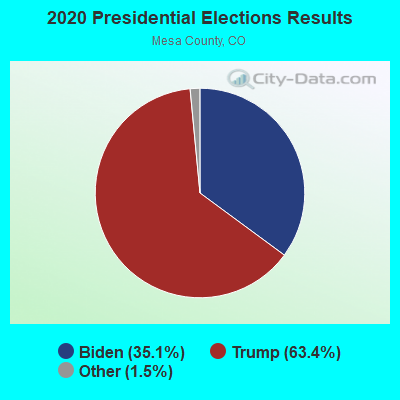
Graphs represent county-level data. Detailed 2008 Election Results
Neighborhoods in Fruita:
(Fruita, Colorado Neighborhood Map)Religion statistics for Fruita, CO (based on Mesa County data)
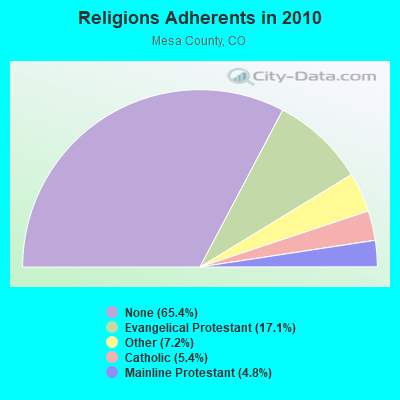
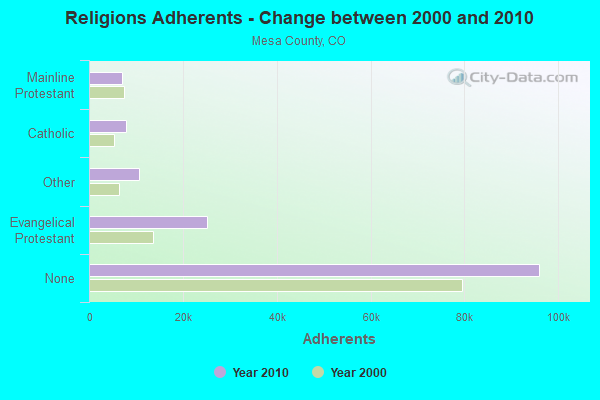
| Religion | Adherents | Congregations |
|---|---|---|
| Evangelical Protestant | 25,054 | 91 |
| Other | 10,593 | 30 |
| Catholic | 7,939 | 5 |
| Mainline Protestant | 7,062 | 21 |
| Orthodox | 80 | 1 |
| None | 95,995 | - |
Food Environment Statistics:
| This county: | 1.58 / 10,000 pop. |
| Colorado: | 1.50 / 10,000 pop. |
| Mesa County: | 0.22 / 10,000 pop. |
| Colorado: | 0.15 / 10,000 pop. |
| Mesa County: | 0.29 / 10,000 pop. |
| Colorado: | 0.45 / 10,000 pop. |
| Mesa County: | 3.38 / 10,000 pop. |
| Colorado: | 3.13 / 10,000 pop. |
| This county: | 7.27 / 10,000 pop. |
| Colorado: | 8.99 / 10,000 pop. |
| Mesa County: | 5.6% |
| Colorado: | 5.3% |
| Mesa County: | 19.9% |
| Colorado: | 18.4% |
| Mesa County: | 11.1% |
| Colorado: | 9.6% |
Health and Nutrition:
| This city: | 48.3% |
| Colorado: | 49.4% |
| This city: | 45.0% |
| State: | 47.8% |
| Here: | 28.5 |
| Colorado: | 28.5 |
| Here: | 23.4% |
| Colorado: | 20.7% |
| This city: | 10.0% |
| Colorado: | 9.7% |
| Fruita: | 6.9 |
| Colorado: | 6.8 |
| Here: | 33.7% |
| State: | 33.3% |
| Fruita: | 54.8% |
| Colorado: | 57.3% |
| This city: | 77.8% |
| State: | 80.2% |
More about Health and Nutrition of Fruita, CO Residents
| Local government employment and payroll (March 2022) | |||||
| Function | Full-time employees | Monthly full-time payroll | Average yearly full-time wage | Part-time employees | Monthly part-time payroll |
|---|---|---|---|---|---|
| Sewerage | 19 | $101,815 | $64,304 | 0 | $0 |
| Police Protection - Officers | 18 | $109,358 | $72,905 | 0 | $0 |
| Parks and Recreation | 16 | $73,281 | $54,961 | 87 | $59,589 |
| Streets and Highways | 13 | $56,456 | $52,113 | 0 | $0 |
| Other and Unallocable | 11 | $32,004 | $34,913 | 0 | $0 |
| Other Government Administration | 6 | $37,954 | $75,908 | 7 | $2,325 |
| Housing and Community Development (Local) | 4 | $19,724 | $59,172 | 0 | $0 |
| Police - Other | 3 | $11,684 | $46,736 | 1 | $1,251 |
| Financial Administration | 3 | $16,235 | $64,940 | 1 | $337 |
| Judicial and Legal | 0 | $0 | 2 | $4,743 | |
| Natural Resources | 0 | $0 | 5 | $4,787 | |
| Totals for Government | 93 | $458,511 | $59,163 | 103 | $73,032 |
Fruita government finances - Expenditure in 2021 (per resident):
- Construction - Regular Highways: $960,000 ($69.77)
Parks and Recreation: $371,000 ($26.96)
- Current Operations - Parks and Recreation: $2,680,000 ($194.77)
Police Protection: $2,268,000 ($164.83)
Regular Highways: $1,612,000 ($117.15)
Sewerage: $1,361,000 ($98.91)
General - Other: $971,000 ($70.57)
Central Staff Services: $881,000 ($64.03)
Solid Waste Management: $753,000 ($54.72)
Financial Administration: $565,000 ($41.06)
General Public Buildings: $230,000 ($16.72)
Judicial and Legal Services: $163,000 ($11.85)
Miscellaneous Commercial Activities - Other: $100,000 ($7.27)
Water Utilities: $40,000 ($2.91)
Transit Utilities: $22,000 ($1.60)
Natural Resources - Other: $7,000 ($0.51)
- Other Capital Outlay - Parks and Recreation: $433,000 ($31.47)
General Public Building: $136,000 ($9.88)
Financial Administration: $47,000 ($3.42)
Regular Highways: $13,000 ($0.94)
Police Protection: $7,000 ($0.51)
- Total Salaries and Wages: $4,943,000 ($359.23)
- Water Utilities - Interest on Debt: $866,000 ($62.94)
Fruita government finances - Revenue in 2021 (per resident):
- Charges - Sewerage: $4,270,000 ($310.32)
Solid Waste Management: $826,000 ($60.03)
Parks and Recreation: $586,000 ($42.59)
Miscellaneous Commercial Activities: $128,000 ($9.30)
Other: $44,000 ($3.20)
- Federal Intergovernmental - Other: $1,117,000 ($81.18)
- Local Intergovernmental - General Local Government Support: $2,559,000 ($185.97)
Other: $382,000 ($27.76)
Highways: $36,000 ($2.62)
- Miscellaneous - Special Assessments: $162,000 ($11.77)
Interest Earnings: $133,000 ($9.67)
Rents: $91,000 ($6.61)
General Revenue - Other: $76,000 ($5.52)
Donations From Private Sources: $33,000 ($2.40)
Fines and Forfeits: $14,000 ($1.02)
Sale of Property: $9,000 ($0.65)
- State Intergovernmental - Other: $743,000 ($54.00)
Highways: $383,000 ($27.83)
Sewerage: $342,000 ($24.85)
General Local Government Support: $15,000 ($1.09)
- Tax - General Sales and Gross Receipts: $5,606,000 ($407.41)
Property: $1,611,000 ($117.08)
Public Utilities Sales: $404,000 ($29.36)
Other Selective Sales: $90,000 ($6.54)
Motor Vehicle License: $55,000 ($4.00)
Occupation and Business License - Other: $18,000 ($1.31)
Alcoholic Beverage License: $9,000 ($0.65)
Other License: $3,000 ($0.22)
Public Utility License: $2,000 ($0.15)
Fruita government finances - Debt in 2021 (per resident):
- Long Term Debt - Beginning Outstanding - Unspecified Public Purpose: $28,516,000 ($2072.38)
Outstanding Unspecified Public Purpose: $27,423,000 ($1992.95)
Retired Unspecified Public Purpose: $1,093,000 ($79.43)
Fruita government finances - Cash and Securities in 2021 (per resident):
- Other Funds - Cash and Securities: $20,259,000 ($1472.31)
- Sinking Funds - Cash and Securities: $3,788,000 ($275.29)
| Businesses in Fruita, CO | ||||
| Name | Count | Name | Count | |
|---|---|---|---|---|
| Ace Hardware | 1 | McDonald's | 1 | |
| Burger King | 1 | New Balance | 1 | |
| Comfort Inn | 1 | Super 8 | 1 | |
| Domino's Pizza | 1 | Taco Bell | 1 | |
| FedEx | 2 | U-Haul | 1 | |
| H&R Block | 1 | UPS | 1 | |
| Kroger | 1 | Walgreens | 1 | |
| La Quinta | 1 | Wendy's | 1 | |
Strongest AM radio stations in Fruita:
- KJOL (620 AM; 10 kW; GRAND JUNCTION, CO; Owner: UNITED MINISTRIES)
- KNZZ (1100 AM; 50 kW; GRAND JUNCTION, CO; Owner: M B C GRAND BROADCASTING, INC.)
- KTMM (1340 AM; 1 kW; GRAND JUNCTION, CO; Owner: MBC GRAND BROADCASTING, INC.)
- KEXO (1230 AM; 1 kW; GRAND JUNCTION, CO; Owner: CUMULUS LICENSING CORP.)
- KUBC (580 AM; 5 kW; MONTROSE, CO; Owner: WOODLAND COMMUNICATIONS CORPORATION)
- KALL (700 AM; 50 kW; NORTH SALT LAKE CITY, UT; Owner: CITICASTERS LICENSES, L.P.)
- KLTT (670 AM; 50 kW; COMMERCE CITY, CO; Owner: KLZ RADIO, INC.)
- KKZN (760 AM; 50 kW; THORNTON, CO; Owner: JACOR BROADCASTING OF COLORADO, INC.)
- KTNN (660 AM; 50 kW; WINDOW ROCK, AZ; Owner: THE NAVAJO NATION)
- KOA (850 AM; 50 kW; DENVER, CO; Owner: JACOR BROADCASTING OF COLORADO, INC.)
- KIQN (1010 AM; 50 kW; TOOELE, UT)
- KOAL (750 AM; 10 kW; PRICE, UT; Owner: EASTERN UTAH BROADCASTING CO.)
- KSL (1160 AM; 50 kW; SALT LAKE CITY, UT; Owner: BONNEVILLE HOLDING COMPANY)
Strongest FM radio stations in Fruita:
- KEKB (99.9 FM; FRUITA, CO; Owner: CUMULUS LICENSING CORP.)
- KBKL (107.9 FM; GRAND JUNCTION, CO; Owner: CUMULUS LICENSING CORP.)
- KMGJ (93.1 FM; GRAND JUNCTION, CO; Owner: M.B.C. GRAND BROADCASTING, INC.)
- KMXY (104.3 FM; GRAND JUNCTION, CO; Owner: CUMULUS LICENSING CORP.)
- KMOZ-FM (100.7 FM; GRAND JUNCTION, CO; Owner: MBC GRAND BROADCASTING INC)
- KMSA (91.3 FM; GRAND JUNCTION, CO; Owner: MESA STATE COLLEGE)
- KPRN (89.5 FM; GRAND JUNCTION, CO; Owner: PUBLIC BROADCASTING OF COLORADO INC.)
- KLFV (90.3 FM; GRAND JUNCTION, CO; Owner: EDUCATIONAL MEDIA FOUNDATION)
- KAFM (88.1 FM; GRAND JUNCTION, CO; Owner: GRAND VALLEY PUBLIC RADIO CO, INC)
- KZKS-FM1 (105.3 FM; GRAND JUNCTION, CO; Owner: WESTERN SLOPE COMMUNICATIONS, L.L.C.)
- KJYE (92.3 FM; GRAND JUNCTION, CO; Owner: M B C GRAND BROADCASTING, INC.)
- K256AD (99.1 FM; PALISADE, CO; Owner: NORTH FORK VALLEY PUBLIC RADIO, INC.)
- K205CK (88.9 FM; GRAND JUNCTION, CO; Owner: CALVARY CHAPEL OF TWIN FALLS, INC.)
- K214CA (90.7 FM; GRAND JUNCTION, CO; Owner: FAMILY STATIONS, INC.)
- K210CE (89.9 FM; MESA, CO; Owner: EDUCATIONAL MEDIA FOUNDATION)
- KZKS (105.3 FM; RIFLE, CO; Owner: WESTERN SLOPE COMMUNICATIONS, L.L.C.)
- KKNN (95.1 FM; DELTA, CO; Owner: CUMULUS LICENSING CORP.)
- KSTR-FM (96.1 FM; MONTROSE, CO; Owner: LEGGETT BROADCASTING, INC)
- KPRU (103.3 FM; DELTA, CO; Owner: PUBLIC BROADCASTING OF COLORADO INC)
- KDNK (90.5 FM; CARBONDALE, CO; Owner: CARBONDALE COMM. ACCESS RADIO, INC.)
TV broadcast stations around Fruita:
- KREX-TV (Channel 5; GRAND JUNCTION, CO; Owner: W. RUSSELL WITHERS, JR.)
- KKCO (Channel 11; GRAND JUNCTION, CO; Owner: EAGLE III BROADCASTING, LLC)
- K25FZ (Channel 25; GRAND JUNCTION, CO; Owner: TRINITY BROADCASTING NETWORK)
- KFQX (Channel 4; GRAND JUNCTION, CO; Owner: JOHN HARVEY REES)
- K65CE (Channel 65; GRAND JUNCTION, ETC., CO; Owner: MESA COUNTY)
- K67CJ (Channel 67; GRAND JUNCTION, ETC., CO; Owner: MESA COUNTY)
- National Bridge Inventory (NBI) Statistics
- 47Number of bridges
- 358ft / 109mTotal length
- $644,000Total costs
- 191,583Total average daily traffic
- 25,092Total average daily truck traffic
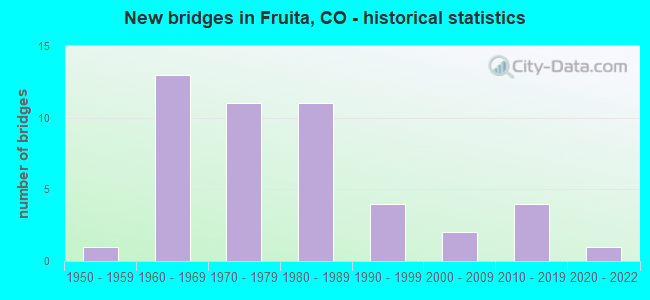
- New bridges - historical statistics
- 11950-1959
- 131960-1969
- 111970-1979
- 111980-1989
- 41990-1999
- 22000-2009
- 42010-2019
- 12020-2022
FCC Registered Antenna Towers:
36 (See the full list of FCC Registered Antenna Towers in Fruita)FCC Registered Commercial Land Mobile Towers:
1- Black Ridge Electronic Site (Lat: 39.066722 Lon: -108.745278), Type: Tower, Structure height: 105.2 m, Call Sign: WPZA320, Licensee ID: L00371727,
Assigned Frequencies: 450.187 MHz, Grant Date: 12/11/2003, Expiration Date: 04/01/2029, Certifier: Richard C Dean, Registrant: Mbc Grand Broadcasting, Inc., 1360 East Sherwood Drive, Grand Junction, CO 81501, Phone: (970) 242-9230, Fax: (970) 245-7551, Email:
FCC Registered Broadcast Land Mobile Towers:
6- 325 East Aspen (Lat: 39.159583 Lon: -108.730694), Type: Bant, Structure height: 12.2 m, Overall height: 14.6 m, Call Sign: WXK697,
Assigned Frequencies: 154.040 MHz, Grant Date: 11/14/2022, Expiration Date: 11/13/2032, Registrant: Two Way Communications Inc, 575 S. Westgate Dr. Unit A, Grand Junction, CO 81505, Phone: (970) 243-9823, Fax: (970) 241-1241, Email:
- 228 N Cherry (Lat: 39.190528 Lon: -108.758444), Call Sign: KFQ966, Licensee ID: L00011138,
Assigned Frequencies: 152.007 MHz, 155.340 MHz, Grant Date: 04/22/1997, Expiration Date: 05/04/2002, Cancellation Date: 09/08/2002, Registrant: Lower Valley Hospital, 228 N Cherry, Fruita, CO 81521
- 182 J 2/10 Rd (Lat: 39.154417 Lon: -108.715667), Call Sign: KNFR469, Licensee ID: L00038808,
Assigned Frequencies: 158.385 MHz, Grant Date: 04/02/2003, Expiration Date: 03/03/2013, Cancellation Date: 05/04/2013, Registrant: Serve, Anthony:garlitz, Walter Dba Garlitz & Serve, Fruita, CO 81521
- 1110 16 Rd (Lat: 39.165528 Lon: -108.753722), Type: Upole, Structure height: 12 m, Call Sign: WPIR881,
Assigned Frequencies: 456.150 MHz, Grant Date: 09/17/2005, Expiration Date: 11/06/2015, Cancellation Date: 08/02/2012, Certifier: Ronald D Obermueller, Registrant: Fish & Richardson P.C., 1425 K Street, N.W., 11th Floor, Washington, DC 20005, Phone: (202) 626-7754, Fax: (202) 783-2331, Email:
- 876 18 1/2 Road (Lat: 39.251194 Lon: -108.718111), Type: Bant, Structure height: 6 m, Overall height: 9.1 m, Call Sign: WPXY262,
Assigned Frequencies: 461.512 MHz, Grant Date: 08/27/2013, Expiration Date: 06/30/2023, Cancellation Date: 09/02/2023, Certifier: Glen Manly, Registrant: Cara Enterprises Inc, Las Vegas, NV 89140-0124, Phone: (702) 838-9728, Fax: (702) 363-4607, Email:
- 1949 J 2/10 Road (Lat: 39.152472 Lon: -108.075639), Call Sign: WQPX387,
Assigned Frequencies: 462.412 MHz, Grant Date: 06/14/2022, Expiration Date: 09/07/2032, Certifier: Richard G Rich, Registrant: Fire Team Security, Inc., 2297 Tall Grass, Unit J, Grand Junction, CO 81505, Phone: (888) 446-7416, Fax: (888) 720-5877, Email:
FCC Registered Microwave Towers:
109 (See the full list of FCC Registered Microwave Towers in this town)FCC Registered Amateur Radio Licenses:
152 (See the full list of FCC Registered Amateur Radio Licenses in Fruita)FAA Registered Aircraft Manufacturers and Dealers:
2 (See the full list of FAA Registered Manufacturers and Dealers in Fruita)FAA Registered Aircraft:
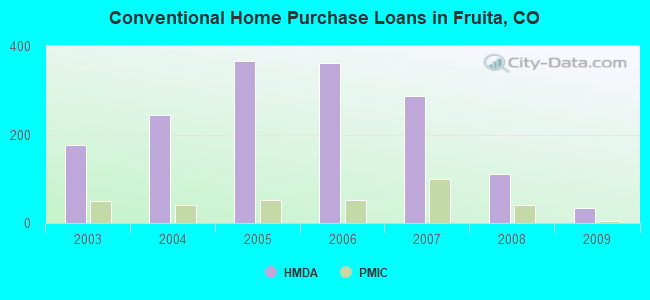
29 (See the full list of FAA Registered Aircraft)| Home Mortgage Disclosure Act Aggregated Statistics For Year 2009 (Based on 1 partial tract) | ||||||||||||||
| A) FHA, FSA/RHS & VA Home Purchase Loans | B) Conventional Home Purchase Loans | C) Refinancings | D) Home Improvement Loans | E) Loans on Dwellings For 5+ Families | F) Non-occupant Loans on < 5 Family Dwellings (A B C & D) | G) Loans On Manufactured Home Dwelling (A B C & D) | ||||||||
|---|---|---|---|---|---|---|---|---|---|---|---|---|---|---|
| Number | Average Value | Number | Average Value | Number | Average Value | Number | Average Value | Number | Average Value | Number | Average Value | Number | Average Value | |
| LOANS ORIGINATED | 131 | $208,477 | 33 | $192,460 | 401 | $200,217 | 16 | $73,995 | 1 | $114,440 | 29 | $169,806 | 19 | $117,864 |
| APPLICATIONS APPROVED, NOT ACCEPTED | 7 | $189,480 | 4 | $157,350 | 18 | $202,629 | 1 | $125,390 | 0 | $0 | 2 | $168,610 | 1 | $113,830 |
| APPLICATIONS DENIED | 15 | $183,341 | 7 | $118,436 | 78 | $211,890 | 8 | $13,315 | 0 | $0 | 7 | $212,697 | 7 | $82,000 |
| APPLICATIONS WITHDRAWN | 8 | $205,512 | 5 | $247,498 | 65 | $203,727 | 2 | $15,220 | 0 | $0 | 5 | $214,506 | 3 | $111,190 |
| FILES CLOSED FOR INCOMPLETENESS | 3 | $210,407 | 1 | $127,830 | 11 | $189,195 | 1 | $22,520 | 0 | $0 | 0 | $0 | 0 | $0 |
Detailed HMDA statistics for the following Tracts: 0015.01
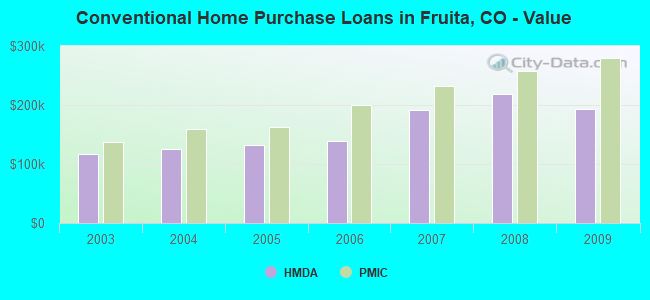
| Private Mortgage Insurance Companies Aggregated Statistics For Year 2009 (Based on 1 partial tract) | ||||||
| A) Conventional Home Purchase Loans | B) Refinancings | C) Non-occupant Loans on < 5 Family Dwellings (A & B) | ||||
|---|---|---|---|---|---|---|
| Number | Average Value | Number | Average Value | Number | Average Value | |
| LOANS ORIGINATED | 4 | $279,240 | 13 | $251,721 | 0 | $0 |
| APPLICATIONS APPROVED, NOT ACCEPTED | 5 | $262,350 | 5 | $237,272 | 1 | $176,520 |
| APPLICATIONS DENIED | 0 | $0 | 2 | $256,565 | 0 | $0 |
| APPLICATIONS WITHDRAWN | 1 | $164,350 | 1 | $177,740 | 0 | $0 |
| FILES CLOSED FOR INCOMPLETENESS | 0 | $0 | 1 | $384,700 | 0 | $0 |
Detailed PMIC statistics for the following Tracts: 0015.01
2005 - 2018 National Fire Incident Reporting System (NFIRS) incidents
- Fire incident types reported to NFIRS in Fruita, CO
- 70362.6%Outside Fires
- 26924.0%Structure Fires
- 786.9%Other
- 736.5%Mobile Property/Vehicle Fires
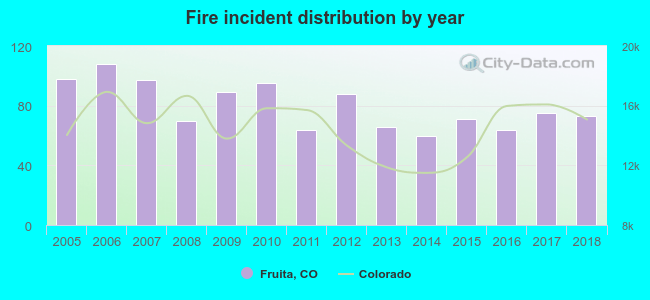 According to the data from the years 2005 - 2018 the average number of fires per year is 80. The highest number of fire incidents - 108 took place in 2006, and the least - 60 in 2014. The data has a declining trend.
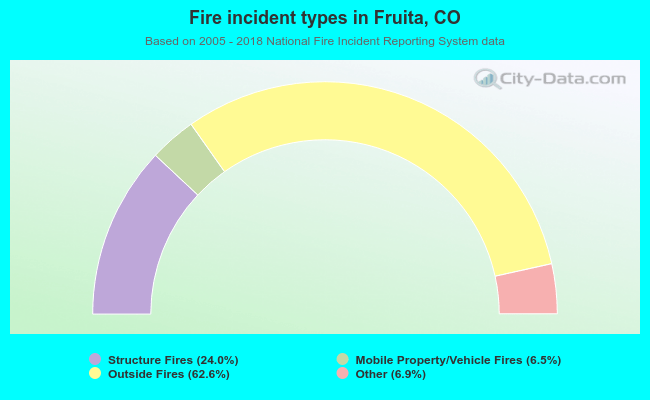 When looking into fire subcategories, the most incidents belonged to: Outside Fires (62.6%), and Structure Fires (24.0%).
Fire-safe hotels and motels in Fruita, Colorado:
- Fruita Comfort Inn, 400 Jurassic Ave, Fruita, Colorado 81521 , Phone: (970) 858-1333, Fax: (970) 858-1108
- La Quinta Inn & Suites Fruita, 570 Raptor Rd, Fruita, Colorado 81521 , Phone: (970) 858-8850, Fax: (970) 858-8849
| Most common first names in Fruita, CO among deceased individuals | ||
| Name | Count | Lived (average) |
|---|---|---|
| John | 57 | 79.0 years |
| Mary | 50 | 81.8 years |
| William | 45 | 75.6 years |
| James | 33 | 73.6 years |
| Charles | 32 | 72.9 years |
| Robert | 30 | 75.2 years |
| Dorothy | 26 | 81.0 years |
| Ruth | 26 | 80.7 years |
| Clarence | 23 | 77.9 years |
| Raymond | 22 | 77.6 years |
| Most common last names in Fruita, CO among deceased individuals | ||
| Last name | Count | Lived (average) |
|---|---|---|
| Smith | 21 | 80.0 years |
| White | 20 | 77.0 years |
| Jones | 16 | 79.9 years |
| Johnson | 16 | 75.1 years |
| Miller | 12 | 79.7 years |
| Young | 11 | 77.2 years |
| Martinez | 11 | 77.1 years |
| Thompson | 11 | 76.6 years |
| Barnes | 11 | 77.5 years |
| Thomas | 11 | 79.3 years |
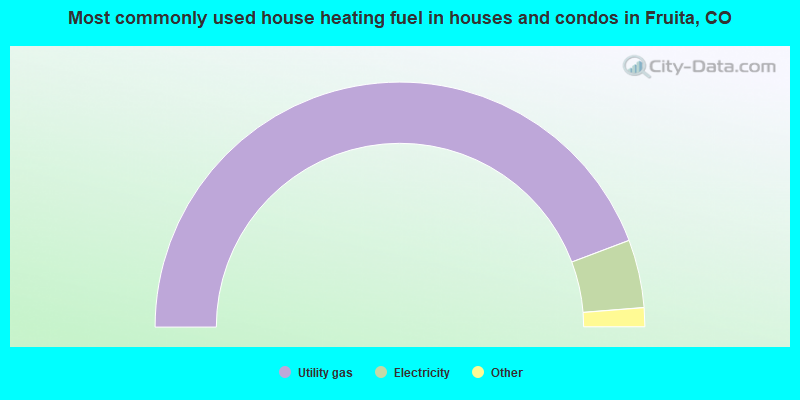
- 88.5%Utility gas
- 9.0%Electricity
- 1.6%Solar energy
- 0.5%Wood
- 0.3%Bottled, tank, or LP gas
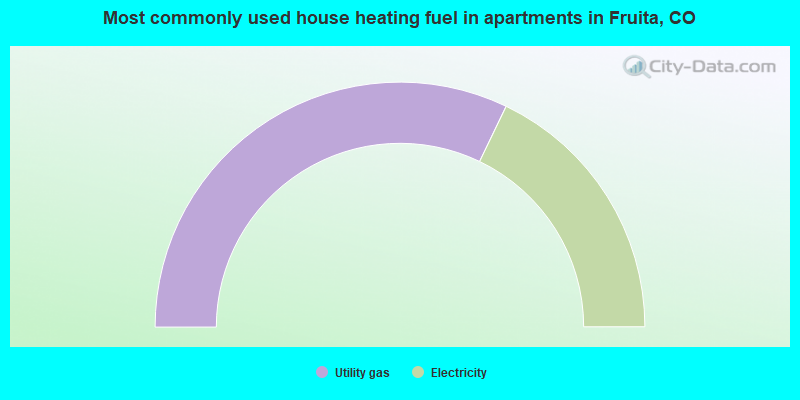
- 64.3%Utility gas
- 35.7%Electricity
Fruita compared to Colorado state average:
- Unemployed percentage below state average.
- Foreign-born population percentage significantly below state average.
- Length of stay since moving in significantly above state average.
- House age below state average.
Fruita on our top lists:
- #52 on the list of "Top 101 cities with the largest percentage of people in other noninstitutional group quarters (population 1,000+)"
- #5 on the list of "Top 101 counties with the highest Ozone (1-hour) air pollution readings in 2012 (ppm)"
- #33 on the list of "Top 101 counties with the largest increase in the number of births per 1000 residents 2000-2006 to 2007-2013 (pop 50,000+)"
- #75 on the list of "Top 101 counties with the highest Particulate Matter (PM10) Annual air pollution readings in 2012 (µg/m3)"
- #81 on the list of "Top 101 counties with the lowest ground withdrawal of fresh water for public supply (pop. 50,000+)"

|
|
Total of 18 patent applications in 2008-2024.