Hibbing, Minnesota Submit your own pictures of this city and show them to the world
OSM Map
General Map
Google Map
MSN Map
OSM Map
General Map
Google Map
MSN Map
OSM Map
General Map
Google Map
MSN Map
OSM Map
General Map
Google Map
MSN Map
Please wait while loading the map...
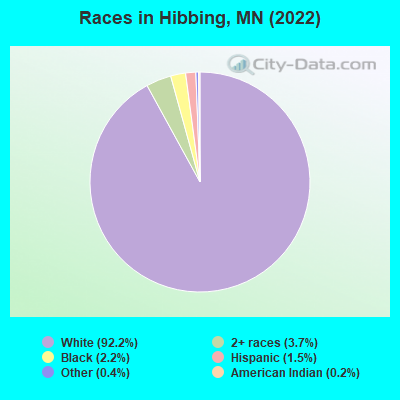
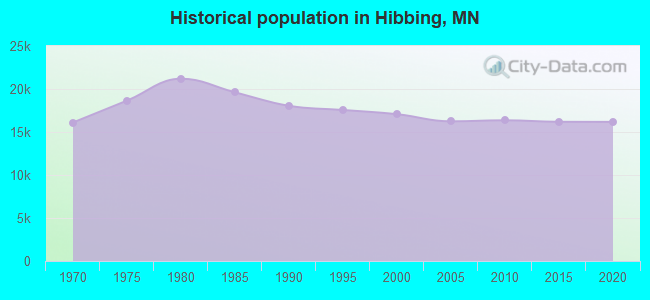
Population in 2022: 16,052 (74% urban, 26% rural). Population change since 2000: -6.0%Males: 7,978 Females: 8,074
March 2022 cost of living index in Hibbing: 95.0 (less than average, U.S. average is 100) Percentage of residents living in poverty in 2022: 14.2%for White Non-Hispanic residents , 1.9% for Black residents , 21.3% for Hispanic or Latino residents , 47.9% for American Indian residents , 20.7% for two or more races residents )
Profiles of local businesses
Business Search - 14 Million verified businesses
Data:
Median household income ($)
Median household income (% change since 2000)
Household income diversity
Ratio of average income to average house value (%)
Ratio of average income to average rent
Median household income ($) - White
Median household income ($) - Black or African American
Median household income ($) - Asian
Median household income ($) - Hispanic or Latino
Median household income ($) - American Indian and Alaska Native
Median household income ($) - Multirace
Median household income ($) - Other Race
Median household income for houses/condos with a mortgage ($)
Median household income for apartments without a mortgage ($)
Races - White alone (%)
Races - White alone (% change since 2000)
Races - Black alone (%)
Races - Black alone (% change since 2000)
Races - American Indian alone (%)
Races - American Indian alone (% change since 2000)
Races - Asian alone (%)
Races - Asian alone (% change since 2000)
Races - Hispanic (%)
Races - Hispanic (% change since 2000)
Races - Native Hawaiian and Other Pacific Islander alone (%)
Races - Native Hawaiian and Other Pacific Islander alone (% change since 2000)
Races - Two or more races (%)
Races - Two or more races (% change since 2000)
Races - Other race alone (%)
Races - Other race alone (% change since 2000)
Racial diversity
Unemployment (%)
Unemployment (% change since 2000)
Unemployment (%) - White
Unemployment (%) - Black or African American
Unemployment (%) - Asian
Unemployment (%) - Hispanic or Latino
Unemployment (%) - American Indian and Alaska Native
Unemployment (%) - Multirace
Unemployment (%) - Other Race
Population density (people per square mile)
Population - Males (%)
Population - Females (%)
Population - Males (%) - White
Population - Males (%) - Black or African American
Population - Males (%) - Asian
Population - Males (%) - Hispanic or Latino
Population - Males (%) - American Indian and Alaska Native
Population - Males (%) - Multirace
Population - Males (%) - Other Race
Population - Females (%) - White
Population - Females (%) - Black or African American
Population - Females (%) - Asian
Population - Females (%) - Hispanic or Latino
Population - Females (%) - American Indian and Alaska Native
Population - Females (%) - Multirace
Population - Females (%) - Other Race
Coronavirus confirmed cases (May 19, 2024)
Deaths caused by coronavirus (May 19, 2024)
Coronavirus confirmed cases (per 100k population) (May 19, 2024)
Deaths caused by coronavirus (per 100k population) (May 19, 2024)
Daily increase in number of cases (May 19, 2024)
Weekly increase in number of cases (May 19, 2024)
Cases doubled (in days) (May 19, 2024)
Hospitalized patients (Apr 18, 2022)
Negative test results (Apr 18, 2022)
Total test results (Apr 18, 2022)
COVID Vaccine doses distributed (per 100k population) (Sep 19, 2023)
COVID Vaccine doses administered (per 100k population) (Sep 19, 2023)
COVID Vaccine doses distributed (Sep 19, 2023)
COVID Vaccine doses administered (Sep 19, 2023)
Likely homosexual households (%)
Likely homosexual households (% change since 2000)
Likely homosexual households - Lesbian couples (%)
Likely homosexual households - Lesbian couples (% change since 2000)
Likely homosexual households - Gay men (%)
Likely homosexual households - Gay men (% change since 2000)
Cost of living index
Median gross rent ($)
Median contract rent ($)
Median monthly housing costs ($)
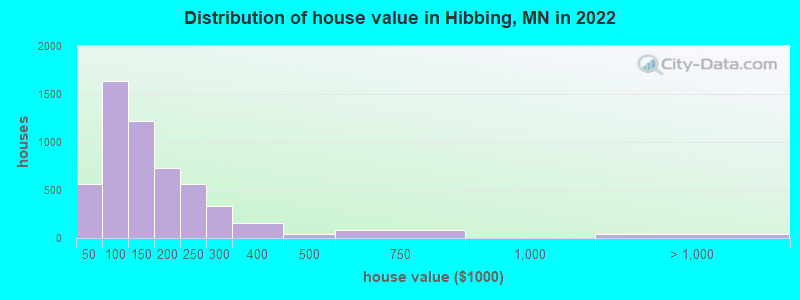
Median house or condo value ($)
Median house or condo value ($ change since 2000)
Mean house or condo value by units in structure - 1, detached ($)
Mean house or condo value by units in structure - 1, attached ($)
Mean house or condo value by units in structure - 2 ($)
Mean house or condo value by units in structure by units in structure - 3 or 4 ($)
Mean house or condo value by units in structure - 5 or more ($)
Mean house or condo value by units in structure - Boat, RV, van, etc. ($)
Mean house or condo value by units in structure - Mobile home ($)
Median house or condo value ($) - White
Median house or condo value ($) - Black or African American
Median house or condo value ($) - Asian
Median house or condo value ($) - Hispanic or Latino
Median house or condo value ($) - American Indian and Alaska Native
Median house or condo value ($) - Multirace
Median house or condo value ($) - Other Race
Median resident age
Resident age diversity
Median resident age - Males
Median resident age - Females
Median resident age - White
Median resident age - Black or African American
Median resident age - Asian
Median resident age - Hispanic or Latino
Median resident age - American Indian and Alaska Native
Median resident age - Multirace
Median resident age - Other Race
Median resident age - Males - White
Median resident age - Males - Black or African American
Median resident age - Males - Asian
Median resident age - Males - Hispanic or Latino
Median resident age - Males - American Indian and Alaska Native
Median resident age - Males - Multirace
Median resident age - Males - Other Race
Median resident age - Females - White
Median resident age - Females - Black or African American
Median resident age - Females - Asian
Median resident age - Females - Hispanic or Latino
Median resident age - Females - American Indian and Alaska Native
Median resident age - Females - Multirace
Median resident age - Females - Other Race
Commute - mean travel time to work (minutes)
Travel time to work - Less than 5 minutes (%)
Travel time to work - Less than 5 minutes (% change since 2000)
Travel time to work - 5 to 9 minutes (%)
Travel time to work - 5 to 9 minutes (% change since 2000)
Travel time to work - 10 to 19 minutes (%)
Travel time to work - 10 to 19 minutes (% change since 2000)
Travel time to work - 20 to 29 minutes (%)
Travel time to work - 20 to 29 minutes (% change since 2000)
Travel time to work - 30 to 39 minutes (%)
Travel time to work - 30 to 39 minutes (% change since 2000)
Travel time to work - 40 to 59 minutes (%)
Travel time to work - 40 to 59 minutes (% change since 2000)
Travel time to work - 60 to 89 minutes (%)
Travel time to work - 60 to 89 minutes (% change since 2000)
Travel time to work - 90 or more minutes (%)
Travel time to work - 90 or more minutes (% change since 2000)
Marital status - Never married (%)
Marital status - Now married (%)
Marital status - Separated (%)
Marital status - Widowed (%)
Marital status - Divorced (%)
Median family income ($)
Median family income (% change since 2000)
Median non-family income ($)
Median non-family income (% change since 2000)
Median per capita income ($)
Median per capita income (% change since 2000)
Median family income ($) - White
Median family income ($) - Black or African American
Median family income ($) - Asian
Median family income ($) - Hispanic or Latino
Median family income ($) - American Indian and Alaska Native
Median family income ($) - Multirace
Median family income ($) - Other Race
Median year house/condo built
Median year apartment built
Year house built - Built 2005 or later (%)
Year house built - Built 2000 to 2004 (%)
Year house built - Built 1990 to 1999 (%)
Year house built - Built 1980 to 1989 (%)
Year house built - Built 1970 to 1979 (%)
Year house built - Built 1960 to 1969 (%)
Year house built - Built 1950 to 1959 (%)
Year house built - Built 1940 to 1949 (%)
Year house built - Built 1939 or earlier (%)
Average household size
Household density (households per square mile)
Average household size - White
Average household size - Black or African American
Average household size - Asian
Average household size - Hispanic or Latino
Average household size - American Indian and Alaska Native
Average household size - Multirace
Average household size - Other Race
Occupied housing units (%)
Vacant housing units (%)
Owner occupied housing units (%)
Renter occupied housing units (%)
Vacancy status - For rent (%)
Vacancy status - For sale only (%)
Vacancy status - Rented or sold, not occupied (%)
Vacancy status - For seasonal, recreational, or occasional use (%)
Vacancy status - For migrant workers (%)
Vacancy status - Other vacant (%)
Residents with income below the poverty level (%)
Residents with income below 50% of the poverty level (%)
Children below poverty level (%)
Poor families by family type - Married-couple family (%)
Poor families by family type - Male, no wife present (%)
Poor families by family type - Female, no husband present (%)
Poverty status for native-born residents (%)
Poverty status for foreign-born residents (%)
Poverty among high school graduates not in families (%)
Poverty among people who did not graduate high school not in families (%)
Residents with income below the poverty level (%) - White
Residents with income below the poverty level (%) - Black or African American
Residents with income below the poverty level (%) - Asian
Residents with income below the poverty level (%) - Hispanic or Latino
Residents with income below the poverty level (%) - American Indian and Alaska Native
Residents with income below the poverty level (%) - Multirace
Residents with income below the poverty level (%) - Other Race
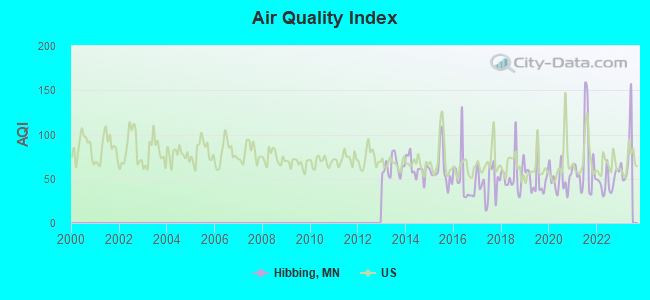
Air pollution - Air Quality Index (AQI)
Air pollution - CO
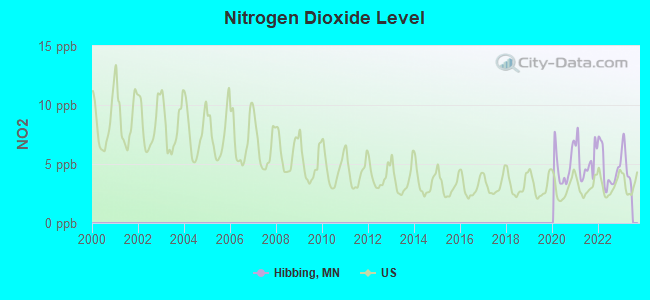
Air pollution - NO2
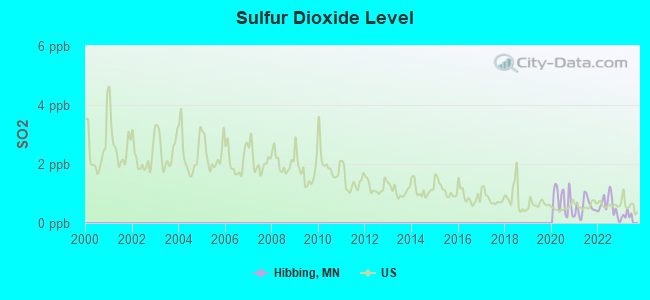
Air pollution - SO2
Air pollution - Ozone
Air pollution - PM10
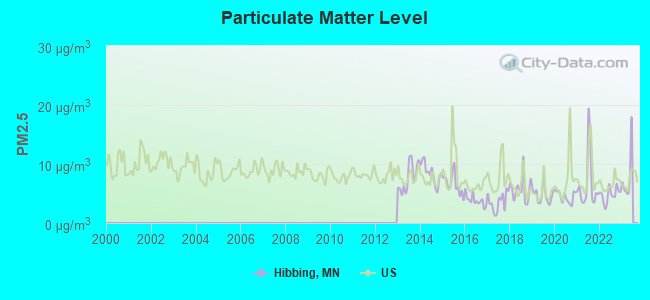
Air pollution - PM25
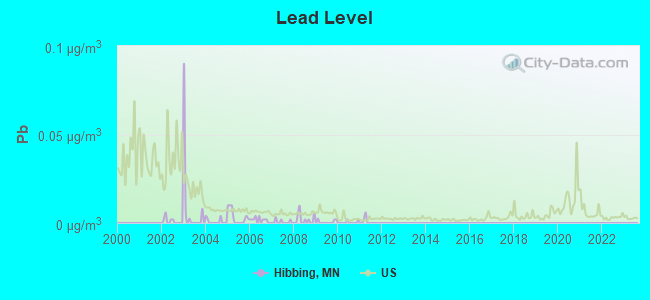
Air pollution - Pb
Crime - Murders per 100,000 population
Crime - Rapes per 100,000 population
Crime - Robberies per 100,000 population
Crime - Assaults per 100,000 population
Crime - Burglaries per 100,000 population
Crime - Thefts per 100,000 population
Crime - Auto thefts per 100,000 population
Crime - Arson per 100,000 population
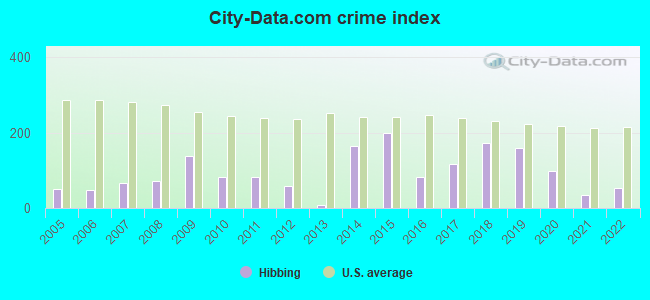
Crime - City-data.com crime index
Crime - Violent crime index
Crime - Property crime index
Crime - Murders per 100,000 population (5 year average)
Crime - Rapes per 100,000 population (5 year average)
Crime - Robberies per 100,000 population (5 year average)
Crime - Assaults per 100,000 population (5 year average)
Crime - Burglaries per 100,000 population (5 year average)
Crime - Thefts per 100,000 population (5 year average)
Crime - Auto thefts per 100,000 population (5 year average)
Crime - Arson per 100,000 population (5 year average)
Crime - City-data.com crime index (5 year average)
Crime - Violent crime index (5 year average)
Crime - Property crime index (5 year average)
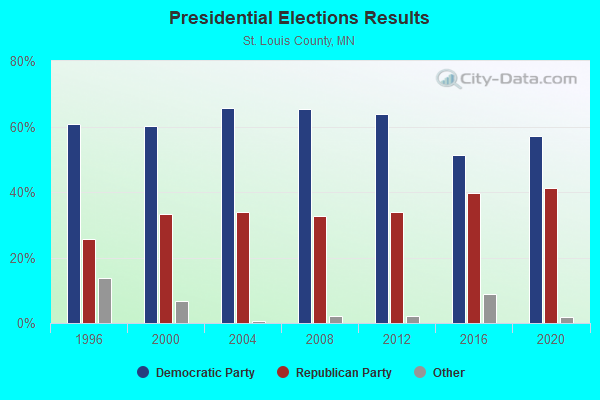
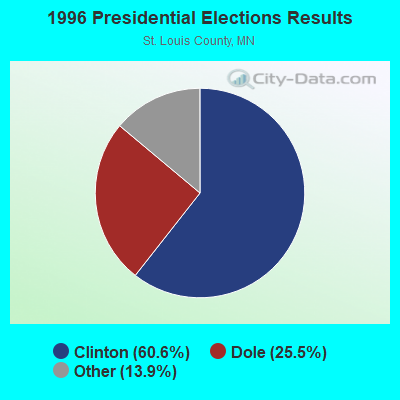
1996 Presidential Elections Results (%) - Democratic Party (Clinton)
1996 Presidential Elections Results (%) - Republican Party (Dole)
1996 Presidential Elections Results (%) - Other
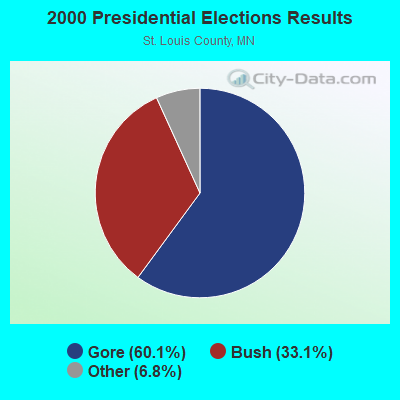
2000 Presidential Elections Results (%) - Democratic Party (Gore)
2000 Presidential Elections Results (%) - Republican Party (Bush)
2000 Presidential Elections Results (%) - Other
2004 Presidential Elections Results (%) - Democratic Party (Kerry)
2004 Presidential Elections Results (%) - Republican Party (Bush)
2004 Presidential Elections Results (%) - Other
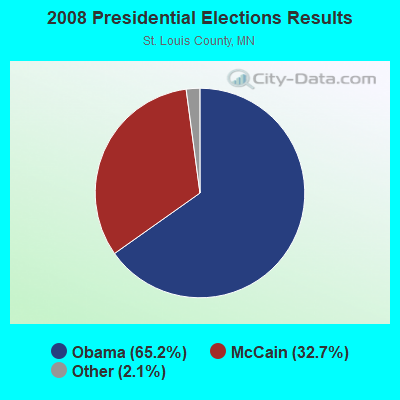
2008 Presidential Elections Results (%) - Democratic Party (Obama)
2008 Presidential Elections Results (%) - Republican Party (McCain)
2008 Presidential Elections Results (%) - Other
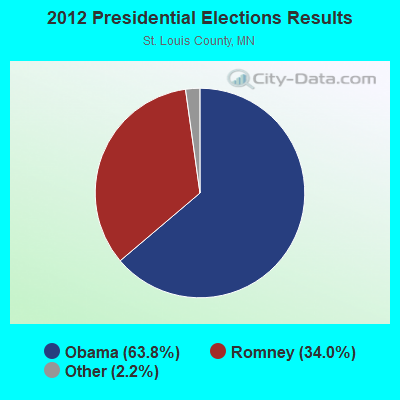
2012 Presidential Elections Results (%) - Democratic Party (Obama)
2012 Presidential Elections Results (%) - Republican Party (Romney)
2012 Presidential Elections Results (%) - Other
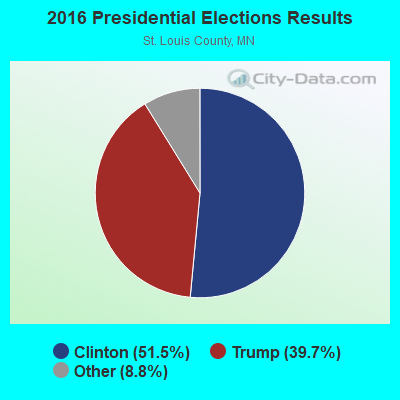
2016 Presidential Elections Results (%) - Democratic Party (Clinton)
2016 Presidential Elections Results (%) - Republican Party (Trump)
2016 Presidential Elections Results (%) - Other
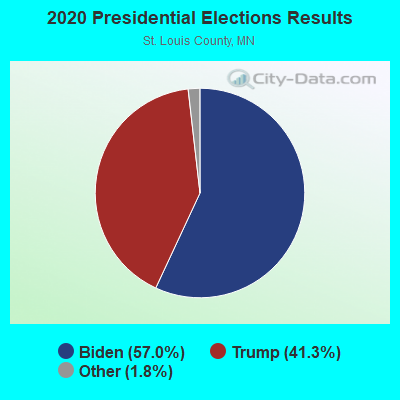
2020 Presidential Elections Results (%) - Democratic Party (Biden)
2020 Presidential Elections Results (%) - Republican Party (Trump)
2020 Presidential Elections Results (%) - Other
Ancestries Reported - Arab (%)
Ancestries Reported - Czech (%)
Ancestries Reported - Danish (%)
Ancestries Reported - Dutch (%)
Ancestries Reported - English (%)
Ancestries Reported - French (%)
Ancestries Reported - French Canadian (%)
Ancestries Reported - German (%)
Ancestries Reported - Greek (%)
Ancestries Reported - Hungarian (%)
Ancestries Reported - Irish (%)
Ancestries Reported - Italian (%)
Ancestries Reported - Lithuanian (%)
Ancestries Reported - Norwegian (%)
Ancestries Reported - Polish (%)
Ancestries Reported - Portuguese (%)
Ancestries Reported - Russian (%)
Ancestries Reported - Scotch-Irish (%)
Ancestries Reported - Scottish (%)
Ancestries Reported - Slovak (%)
Ancestries Reported - Subsaharan African (%)
Ancestries Reported - Swedish (%)
Ancestries Reported - Swiss (%)
Ancestries Reported - Ukrainian (%)
Ancestries Reported - United States (%)
Ancestries Reported - Welsh (%)
Ancestries Reported - West Indian (%)
Ancestries Reported - Other (%)
Educational Attainment - No schooling completed (%)
Educational Attainment - Less than high school (%)
Educational Attainment - High school or equivalent (%)
Educational Attainment - Less than 1 year of college (%)
Educational Attainment - 1 or more years of college (%)
Educational Attainment - Associate degree (%)
Educational Attainment - Bachelor's degree (%)
Educational Attainment - Master's degree (%)
Educational Attainment - Professional school degree (%)
Educational Attainment - Doctorate degree (%)
School Enrollment - Nursery, preschool (%)
School Enrollment - Kindergarten (%)
School Enrollment - Grade 1 to 4 (%)
School Enrollment - Grade 5 to 8 (%)
School Enrollment - Grade 9 to 12 (%)
School Enrollment - College undergrad (%)
School Enrollment - Graduate or professional (%)
School Enrollment - Not enrolled in school (%)
School enrollment - Public schools (%)
School enrollment - Private schools (%)
School enrollment - Not enrolled (%)
Median number of rooms in houses and condos
Median number of rooms in apartments
Housing units lacking complete plumbing facilities (%)
Housing units lacking complete kitchen facilities (%)
Density of houses
Urban houses (%)
Rural houses (%)
Households with people 60 years and over (%)
Households with people 65 years and over (%)
Households with people 75 years and over (%)
Households with one or more nonrelatives (%)
Households with no nonrelatives (%)
Population in households (%)
Family households (%)
Nonfamily households (%)
Population in families (%)
Family households with own children (%)
Median number of bedrooms in owner occupied houses
Mean number of bedrooms in owner occupied houses
Median number of bedrooms in renter occupied houses
Mean number of bedrooms in renter occupied houses
Median number of vehichles in owner occupied houses
Mean number of vehichles in owner occupied houses
Median number of vehichles in renter occupied houses
Mean number of vehichles in renter occupied houses
Mortgage status - with mortgage (%)
Mortgage status - with second mortgage (%)
Mortgage status - with home equity loan (%)
Mortgage status - with both second mortgage and home equity loan (%)
Mortgage status - without a mortgage (%)
Average family size
Average family size - White
Average family size - Black or African American
Average family size - Asian
Average family size - Hispanic or Latino
Average family size - American Indian and Alaska Native
Average family size - Multirace
Average family size - Other Race
Geographical mobility - Same house 1 year ago (%)
Geographical mobility - Moved within same county (%)
Geographical mobility - Moved from different county within same state (%)
Geographical mobility - Moved from different state (%)
Geographical mobility - Moved from abroad (%)
Place of birth - Born in state of residence (%)
Place of birth - Born in other state (%)
Place of birth - Native, outside of US (%)
Place of birth - Foreign born (%)
Housing units in structures - 1, detached (%)
Housing units in structures - 1, attached (%)
Housing units in structures - 2 (%)
Housing units in structures - 3 or 4 (%)
Housing units in structures - 5 to 9 (%)
Housing units in structures - 10 to 19 (%)
Housing units in structures - 20 to 49 (%)
Housing units in structures - 50 or more (%)
Housing units in structures - Mobile home (%)
Housing units in structures - Boat, RV, van, etc. (%)
House/condo owner moved in on average (years ago)
Renter moved in on average (years ago)
Year householder moved into unit - Moved in 1999 to March 2000 (%)
Year householder moved into unit - Moved in 1995 to 1998 (%)
Year householder moved into unit - Moved in 1990 to 1994 (%)
Year householder moved into unit - Moved in 1980 to 1989 (%)
Year householder moved into unit - Moved in 1970 to 1979 (%)
Year householder moved into unit - Moved in 1969 or earlier (%)
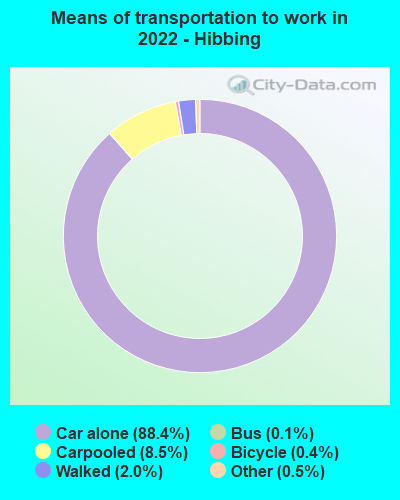
Means of transportation to work - Drove car alone (%)
Means of transportation to work - Carpooled (%)
Means of transportation to work - Public transportation (%)
Means of transportation to work - Bus or trolley bus (%)
Means of transportation to work - Streetcar or trolley car (%)
Means of transportation to work - Subway or elevated (%)
Means of transportation to work - Railroad (%)
Means of transportation to work - Ferryboat (%)
Means of transportation to work - Taxicab (%)
Means of transportation to work - Motorcycle (%)
Means of transportation to work - Bicycle (%)
Means of transportation to work - Walked (%)
Means of transportation to work - Other means (%)
Working at home (%)
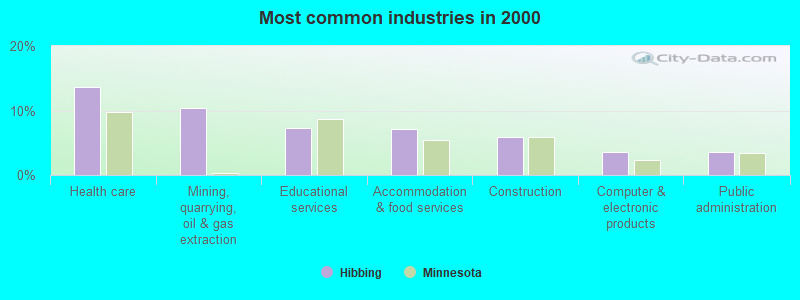
Industry diversity
Most Common Industries - Agriculture, forestry, fishing and hunting, and mining (%)
Most Common Industries - Agriculture, forestry, fishing and hunting (%)
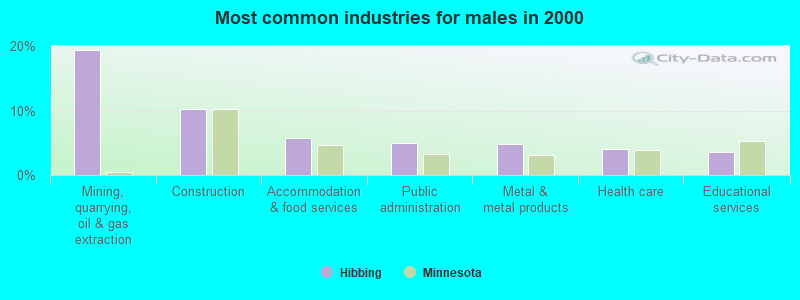
Most Common Industries - Mining, quarrying, and oil and gas extraction (%)
Most Common Industries - Construction (%)
Most Common Industries - Manufacturing (%)
Most Common Industries - Wholesale trade (%)
Most Common Industries - Retail trade (%)
Most Common Industries - Transportation and warehousing, and utilities (%)
Most Common Industries - Transportation and warehousing (%)
Most Common Industries - Utilities (%)
Most Common Industries - Information (%)
Most Common Industries - Finance and insurance, and real estate and rental and leasing (%)
Most Common Industries - Finance and insurance (%)
Most Common Industries - Real estate and rental and leasing (%)
Most Common Industries - Professional, scientific, and management, and administrative and waste management services (%)
Most Common Industries - Professional, scientific, and technical services (%)
Most Common Industries - Management of companies and enterprises (%)
Most Common Industries - Administrative and support and waste management services (%)
Most Common Industries - Educational services, and health care and social assistance (%)
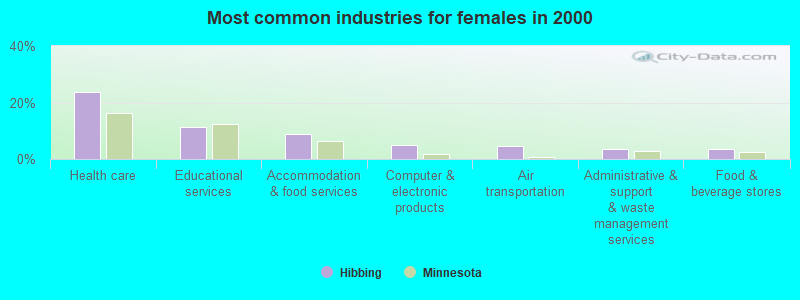
Most Common Industries - Educational services (%)
Most Common Industries - Health care and social assistance (%)
Most Common Industries - Arts, entertainment, and recreation, and accommodation and food services (%)
Most Common Industries - Arts, entertainment, and recreation (%)
Most Common Industries - Accommodation and food services (%)
Most Common Industries - Other services, except public administration (%)
Most Common Industries - Public administration (%)
Occupation diversity
Most Common Occupations - Management, business, science, and arts occupations (%)
Most Common Occupations - Management, business, and financial occupations (%)
Most Common Occupations - Management occupations (%)
Most Common Occupations - Business and financial operations occupations (%)
Most Common Occupations - Computer, engineering, and science occupations (%)
Most Common Occupations - Computer and mathematical occupations (%)
Most Common Occupations - Architecture and engineering occupations (%)
Most Common Occupations - Life, physical, and social science occupations (%)
Most Common Occupations - Education, legal, community service, arts, and media occupations (%)
Most Common Occupations - Community and social service occupations (%)
Most Common Occupations - Legal occupations (%)
Most Common Occupations - Education, training, and library occupations (%)
Most Common Occupations - Arts, design, entertainment, sports, and media occupations (%)
Most Common Occupations - Healthcare practitioners and technical occupations (%)
Most Common Occupations - Health diagnosing and treating practitioners and other technical occupations (%)
Most Common Occupations - Health technologists and technicians (%)
Most Common Occupations - Service occupations (%)
Most Common Occupations - Healthcare support occupations (%)
Most Common Occupations - Protective service occupations (%)
Most Common Occupations - Fire fighting and prevention, and other protective service workers including supervisors (%)
Most Common Occupations - Law enforcement workers including supervisors (%)
Most Common Occupations - Food preparation and serving related occupations (%)
Most Common Occupations - Building and grounds cleaning and maintenance occupations (%)
Most Common Occupations - Personal care and service occupations (%)
Most Common Occupations - Sales and office occupations (%)
Most Common Occupations - Sales and related occupations (%)
Most Common Occupations - Office and administrative support occupations (%)
Most Common Occupations - Natural resources, construction, and maintenance occupations (%)
Most Common Occupations - Farming, fishing, and forestry occupations (%)
Most Common Occupations - Construction and extraction occupations (%)
Most Common Occupations - Installation, maintenance, and repair occupations (%)
Most Common Occupations - Production, transportation, and material moving occupations (%)
Most Common Occupations - Production occupations (%)
Most Common Occupations - Transportation occupations (%)
Most Common Occupations - Material moving occupations (%)
People in Group quarters - Institutionalized population (%)
People in Group quarters - Correctional institutions (%)
People in Group quarters - Federal prisons and detention centers (%)
People in Group quarters - Halfway houses (%)
People in Group quarters - Local jails and other confinement facilities (including police lockups) (%)
People in Group quarters - Military disciplinary barracks (%)
People in Group quarters - State prisons (%)
People in Group quarters - Other types of correctional institutions (%)
People in Group quarters - Nursing homes (%)
People in Group quarters - Hospitals/wards, hospices, and schools for the handicapped (%)
People in Group quarters - Hospitals/wards and hospices for chronically ill (%)
People in Group quarters - Hospices or homes for chronically ill (%)
People in Group quarters - Military hospitals or wards for chronically ill (%)
People in Group quarters - Other hospitals or wards for chronically ill (%)
People in Group quarters - Hospitals or wards for drug/alcohol abuse (%)
People in Group quarters - Mental (Psychiatric) hospitals or wards (%)
People in Group quarters - Schools, hospitals, or wards for the mentally retarded (%)
People in Group quarters - Schools, hospitals, or wards for the physically handicapped (%)
People in Group quarters - Institutions for the deaf (%)
People in Group quarters - Institutions for the blind (%)
People in Group quarters - Orthopedic wards and institutions for the physically handicapped (%)
People in Group quarters - Wards in general hospitals for patients who have no usual home elsewhere (%)
People in Group quarters - Wards in military hospitals for patients who have no usual home elsewhere (%)
People in Group quarters - Juvenile institutions (%)
People in Group quarters - Long-term care (%)
People in Group quarters - Homes for abused, dependent, and neglected children (%)
People in Group quarters - Residential treatment centers for emotionally disturbed children (%)
People in Group quarters - Training schools for juvenile delinquents (%)
People in Group quarters - Short-term care, detention or diagnostic centers for delinquent children (%)
People in Group quarters - Type of juvenile institution unknown (%)
People in Group quarters - Noninstitutionalized population (%)
People in Group quarters - College dormitories (includes college quarters off campus) (%)
People in Group quarters - Military quarters (%)
People in Group quarters - On base (%)
People in Group quarters - Barracks, unaccompanied personnel housing (UPH), (Enlisted/Officer), ;and similar group living quarters for military personnel (%)
People in Group quarters - Transient quarters for temporary residents (%)
People in Group quarters - Military ships (%)
People in Group quarters - Group homes (%)
People in Group quarters - Homes or halfway houses for drug/alcohol abuse (%)
People in Group quarters - Homes for the mentally ill (%)
People in Group quarters - Homes for the mentally retarded (%)
People in Group quarters - Homes for the physically handicapped (%)
People in Group quarters - Other group homes (%)
People in Group quarters - Religious group quarters (%)
People in Group quarters - Dormitories (%)
People in Group quarters - Agriculture workers' dormitories on farms (%)
People in Group quarters - Job Corps and vocational training facilities (%)
People in Group quarters - Other workers' dormitories (%)
People in Group quarters - Crews of maritime vessels (%)
People in Group quarters - Other nonhousehold living situations (%)
People in Group quarters - Other noninstitutional group quarters (%)
Residents speaking English at home (%)
Residents speaking English at home - Born in the United States (%)
Residents speaking English at home - Native, born elsewhere (%)
Residents speaking English at home - Foreign born (%)
Residents speaking Spanish at home (%)
Residents speaking Spanish at home - Born in the United States (%)
Residents speaking Spanish at home - Native, born elsewhere (%)
Residents speaking Spanish at home - Foreign born (%)
Residents speaking other language at home (%)
Residents speaking other language at home - Born in the United States (%)
Residents speaking other language at home - Native, born elsewhere (%)
Residents speaking other language at home - Foreign born (%)
Class of Workers - Employee of private company (%)
Class of Workers - Self-employed in own incorporated business (%)
Class of Workers - Private not-for-profit wage and salary workers (%)
Class of Workers - Local government workers (%)
Class of Workers - State government workers (%)
Class of Workers - Federal government workers (%)
Class of Workers - Self-employed workers in own not incorporated business and Unpaid family workers (%)
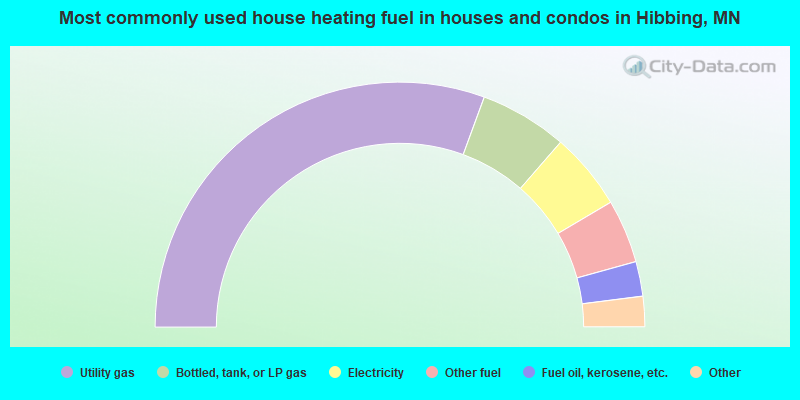
House heating fuel used in houses and condos - Utility gas (%)
House heating fuel used in houses and condos - Bottled, tank, or LP gas (%)
House heating fuel used in houses and condos - Electricity (%)
House heating fuel used in houses and condos - Fuel oil, kerosene, etc. (%)
House heating fuel used in houses and condos - Coal or coke (%)
House heating fuel used in houses and condos - Wood (%)
House heating fuel used in houses and condos - Solar energy (%)
House heating fuel used in houses and condos - Other fuel (%)
House heating fuel used in houses and condos - No fuel used (%)
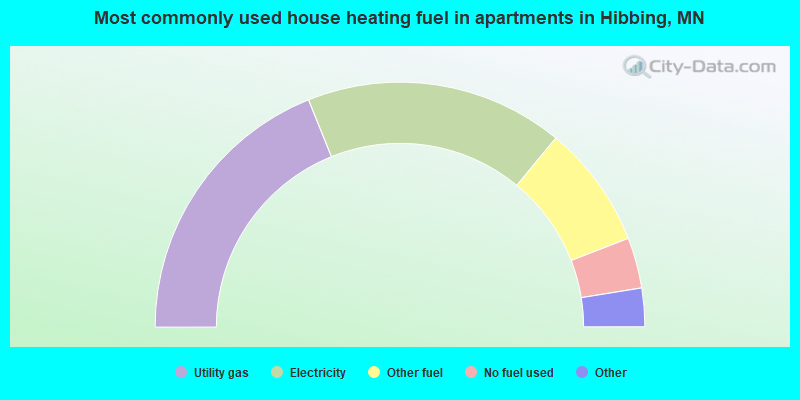
House heating fuel used in apartments - Utility gas (%)
House heating fuel used in apartments - Bottled, tank, or LP gas (%)
House heating fuel used in apartments - Electricity (%)
House heating fuel used in apartments - Fuel oil, kerosene, etc. (%)
House heating fuel used in apartments - Coal or coke (%)
House heating fuel used in apartments - Wood (%)
House heating fuel used in apartments - Solar energy (%)
House heating fuel used in apartments - Other fuel (%)
House heating fuel used in apartments - No fuel used (%)
Armed forces status - In Armed Forces (%)
Armed forces status - Civilian (%)
Armed forces status - Civilian - Veteran (%)
Armed forces status - Civilian - Nonveteran (%)
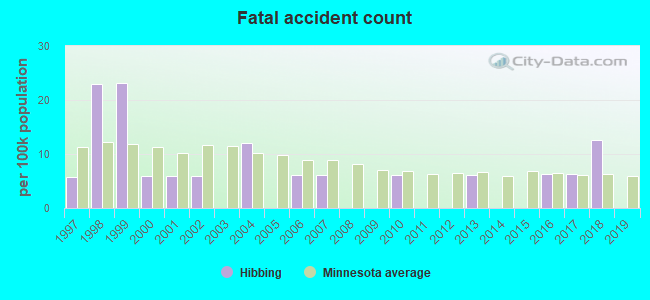
Fatal accidents locations in years 2005-2021
Fatal accidents locations in 2005
Fatal accidents locations in 2006
Fatal accidents locations in 2007
Fatal accidents locations in 2008
Fatal accidents locations in 2009
Fatal accidents locations in 2010
Fatal accidents locations in 2011
Fatal accidents locations in 2012
Fatal accidents locations in 2013
Fatal accidents locations in 2014
Fatal accidents locations in 2015
Fatal accidents locations in 2016
Fatal accidents locations in 2017
Fatal accidents locations in 2018
Fatal accidents locations in 2019
Fatal accidents locations in 2020
Fatal accidents locations in 2021
Alcohol use - People drinking some alcohol every month (%)
Alcohol use - People not drinking at all (%)
Alcohol use - Average days/month drinking alcohol
Alcohol use - Average drinks/week
Alcohol use - Average days/year people drink much
Audiometry - Average condition of hearing (%)
Audiometry - People that can hear a whisper from across a quiet room (%)
Audiometry - People that can hear normal voice from across a quiet room (%)
Audiometry - Ears ringing, roaring, buzzing (%)
Audiometry - Had a job exposure to loud noise (%)
Audiometry - Had off-work exposure to loud noise (%)
Blood Pressure & Cholesterol - Has high blood pressure (%)
Blood Pressure & Cholesterol - Checking blood pressure at home (%)
Blood Pressure & Cholesterol - Frequently checking blood cholesterol (%)
Blood Pressure & Cholesterol - Has high cholesterol level (%)
Consumer Behavior - Money monthly spent on food at supermarket/grocery store
Consumer Behavior - Money monthly spent on food at other stores
Consumer Behavior - Money monthly spent on eating out
Consumer Behavior - Money monthly spent on carryout/delivered foods
Consumer Behavior - Income spent on food at supermarket/grocery store (%)
Consumer Behavior - Income spent on food at other stores (%)
Consumer Behavior - Income spent on eating out (%)
Consumer Behavior - Income spent on carryout/delivered foods (%)
Current Health Status - General health condition (%)
Current Health Status - Blood donors (%)
Current Health Status - Has blood ever tested for HIV virus (%)
Current Health Status - Left-handed people (%)
Dermatology - People using sunscreen (%)
Diabetes - Diabetics (%)
Diabetes - Had a blood test for high blood sugar (%)
Diabetes - People taking insulin (%)
Diet Behavior & Nutrition - Diet health (%)
Diet Behavior & Nutrition - Milk product consumption (# of products/month)
Diet Behavior & Nutrition - Meals not home prepared (#/week)
Diet Behavior & Nutrition - Meals from fast food or pizza place (#/week)
Diet Behavior & Nutrition - Ready-to-eat foods (#/month)
Diet Behavior & Nutrition - Frozen meals/pizza (#/month)
Drug Use - People that ever used marijuana or hashish (%)
Drug Use - Ever used hard drugs (%)
Drug Use - Ever used any form of cocaine (%)
Drug Use - Ever used heroin (%)
Drug Use - Ever used methamphetamine (%)
Health Insurance - People covered by health insurance (%)
Kidney Conditions-Urology - Avg. # of times urinating at night
Medical Conditions - People with asthma (%)
Medical Conditions - People with anemia (%)
Medical Conditions - People with psoriasis (%)
Medical Conditions - People with overweight (%)
Medical Conditions - Elderly people having difficulties in thinking or remembering (%)
Medical Conditions - People who ever received blood transfusion (%)
Medical Conditions - People having trouble seeing even with glass/contacts (%)
Medical Conditions - People with arthritis (%)
Medical Conditions - People with gout (%)
Medical Conditions - People with congestive heart failure (%)
Medical Conditions - People with coronary heart disease (%)
Medical Conditions - People with angina pectoris (%)
Medical Conditions - People who ever had heart attack (%)
Medical Conditions - People who ever had stroke (%)
Medical Conditions - People with emphysema (%)
Medical Conditions - People with thyroid problem (%)
Medical Conditions - People with chronic bronchitis (%)
Medical Conditions - People with any liver condition (%)
Medical Conditions - People who ever had cancer or malignancy (%)
Mental Health - People who have little interest in doing things (%)
Mental Health - People feeling down, depressed, or hopeless (%)
Mental Health - People who have trouble sleeping or sleeping too much (%)
Mental Health - People feeling tired or having little energy (%)
Mental Health - People with poor appetite or overeating (%)
Mental Health - People feeling bad about themself (%)
Mental Health - People who have trouble concentrating on things (%)
Mental Health - People moving or speaking slowly or too fast (%)
Mental Health - People having thoughts they would be better off dead (%)
Oral Health - Average years since last visit a dentist
Oral Health - People embarrassed because of mouth (%)
Oral Health - People with gum disease (%)
Oral Health - General health of teeth and gums (%)
Oral Health - Average days a week using dental floss/device
Oral Health - Average days a week using mouthwash for dental problem
Oral Health - Average number of teeth
Pesticide Use - Households using pesticides to control insects (%)
Pesticide Use - Households using pesticides to kill weeds (%)
Physical Activity - People doing vigorous-intensity work activities (%)
Physical Activity - People doing moderate-intensity work activities (%)
Physical Activity - People walking or bicycling (%)
Physical Activity - People doing vigorous-intensity recreational activities (%)
Physical Activity - People doing moderate-intensity recreational activities (%)
Physical Activity - Average hours a day doing sedentary activities
Physical Activity - Average hours a day watching TV or videos
Physical Activity - Average hours a day using computer
Physical Functioning - People having limitations keeping them from working (%)
Physical Functioning - People limited in amount of work they can do (%)
Physical Functioning - People that need special equipment to walk (%)
Physical Functioning - People experiencing confusion/memory problems (%)
Physical Functioning - People requiring special healthcare equipment (%)
Prescription Medications - Average number of prescription medicines taking
Preventive Aspirin Use - Adults 40+ taking low-dose aspirin (%)
Reproductive Health - Vaginal deliveries (%)
Reproductive Health - Cesarean deliveries (%)
Reproductive Health - Deliveries resulted in a live birth (%)
Reproductive Health - Pregnancies resulted in a delivery (%)
Reproductive Health - Women breastfeeding newborns (%)
Reproductive Health - Women that had a hysterectomy (%)
Reproductive Health - Women that had both ovaries removed (%)
Reproductive Health - Women that have ever taken birth control pills (%)
Reproductive Health - Women taking birth control pills (%)
Reproductive Health - Women that have ever used Depo-Provera or injectables (%)
Reproductive Health - Women that have ever used female hormones (%)
Sexual Behavior - People 18+ that ever had sex (vaginal, anal, or oral) (%)
Sexual Behavior - Males 18+ that ever had vaginal sex with a woman (%)
Sexual Behavior - Males 18+ that ever performed oral sex on a woman (%)
Sexual Behavior - Males 18+ that ever had anal sex with a woman (%)
Sexual Behavior - Males 18+ that ever had any sex with a man (%)
Sexual Behavior - Females 18+ that ever had vaginal sex with a man (%)
Sexual Behavior - Females 18+ that ever performed oral sex on a man (%)
Sexual Behavior - Females 18+ that ever had anal sex with a man (%)
Sexual Behavior - Females 18+ that ever had any kind of sex with a woman (%)
Sexual Behavior - Average age people first had sex
Sexual Behavior - Average number of female sex partners in lifetime (males 18+)
Sexual Behavior - Average number of female vaginal sex partners in lifetime (males 18+)
Sexual Behavior - Average age people first performed oral sex on a woman (18+)
Sexual Behavior - Average number of woman performed oral sex on in lifetime (18+)
Sexual Behavior - Average number of male sex partners in lifetime (males 18+)
Sexual Behavior - Average number of male anal sex partners in lifetime (males 18+)
Sexual Behavior - Average age people first performed oral sex on a man (18+)
Sexual Behavior - Average number of male oral sex partners in lifetime (18+)
Sexual Behavior - People using protection when performing oral sex (%)
Sexual Behavior - Average number of times people have vaginal or anal sex a year
Sexual Behavior - People having sex without condom (%)
Sexual Behavior - Average number of male sex partners in lifetime (females 18+)
Sexual Behavior - Average number of male vaginal sex partners in lifetime (females 18+)
Sexual Behavior - Average number of female sex partners in lifetime (females 18+)
Sexual Behavior - Circumcised males 18+ (%)
Sleep Disorders - Average hours sleeping at night
Sleep Disorders - People that has trouble sleeping (%)
Smoking-Cigarette Use - People smoking cigarettes (%)
Taste & Smell - People 40+ having problems with smell (%)
Taste & Smell - People 40+ having problems with taste (%)
Taste & Smell - People 40+ that ever had wisdom teeth removed (%)
Taste & Smell - People 40+ that ever had tonsils teeth removed (%)
Taste & Smell - People 40+ that ever had a loss of consciousness because of a head injury (%)
Taste & Smell - People 40+ that ever had a broken nose or other serious injury to face or skull (%)
Taste & Smell - People 40+ that ever had two or more sinus infections (%)
Weight - Average height (inches)
Weight - Average weight (pounds)
Weight - Average BMI
Weight - People that are obese (%)
Weight - People that ever were obese (%)
Weight - People trying to lose weight (%)
Officers per 1,000 residents here:
1.79Minnesota average:
1.76
Latest news from Hibbing, MN collected exclusively by city-data.com from local newspapers, TV, and radio stations
Ancestries: German (15.0%), Finnish (13.3%), Norwegian (9.3%), Irish (8.1%), English (7.4%), Italian (6.6%).
Current Local Time:
Land area: 181.7 square miles.
Population density: 88 people per square mile (very low).
346 residents are foreign born (1.5% Africa , 0.3% Latin America ).
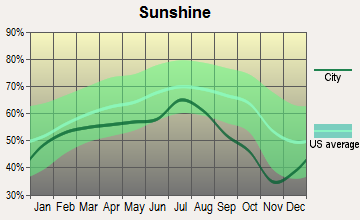
This city:
2.1%Minnesota:
8.5%
Median real estate property taxes paid for housing units with mortgages in 2022: $1,067 (0.8%)Median real estate property taxes paid for housing units with no mortgage in 2022: $1,151 (0.9%)
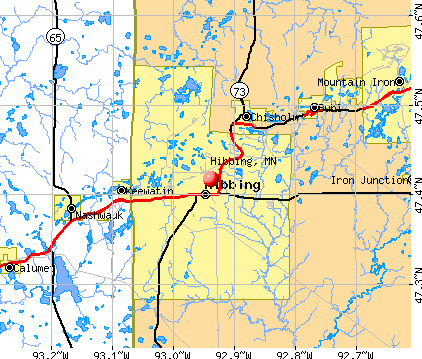
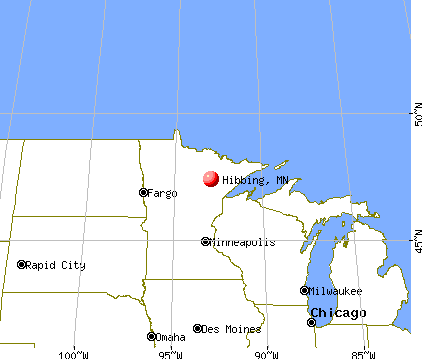
Nearest city with pop. 50,000+: Duluth, MN
Nearest city with pop. 200,000+: Minneapolis, MN
Nearest city with pop. 1,000,000+: Chicago, IL
Nearest cities:
Kinney, MN (3.4 miles),
Iron Junction, MN (4.0 miles),
Latitude: 47.42 N, Longitude: 92.94 W
Daytime population change due to commuting: +1,211 (+7.5%)Workers who live and work in this city: 4,221 (60.3%)
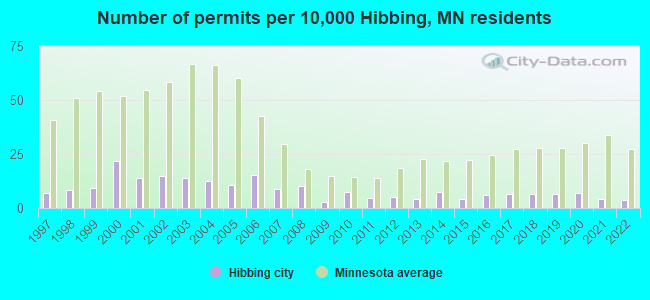
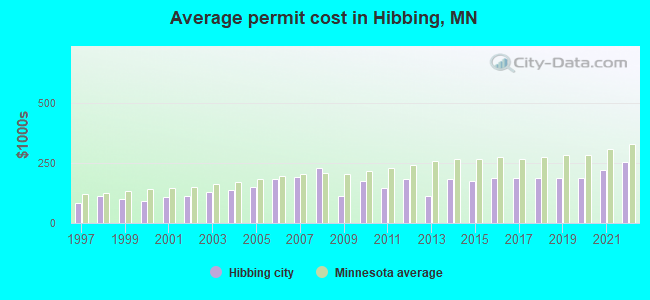
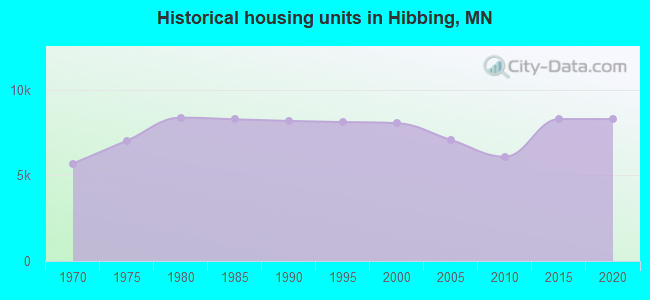
Single-family new house construction building permits:
2022: 6 buildings , average cost: $253,9002021: 7 buildings , average cost: $222,1002020: 12 buildings , average cost: $188,6002019: 11 buildings , average cost: $188,6002018: 11 buildings , average cost: $188,6002017: 11 buildings , average cost: $188,6002016: 10 buildings , average cost: $188,6002015: 7 buildings , average cost: $176,7002014: 13 buildings , average cost: $181,7002013: 7 buildings , average cost: $112,9002012: 9 buildings , average cost: $182,3002011: 8 buildings , average cost: $145,0002010: 13 buildings , average cost: $177,3002009: 5 buildings , average cost: $115,2002008: 17 buildings , average cost: $231,8002007: 15 buildings , average cost: $194,0002006: 26 buildings , average cost: $182,7002005: 18 buildings , average cost: $151,5002004: 21 buildings , average cost: $135,6002003: 24 buildings , average cost: $127,9002002: 25 buildings , average cost: $114,9002001: 24 buildings , average cost: $106,8002000: 37 buildings , average cost: $93,9001999: 16 buildings , average cost: $102,1001998: 14 buildings , average cost: $111,0001997: 12 buildings , average cost: $84,100Unemployment in December 2023:
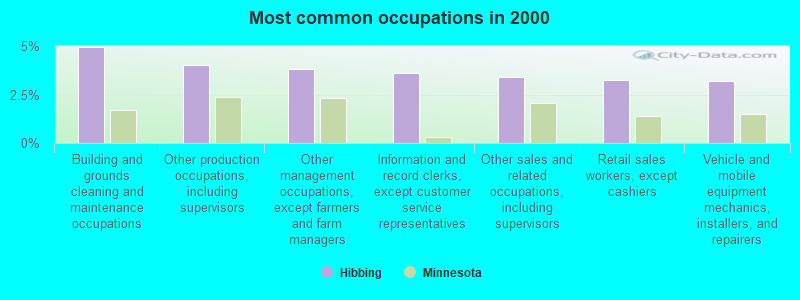
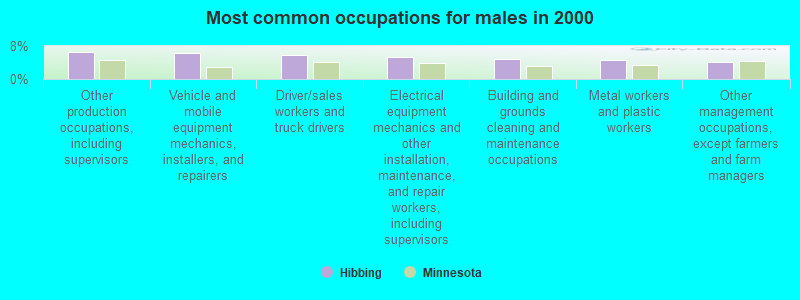
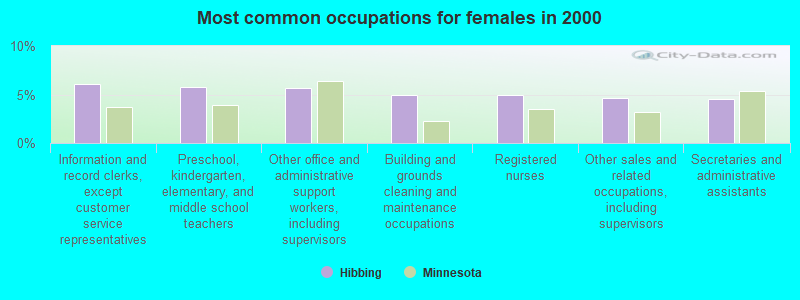
Most common occupations in Hibbing, MN (%)
Both Males Females
Building and grounds cleaning and maintenance occupations (5.0%)
Other production occupations, including supervisors (4.0%)
Other management occupations, except farmers and farm managers (3.8%)
Information and record clerks, except customer service representatives (3.6%)
Other sales and related occupations, including supervisors (3.4%)
Retail sales workers, except cashiers (3.3%)
Vehicle and mobile equipment mechanics, installers, and repairers (3.2%)
Other production occupations, including supervisors (6.5%)
Vehicle and mobile equipment mechanics, installers, and repairers (6.3%)
Driver/sales workers and truck drivers (5.9%)
Electrical equipment mechanics and other installation, maintenance, and repair workers, including supervisors (5.4%)
Building and grounds cleaning and maintenance occupations (4.9%)
Metal workers and plastic workers (4.6%)
Other management occupations, except farmers and farm managers (4.2%)
Information and record clerks, except customer service representatives (6.1%)
Preschool, kindergarten, elementary, and middle school teachers (5.7%)
Other office and administrative support workers, including supervisors (5.7%)
Building and grounds cleaning and maintenance occupations (5.0%)
Registered nurses (5.0%)
Other sales and related occupations, including supervisors (4.6%)
Secretaries and administrative assistants (4.6%)
Tornado activity:
Hibbing-area historical tornado activity is significantly below Minnesota state average. It is 75% smaller than the overall U.S. average.
On 8/6/1969, a category F3 (max. wind speeds 158-206 mph) tornado 13.6 miles away from the Hibbing city center injured 9 people and caused between $500,000 and $5,000,000 in damages.
On 6/11/1966, a category F4 (max. wind speeds 207-260 mph) tornado 40.9 miles away from the city center caused between $50,000 and $500,000 in damages.
Earthquake activity:
Hibbing-area historical earthquake activity is significantly above Minnesota state average. It is 60% smaller than the overall U.S. average. On 7/9/1975 at 14:54:15, a magnitude 4.6 (4.6 MB, Class: Light, Intensity: IV - V) earthquake occurred 190.8 miles away from Hibbing center On 2/7/2020 at 18:30:28, a magnitude 3.3 (3.3 ML, Class: Light, Intensity: II - III) earthquake occurred 10.8 miles away from Hibbing center On 1/9/2020 at 18:16:48, a magnitude 3.3 (3.3 MB) earthquake occurred 15.1 miles away from Hibbing center On 4/8/2020 at 17:14:33, a magnitude 3.3 (3.3 ML) earthquake occurred 17.3 miles away from the city center On 5/14/2019 at 17:00:01, a magnitude 3.2 (3.2 MB) earthquake occurred 7.0 miles away from Hibbing center On 2/28/2020 at 18:25:12, a magnitude 3.2 (3.2 ML) earthquake occurred 16.1 miles away from the city center Magnitude types: body-wave magnitude (MB), local magnitude (ML) Natural disasters: The number of natural disasters in St. Louis County (3) is a lot smaller than the US average (15).Floods: 2, Storms: 2, Tornado: 1, Wind: 1, Other: 1 (Note: some incidents may be assigned to more than one category). Hospitals and medical centers in Hibbing: RANGE CENTER - ASPENWOOD HOME (1820 EAST 39TH STREET) RANGE CENTER - MAPLEVIEW HOME (506 WEST 47TH ST) UNIVERSITY MEDICAL CENTER-MESABI/ MESABA CLINICS (Voluntary non-profit - Other, 750 EAST 34TH ST) GOLDEN CREST HEALTHCARE CENTER (2413 FIRST AVENUE)
GUARDIAN ANGELS HEALTH AND REHAB CENTER (1500 EAST THIRD AVENUE)
FRESENIUS MEDICAL CARE OF HIBBING (750 E 34TH ST)
HEALTHLINE HOMECARE (MESABI MALL 1101 EAST 37TH ST)
HOME CARE SPECIALISTS (101 EAST HOWARD STREET)
Colleges/Universities in Hibbing: Hibbing Community College Full-time enrollment: 1,129; Location: 1515 E 25th St; Public; Website: www.hibbing.edu)
Cosmetology Careers Unlimited College of Hair Skin and Nails Full-time enrollment: 49; Location: 2534 E. Beltline; Private, for-profit; Website: www.coscareers.com)
Colleges/universities with over 2000 students nearest to Hibbing:
The College of Saint Scholastica (about 58 miles; Duluth, MN ; Full-time enrollment: 3,762)
Lake Superior College (about 58 miles; Duluth, MN ; FT enrollment: 3,768)
University of Minnesota-Duluth (about 58 miles; Duluth, MN ; FT enrollment: 10,612)
University of Wisconsin-Superior (about 63 miles; Superior, WI ; FT enrollment: 2,302)
Bemidji State University (about 91 miles; Bemidji, MN ; FT enrollment: 4,316)
Central Lakes College-Brainerd (about 96 miles; Brainerd, MN ; FT enrollment: 3,371)
Wisconsin Indianhead Technical College (about 126 miles; Shell Lake, WI ; FT enrollment: 2,414)
Public high schools in Hibbing:
Private high school in Hibbing:
Public elementary/middle schools in Hibbing:
Private elementary/middle school in Hibbing:
See full list of schools located in Hibbing Library in Hibbing: HIBBING PUBLIC LIBRARY Operating income: $842,758; Location: 2020 EAST 5TH AVENUE; 68,279 books ; 15,555 e-books ; 4,649 audio materials ; 4,518 video materials ; 7 local licensed databases ; 14 state licensed databases ; 4 other licensed databases ; 156 print serial subscriptions ; 9 electronic serial subscriptions )
Notable locations in Hibbing: (A) , Three Way Watershed Marker (B) , Saint Louis County Landfill (C) , Mesaba Country Club (D) , Wilpen Station (E) , Redore Station (F) , Forest Heights RV and Mobile Park (G) , Hibbing Station (H) , Saint Louis County Fairgrounds (I) , Hull Rust Mine View (J) , Hibbing Municipal Golf Course (K) , Kelly Lake Station (L) , Saint Louis County Sheriffs Office (M) , Hibbing Police Department (N) , Hibbing Fire Department Station 1 (O) , Hibbing City Hall (P) , Hibbing Public Library (Q) , Hibbing Historical Society and Museum (R) , Saint Louis County Courthouse (S) , Hibbing Fire Department Station 3 (T) . Display/hide their locations on the map
Shopping Centers: (1) , Mesabi Mall (2) . Display/hide their locations on the map
Churches in Hibbing include: (A) , Jehovah's Witnesses Hall (B) , Hibbing Christian Assembly (C) , First Presbyterian Church (D) , First Lutheran Church of Hibbing (E) , Christian and Missionary Church (F) , Immaculate Conception Church (G) , Grace Lutheran Church (H) , Saint James Episcopal Church (I) . Display/hide their locations on the map
Cemeteries: (1) , Maple Hill Cemetery (2) , Little Swan Cemetery (3) , Grandview Memorial Garden (4) , Hibbing Park Cemetery (5) . Display/hide their locations on the map
Lakes and reservoirs: (A) , Carey Lake (B) , Day Lake (C) , Harriett Lake (D) , Kelly Lake (E) , Kleffman Lake (F) , Little Harriett Lake (G) , Mahoning Lakes (H) . Display/hide their locations on the map
Creeks: (A) , Deer Creek (B) , Rock Lake Creek (C) , Carey Creek (D) , Barber Creek (E) . Display/hide their locations on the map
Parks in Hibbing include: (1) , Bryan Lake Park (2) , Hull-Rust-Mahoning Mine Historical Marker (3) , Geology of the Mesabi Region Geological Marker (4) , Bennett Park Geological Marker (5) , Bennett Park (6) , Hibbing Park (7) , Sargent Park (8) . Display/hide their locations on the map
Tourist attractions: (1) , Greyhound Bus Museum (1201 Greyhound Boulevard) (2) , Paulucci Space Theatre (Cultural Attractions- Events- & Facilities; 1502 East 23rd Street) (3) , Hibbing Area Chamber of Commerce (211 East Howard Street) (4) , Hull-Rust Mahoning Mine View BLDG (401 Penobscot Road) (5) . Display/hide their approximate locations on the map
Hotels: (1) , Stover House (2113 5th Avenue East) (2) , Arrowhead Apartments (3701 2nd Avenue West) (3) , Hibbing Super 8 Motel (1411 E 40th St) (4) , Adams House Bed & Breakfast (201 East 23rd Street) (5) , Star Motel (3901 1st Avenue) (6) , Days Inn (1520 East Highway 37) (7) , Super 8 Hibbing MN (1411 East 40th Street) (8) . Display/hide their approximate locations on the map
Birthplace of: Kevin McHale - Basketball player, John Anderson (baseball coach) - Baseball player and coach, Roger Maris, Bruce A. Carlson - Air Force general, Kelly Fairchild - Ice hockey player, Mike Colalillo - Army Medal of Honor recipient, Rudy Perpich - Politician, Timothy Murphy (poet) - Poet, Bethany McLean - Journalist, John Kriesel - Politician.
St. Louis County has a predicted average indoor radon screening level between 2 and 4 pCi/L (pico curies per liter) - Moderate Potential Drinking water stations with addresses in Hibbing and their reported violations in the past:
HIBBING (Population served: 22,000, Groundwater):
Past monitoring violations:
Monitoring and Reporting (DBP) - Between APR-2011 and JUN-2011, Contaminant: Chlorine. Follow-up actions: St Compliance achieved (JUN-01-2011), St Formal NOV issued (JUN-30-2011), St Public Notif requested (JUN-30-2011), St Public Notif received (JUL-11-2011)
Average household size: This city:
2.2 peopleMinnesota:
2.5 people
Percentage of family households: This city:
58.3%Whole state:
64.6%
Percentage of households with unmarried partners: This city:
7.5%Whole state:
6.9%
Likely homosexual households (counted as self-reported same-sex unmarried-partner households)
Lesbian couples: 0.2% of all households Gay men: 0.1% of all households
People in group quarters in Hibbing in 2010:
115 people in nursing facilities/skilled-nursing facilities
76 people in college/university student housing
41 people in group homes intended for adults
19 people in workers' group living quarters and job corps centers
7 people in local jails and other municipal confinement facilities
5 people in other noninstitutional facilities
4 people in group homes for juveniles (non-correctional)
People in group quarters in Hibbing in 2000:
316 people in nursing homes
19 people in hospitals/wards and hospices for chronically ill
19 people in other hospitals or wards for chronically ill
14 people in hospitals or wards for drug/alcohol abuse
12 people in homes for the mentally retarded
6 people in other noninstitutional group quarters
4 people in local jails and other confinement facilities (including police lockups)
2 people in religious group quarters
Banks with branches in Hibbing (2011 data):
American Bank of the North: Wal-Mart Super Center, Howard Branch, Hibbing Downtown Branch. Info updated 2006/11/03: Bank assets: $622.9 mil, Deposits: $567.2 mil, headquarters in Nashwauk, MN, negative income in the last year , Commercial Lending Specialization, 19 total offices , Holding Company: Mesaba Bancshares, Inc.
U.S. Bank National Association: Hibbing Branch at 211 East Howard Street, branch established on 1901/12/14. Info updated 2012/01/30: Bank assets: $330,470.8 mil, Deposits: $236,091.5 mil, headquarters in Cincinnati, OH, positive income , 3121 total offices , Holding Company: U.S. Bancorp
Security State Bank of Hibbing: Security State Bank Of Hibbing at 701 East Howard Street, branch established on 1911/02/11. Info updated 2006/11/03: Bank assets: $98.9 mil, Deposits: $87.1 mil, local headquarters , positive income , Commercial Lending Specialization, 1 total offices , Holding Company: Security Financial Services, Inc.
Wells Fargo Bank, National Association: Hibbing Branch at 301 East Howard Street, branch established on 1902/12/31. Info updated 2011/04/05: Bank assets: $1,161,490.0 mil, Deposits: $905,653.0 mil, headquarters in Sioux Falls, SD, positive income , 6395 total offices , Holding Company: Wells Fargo & Company
Republic Bank, Inc.: Hibbing Branch at 2521 First Avenue, branch established on 1999/11/02. Info updated 2006/11/03: Bank assets: $314.8 mil, Deposits: $266.4 mil, headquarters in Duluth, MN, positive income , Commercial Lending Specialization, 7 total offices , Holding Company: Republic Bancshares, Inc.
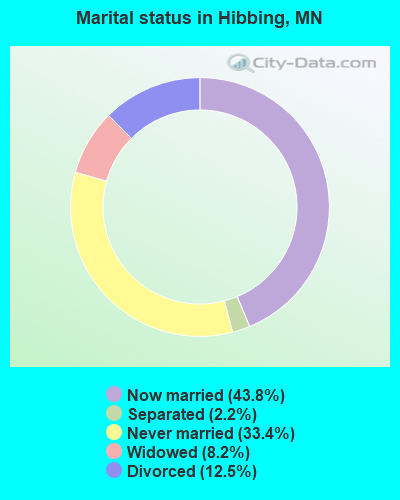
For population 15 years and over in Hibbing:
Never married: 33.4%Now married: 43.8%Separated: 2.2%Widowed: 8.2%Divorced: 12.5% For population 25 years and over in Hibbing:
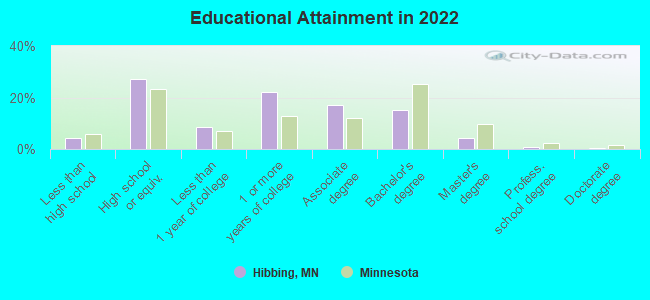
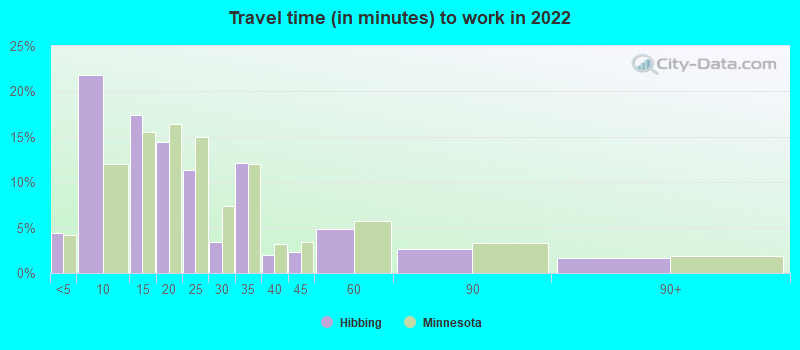
High school or higher: 94.8%Bachelor's degree or higher: 20.2%Graduate or professional degree: 5.1%Unemployed: 5.2%Mean travel time to work (commute): 15.3 minutes
Education Gini index (Inequality in education) Here:
8.2Minnesota average:
10.9
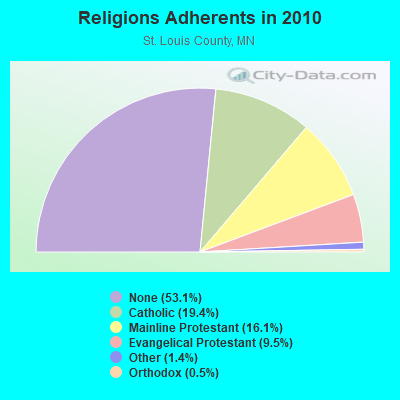
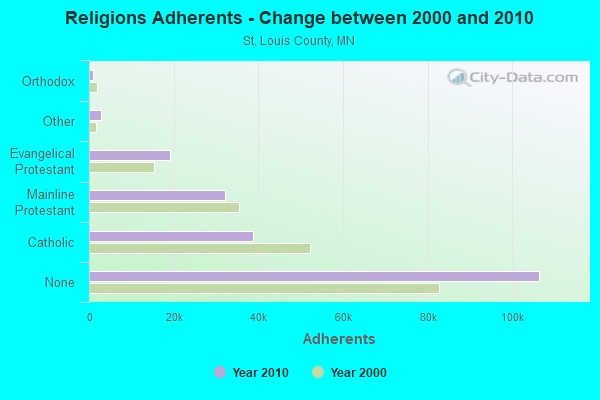
Religion statistics for Hibbing, MN (based on St. Louis County data)
Religion Adherents Congregations Catholic 38,757 36 Mainline Protestant 32,143 91 Evangelical Protestant 19,017 118 Other 2,760 20 Orthodox 976 6 Black Protestant 177 1 None 106,396 -
Source: Clifford Grammich, Kirk Hadaway, Richard Houseal, Dale E.Jones, Alexei Krindatch, Richie Stanley and Richard H.Taylor. 2012. 2010 U.S.Religion Census: Religious Congregations & Membership Study. Association of Statisticians of American Religious Bodies. Jones, Dale E., et al. 2002. Congregations and Membership in the United States 2000. Nashville, TN: Glenmary Research Center. Graphs represent county-level data
Food Environment Statistics: Number of grocery stores : 39St. Louis County :
1.99 / 10,000 pop.Minnesota :
1.83 / 10,000 pop.
Number of supercenters and club stores : 2Here :
0.10 / 10,000 pop.Minnesota :
0.13 / 10,000 pop.
Number of convenience stores (no gas) : 2Here :
0.10 / 10,000 pop.Minnesota :
0.49 / 10,000 pop.
Number of convenience stores (with gas) : 106This county :
5.40 / 10,000 pop.Minnesota :
3.90 / 10,000 pop.
Number of full-service restaurants : 176St. Louis County :
8.96 / 10,000 pop.Minnesota :
6.98 / 10,000 pop.
Adult diabetes rate : St. Louis County :
6.7%State :
6.5%
Adult obesity rate : St. Louis County :
25.3%Minnesota :
25.9%
Low-income preschool obesity rate : St. Louis County :
11.3%State :
13.0%
Health and Nutrition: Healthy diet rate : Hibbing:
51.3%Minnesota:
50.6%
Average overall health of teeth and gums : This city:
49.2%Minnesota:
48.4%
People feeling badly about themselves : This city:
21.7%State:
21.0%
People not drinking alcohol at all : Hibbing:
9.4%Minnesota:
9.8%
Average hours sleeping at night : This city:
6.8Minnesota:
6.8
General health condition : Hibbing:
57.5%Minnesota:
57.7%
Average condition of hearing : Hibbing:
77.5%Minnesota:
79.3%
More about Health and Nutrition of Hibbing, MN Residents
Local government employment and payroll (March 2022)
Function
Full-time employees
Monthly full-time payroll
Average yearly full-time wage
Part-time employees
Monthly part-time payroll
Other and Unallocable
51 $305,953 $71,989 0 $0 Police Protection - Officers
29 $187,155 $77,443 0 $0 Firefighters
25 $160,267 $76,928 12 $5,965 Streets and Highways
20 $104,359 $62,615 0 $0 Sewerage
16 $124,322 $93,242 0 $0 Parks and Recreation
13 $65,763 $60,704 3 $1,935 Solid Waste Management
9 $42,345 $56,460 0 $0 Local Libraries
6 $23,419 $46,838 4 $2,333 Financial Administration
6 $34,996 $69,992 0 $0 Airports
6 $39,702 $79,404 4 $7,813 Gas Supply
5 $46,500 $111,600 0 $0 Electric Power
5 $55,357 $132,857 0 $0 Water Supply
5 $46,500 $111,600 0 $0 Other Government Administration
3 $26,754 $107,016 13 $4,895 Police - Other
3 $13,605 $54,420 3 $4,185
Totals for Government
202 $1,276,997 $75,861 39 $27,127
Hibbing government finances - Expenditure in 2021 (per resident):
Construction - Regular Highways: $1,167,000 ($72.70)
Current Operations - Electric Utilities: $38,056,000 ($2370.79)
General - Other: $12,894,000 ($803.26)Gas Utilities: $5,271,000 ($328.37)Water Utilities: $4,876,000 ($303.76)Police Protection: $3,657,000 ($227.82)Sewerage: $2,942,000 ($183.28)Regular Highways: $2,836,000 ($176.68)Local Fire Protection: $2,389,000 ($148.83)Solid Waste Management: $2,347,000 ($146.21)Parks and Recreation: $2,081,000 ($129.64)Health - Other: $1,355,000 ($84.41)Financial Administration: $835,000 ($52.02)Libraries: $650,000 ($40.49)Transit Utilities: $391,000 ($24.36)Central Staff Services: $260,000 ($16.20)Miscellaneous Commercial Activities - Other: $231,000 ($14.39)Housing and Community Development: $30,000 ($1.87)General - Interest on Debt: $570,000 ($35.51)
Other Capital Outlay - Electric Utilities: $2,572,000 ($160.23)
Police Protection: $765,000 ($47.66)Regular Highways: $566,000 ($35.26)Sewerage: $556,000 ($34.64)Health - Other: $539,000 ($33.58)General - Other: $184,000 ($11.46)Parks and Recreation: $150,000 ($9.34)Solid Waste Management: $134,000 ($8.35)Miscellaneous Commercial Activities - Other: $54,000 ($3.36)Local Fire Protection: $13,000 ($0.81)Total Salaries and Wages: $2,199,000 ($136.99)
Hibbing government finances - Revenue in 2021 (per resident):
Charges - Other: $11,713,000 ($729.69)
Sewerage: $4,931,000 ($307.19)Solid Waste Management: $3,359,000 ($209.26)Parks and Recreation: $219,000 ($13.64)Miscellaneous Commercial Activities: $80,000 ($4.98)Housing and Community Development: $67,000 ($4.17)Federal Intergovernmental - Health and Hospitals: $1,240,000 ($77.25)
Highways: $291,000 ($18.13)Other: $162,000 ($10.09)Local Intergovernmental - Other: $715,000 ($44.54)
Miscellaneous - Interest Earnings: $608,000 ($37.88)
General Revenue - Other: $194,000 ($12.09)Fines and Forfeits: $138,000 ($8.60)Special Assessments: $35,000 ($2.18)Revenue - Electric Utilities: $29,504,000 ($1838.03)
Gas Utilities: $6,840,000 ($426.12)Water Utilities: $5,942,000 ($370.17)State Intergovernmental - General Local Government Support: $11,293,000 ($703.53)
Highways: $1,475,000 ($91.89)Other: $669,000 ($41.68)Sewerage: $207,000 ($12.90)Tax - Property: $7,296,000 ($454.52)
Public Utilities Sales: $130,000 ($8.10)Other License: $105,000 ($6.54)
Hibbing government finances - Debt in 2021 (per resident):
Long Term Debt - Beginning Outstanding - Unspecified Public Purpose: $15,665,000 ($975.89)
Outstanding Unspecified Public Purpose: $10,000,000 ($622.98)Retired Unspecified Public Purpose: $9,384,000 ($584.60)Issue, Unspecified Public Purpose: $3,720,000 ($231.75)Beginning Outstanding - Public Debt for Private Purpose: $2,530,000 ($157.61)Outstanding Nonguaranteed - Industrial Revenue: $1,481,000 ($92.26)Retired Nonguaranteed - Public Debt for Private Purpose: $1,049,000 ($65.35)Short Term Debt Outstanding - Beginning: $599,000 ($37.32)
End of Fiscal Year: $125,000 ($7.79)
Hibbing government finances - Cash and Securities in 2021 (per resident):
Other Funds - Cash and Securities: $35,586,000 ($2216.92)
Sinking Funds - Cash and Securities: $1,481,000 ($92.26)
Businesses in Hibbing, MN
Name Count Name Count
AT&T 1 New Balance 1 Caribou Coffee 1 Pizza Hut 1 Chevrolet 1 RadioShack 1 Dairy Queen 1 Sears 1 Domino's Pizza 1 Slumberland 1 FedEx 4 Subway 2 Ford 1 Super 8 1 H&R Block 1 T-Mobile 1 Hardee's 1 True Value 1 JCPenney 1 U-Haul 2 KFC 1 UPS 4 La-Z-Boy 1 Vans 1 Lowe's 1 Walgreens 1 McDonald's 1 Walmart 1
Strongest AM radio stations in Hibbing:
WMFG (1240 AM; 1 kW; HIBBING, MN; Owner: MIDWEST RADIO NETWORK, LLC)
WNMT (650 AM; 10 kW; NASHWAUK, MN; Owner: MIDWEST RADIO NETWORK, L.L.C.)
WEBC (560 AM; 50 kW; DULUTH, MN)
KOZY (1320 AM; 5 kW; GRAND RAPIDS, MN; Owner: ITASCA BROADCASTING, INC.)
WDSM (710 AM; 10 kW; SUPERIOR, WI; Owner: MIDWEST COMMUNICATIONS, INC.)
WWJC (850 AM; daytime; 10 kW; DULUTH, MN; Owner: WWJC, INC.)
KPRM (870 AM; 25 kW; PARK RAPIDS, MN; Owner: DE LA HUNT BROADCASTING CORP.)
WCCO (830 AM; 50 kW; MINNEAPOLIS, MN; Owner: INFINITY MEDIA CORPORATION)
KDAL (610 AM; 5 kW; DULUTH, MN; Owner: MIDWEST COMMUNICATIONS, INC.)
KRBT (1340 AM; 1 kW; EVELETH, MN; Owner: IRON RANGE BROADCASTING,INC)
WEEP (1400 AM; 1 kW; VIRGINIA, MN; Owner: FULL ARMOR MINISTRIES, INC.)
WCTS (1030 AM; 50 kW; MAPLEWOOD, MN; Owner: CNTL. BAPT. THEO/AL SEMI MINNEAPOLIS)
KSTP (1500 AM; 50 kW; ST. PAUL, MN; Owner: KSTP-AM, LLC (DELAWARE))
Strongest FM radio stations in Hibbing:
KMFG (102.9 FM; NASHWAUK, MN; Owner: MIDWEST RADIO NETWORK, LLC)
WMFG-FM (106.3 FM; HIBBING, MN; Owner: MIDWEST RADIO NETWORK, LLC)
WUSZ (99.9 FM; VIRGINIA, MN; Owner: VIRGINIA BROADCASTING CO.)
KADU (90.1 FM; HIBBING, MN; Owner: JPI RADIO, INC.)
WTBX (93.9 FM; HIBBING, MN; Owner: MIDWEST RADIO NETWORK, L.L.C.)
WIRN (92.5 FM; BUHL, MN; Owner: MINNESOTA PUBLIC RADIO)
WIRR (90.9 FM; VIRGINIA-HIBBING, MN; Owner: MINNESOTA PUBLIC RADIO)
W252AN (98.3 FM; HIBBING, MN; Owner: IRON RANGE BROADCASTING, INC)
K205AX (88.9 FM; HIBBING, ETC., MN; Owner: NORTHWESTERN COLLEGE)
KGPZ (96.1 FM; COLERAINE, MN; Owner: LATTO NORTHLAND BROADCASTING, INC.)
KBAJ (105.5 FM; DEER RIVER, MN; Owner: RED ROCK RADIO CORP.)
KMFY (96.9 FM; GRAND RAPIDS, MN; Owner: ITASCA BROADCASTING, INC.)
KAXE (91.7 FM; GRAND RAPIDS, MN; Owner: NORTHERN COMMUNITY RADIO)
K236AD (95.1 FM; GRAND RAPIDS, MN; Owner: HEARTLAND CHRISTIAN BROADCASTERS, INC.)
W269AQ (101.7 FM; CHISHOLM, MN; Owner: HEARTLAND CHRISTIAN BROADCASTERS, INC.)
TV broadcast stations around Hibbing:
WIRT (Channel 13; HIBBING, MN; Owner: WDIO-TV, LLC)
KRII (Channel 11; CHISHOLM, MN; Owner: CHANNEL 11 LICENSE, INC.)
K29EB (Channel 29; GRAND RAPIDS, MN; Owner: KQDS ACQUISITION CORP.)
Medal of Honor Recipients
Medal of Honor Recipient born in Hibbing: Mike Colalillo.
National Bridge Inventory (NBI) Statistics 57 Number of bridges492ft / 150m Total length $3,332,001,000 Total costs101,723 Total average daily traffic4,971 Total average daily truck traffic
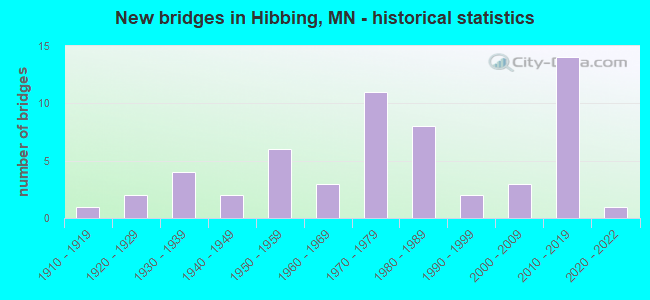
New bridges - historical statistics
1 1910-1919 2 1920-1929 4 1930-1939 2 1940-1949 6 1950-1959 3 1960-1969 11 1970-1979 8 1980-1989 2 1990-1999 3 2000-2009 14 2010-2019 1 2020-2022
See full National Bridge Inventory statistics for Hibbing, MN
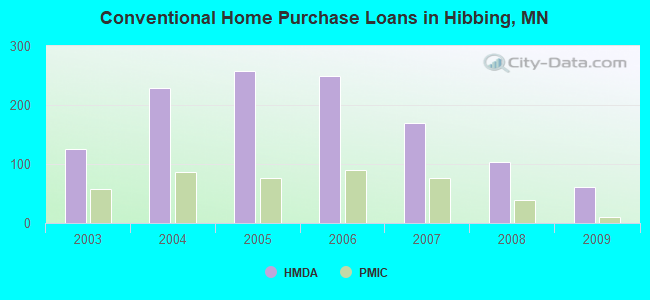
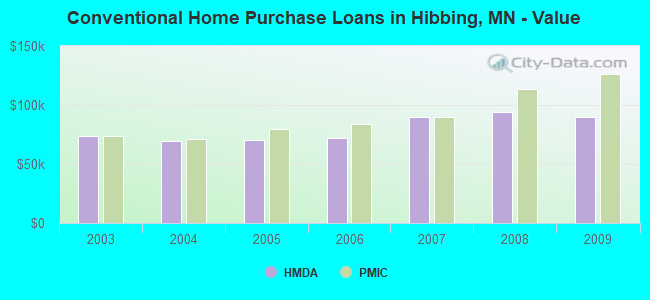
Home Mortgage Disclosure Act Aggregated Statistics For Year 2009(Based on 5 full tracts) A) FHA, FSA/RHS & VA B) Conventional C) Refinancings D) Home Improvement Loans E) Loans on Dwellings For 5+ Families F) Non-occupant Loans on G) Loans On Manufactured Number Average Value Number Average Value Number Average Value Number Average Value Number Average Value Number Average Value Number Average Value
LOANS ORIGINATED 60 $77,627 61 $90,252 296 $103,190 37 $35,702 3 $230,667 27 $66,740 9 $75,377 APPLICATIONS APPROVED, NOT ACCEPTED 2 $104,810 2 $132,260 26 $109,638 1 $50,000 0 $0 2 $132,260 2 $100,845 APPLICATIONS DENIED 9 $79,396 17 $81,048 118 $116,634 27 $22,508 0 $0 10 $77,889 9 $77,408 APPLICATIONS WITHDRAWN 6 $78,922 4 $123,308 56 $105,916 6 $101,173 1 $3,456,680 1 $147,000 2 $103,750 FILES CLOSED FOR INCOMPLETENESS 1 $107,000 0 $0 22 $94,107 10 $46,191 0 $0 0 $0 1 $103,000
Aggregated Statistics For Year 2008(Based on 5 full tracts) A) FHA, FSA/RHS & VA B) Conventional C) Refinancings D) Home Improvement Loans E) Loans on Dwellings For 5+ Families F) Non-occupant Loans on G) Loans On Manufactured Number Average Value Number Average Value Number Average Value Number Average Value Number Average Value Number Average Value Number Average Value
LOANS ORIGINATED 91 $95,902 104 $94,459 200 $95,720 58 $43,993 6 $284,463 39 $63,863 8 $101,781 APPLICATIONS APPROVED, NOT ACCEPTED 7 $100,571 10 $73,655 25 $138,455 6 $55,950 0 $0 3 $51,000 0 $0 APPLICATIONS DENIED 13 $109,789 14 $72,912 126 $97,780 35 $43,515 0 $0 11 $69,684 3 $28,317 APPLICATIONS WITHDRAWN 5 $71,942 7 $128,400 43 $95,942 16 $37,260 0 $0 6 $56,618 1 $139,660 FILES CLOSED FOR INCOMPLETENESS 3 $75,960 3 $102,000 13 $84,968 6 $52,613 0 $0 1 $63,000 1 $46,890
Aggregated Statistics For Year 2007(Based on 5 full tracts) A) FHA, FSA/RHS & VA B) Conventional C) Refinancings D) Home Improvement Loans E) Loans on Dwellings For 5+ Families F) Non-occupant Loans on G) Loans On Manufactured Number Average Value Number Average Value Number Average Value Number Average Value Number Average Value Number Average Value Number Average Value
LOANS ORIGINATED 36 $92,211 170 $90,092 264 $88,737 76 $38,831 3 $250,333 48 $55,317 8 $82,476 APPLICATIONS APPROVED, NOT ACCEPTED 1 $70,000 17 $88,438 46 $100,186 13 $56,010 0 $0 1 $250,000 2 $79,810 APPLICATIONS DENIED 3 $67,000 36 $70,291 171 $88,618 32 $35,291 0 $0 8 $69,361 3 $54,867 APPLICATIONS WITHDRAWN 0 $0 21 $98,379 67 $95,858 7 $62,881 0 $0 2 $140,285 2 $82,800 FILES CLOSED FOR INCOMPLETENESS 0 $0 10 $97,061 22 $102,121 4 $59,880 0 $0 3 $85,667 0 $0
Aggregated Statistics For Year 2006(Based on 5 full tracts) A) FHA, FSA/RHS & VA B) Conventional C) Refinancings D) Home Improvement Loans E) Loans on Dwellings For 5+ Families F) Non-occupant Loans on G) Loans On Manufactured Number Average Value Number Average Value Number Average Value Number Average Value Number Average Value Number Average Value Number Average Value
LOANS ORIGINATED 33 $85,142 249 $72,177 289 $79,413 73 $31,568 1 $158,000 61 $63,653 12 $51,889 APPLICATIONS APPROVED, NOT ACCEPTED 0 $0 36 $77,141 50 $83,496 11 $35,360 0 $0 3 $57,667 4 $81,555 APPLICATIONS DENIED 8 $86,519 63 $69,202 200 $82,906 47 $45,561 0 $0 17 $103,278 10 $58,998 APPLICATIONS WITHDRAWN 1 $51,000 18 $76,306 103 $93,253 7 $31,109 0 $0 6 $105,410 1 $114,000 FILES CLOSED FOR INCOMPLETENESS 0 $0 4 $41,742 48 $105,372 4 $16,982 0 $0 4 $59,205 0 $0
Aggregated Statistics For Year 2005(Based on 5 full tracts) A) FHA, FSA/RHS & VA B) Conventional C) Refinancings D) Home Improvement Loans E) Loans on Dwellings For 5+ Families F) Non-occupant Loans on G) Loans On Manufactured Number Average Value Number Average Value Number Average Value Number Average Value Number Average Value Number Average Value Number Average Value
LOANS ORIGINATED 37 $70,652 257 $70,094 314 $79,431 94 $38,300 2 $2,050,000 40 $78,838 7 $43,781 APPLICATIONS APPROVED, NOT ACCEPTED 1 $48,000 35 $64,881 74 $72,223 14 $40,581 0 $0 5 $108,000 3 $75,817 APPLICATIONS DENIED 2 $39,000 63 $62,692 207 $78,667 59 $28,179 0 $0 11 $48,526 9 $53,458 APPLICATIONS WITHDRAWN 0 $0 16 $67,785 115 $90,318 12 $84,314 0 $0 12 $94,230 2 $38,410 FILES CLOSED FOR INCOMPLETENESS 1 $139,660 5 $69,528 33 $89,940 1 $15,000 0 $0 1 $80,000 1 $91,780
Aggregated Statistics For Year 2004(Based on 5 full tracts) A) FHA, FSA/RHS & VA B) Conventional C) Refinancings D) Home Improvement Loans E) Loans on Dwellings For 5+ Families F) Non-occupant Loans on G) Loans On Manufactured Number Average Value Number Average Value Number Average Value Number Average Value Number Average Value Number Average Value Number Average Value
LOANS ORIGINATED 33 $71,502 228 $69,580 336 $76,569 93 $34,531 2 $93,500 43 $64,646 6 $60,375 APPLICATIONS APPROVED, NOT ACCEPTED 4 $59,000 19 $55,891 53 $75,107 16 $38,124 0 $0 4 $63,172 2 $58,360 APPLICATIONS DENIED 2 $48,000 42 $51,781 145 $85,094 35 $27,946 0 $0 11 $74,598 3 $42,567 APPLICATIONS WITHDRAWN 1 $50,000 18 $86,451 102 $83,377 9 $41,726 0 $0 3 $58,667 2 $70,330 FILES CLOSED FOR INCOMPLETENESS 3 $62,283 1 $34,920 22 $100,380 1 $34,920 0 $0 3 $64,973 0 $0
Aggregated Statistics For Year 2003(Based on 5 full tracts) A) FHA, FSA/RHS & VA B) Conventional C) Refinancings D) Home Improvement Loans E) Loans on Dwellings For 5+ Families F) Non-occupant Loans on Number Average Value Number Average Value Number Average Value Number Average Value Number Average Value Number Average Value
LOANS ORIGINATED 37 $60,569 125 $74,055 517 $69,322 90 $31,296 4 $60,000 32 $46,917 APPLICATIONS APPROVED, NOT ACCEPTED 1 $39,000 15 $119,802 70 $73,838 8 $34,690 0 $0 3 $67,637 APPLICATIONS DENIED 6 $50,667 30 $53,901 188 $65,647 36 $19,044 0 $0 15 $45,328 APPLICATIONS WITHDRAWN 1 $30,000 10 $60,877 109 $81,879 4 $29,000 0 $0 0 $0 FILES CLOSED FOR INCOMPLETENESS 2 $45,500 6 $55,500 22 $67,469 2 $30,470 0 $0 2 $55,500
Detailed HMDA statistics for the following Tracts:
0121.00
, 0122.00 , 0123.00 , 0124.00 , 0125.00
Private Mortgage Insurance Companies Aggregated Statistics For Year 2009(Based on 5 full tracts) A) Conventional B) Refinancings Number Average Value Number Average Value
LOANS ORIGINATED 10 $125,925 5 $147,000 APPLICATIONS APPROVED, NOT ACCEPTED 3 $72,333 1 $124,000 APPLICATIONS DENIED 3 $86,333 0 $0 APPLICATIONS WITHDRAWN 0 $0 0 $0 FILES CLOSED FOR INCOMPLETENESS 1 $89,000 0 $0
Aggregated Statistics For Year 2008(Based on 5 full tracts) A) Conventional B) Refinancings C) Non-occupant Loans on Number Average Value Number Average Value Number Average Value
LOANS ORIGINATED 39 $113,942 11 $128,016 3 $44,333 APPLICATIONS APPROVED, NOT ACCEPTED 5 $103,482 3 $172,557 1 $54,000 APPLICATIONS DENIED 2 $128,855 3 $160,000 0 $0 APPLICATIONS WITHDRAWN 0 $0 0 $0 0 $0 FILES CLOSED FOR INCOMPLETENESS 2 $111,785 0 $0 0 $0
Aggregated Statistics For Year 2007(Based on 5 full tracts) A) Conventional B) Refinancings C) Non-occupant Loans on D) Loans On Manufactured Number Average Value Number Average Value Number Average Value Number Average Value
LOANS ORIGINATED 76 $90,126 29 $115,941 3 $66,250 0 $0 APPLICATIONS APPROVED, NOT ACCEPTED 5 $83,200 6 $140,617 1 $124,000 0 $0 APPLICATIONS DENIED 0 $0 1 $72,000 0 $0 0 $0 APPLICATIONS WITHDRAWN 3 $99,807 3 $168,927 0 $0 1 $107,740 FILES CLOSED FOR INCOMPLETENESS 1 $124,000 0 $0 1 $124,000 0 $0
Aggregated Statistics For Year 2006(Based on 5 full tracts) A) Conventional B) Refinancings C) Non-occupant Loans on D) Loans On Manufactured Number Average Value Number Average Value Number Average Value Number Average Value
LOANS ORIGINATED 89 $83,881 22 $95,875 11 $53,991 0 $0 APPLICATIONS APPROVED, NOT ACCEPTED 3 $74,667 10 $114,591 2 $108,000 1 $137,670 APPLICATIONS DENIED 4 $78,500 1 $27,000 2 $91,500 0 $0 APPLICATIONS WITHDRAWN 4 $99,182 2 $172,620 1 $31,000 0 $0 FILES CLOSED FOR INCOMPLETENESS 0 $0 0 $0 0 $0 0 $0
Aggregated Statistics For Year 2005(Based on 5 full tracts) A) Conventional B) Refinancings C) Non-occupant Loans on Number Average Value Number Average Value Number Average Value
LOANS ORIGINATED 76 $79,641 28 $90,141 7 $56,714 APPLICATIONS APPROVED, NOT ACCEPTED 7 $79,454 5 $133,686 1 $34,920 APPLICATIONS DENIED 1 $38,000 0 $0 0 $0 APPLICATIONS WITHDRAWN 1 $36,910 3 $115,883 0 $0 FILES CLOSED FOR INCOMPLETENESS 0 $0 0 $0 0 $0
Aggregated Statistics For Year 2004(Based on 5 full tracts) A) Conventional B) Refinancings C) Non-occupant Loans on Number Average Value Number Average Value Number Average Value
LOANS ORIGINATED 86 $71,456 37 $94,718 10 $40,593 APPLICATIONS APPROVED, NOT ACCEPTED 6 $99,253 9 $70,829 0 $0 APPLICATIONS DENIED 0 $0 0 $0 0 $0 APPLICATIONS WITHDRAWN 3 $35,333 4 $118,675 4 $71,500 FILES CLOSED FOR INCOMPLETENESS 0 $0 2 $63,930 0 $0
Aggregated Statistics For Year 2003(Based on 5 full tracts) A) Conventional B) Refinancings C) Non-occupant Loans on Number Average Value Number Average Value Number Average Value
LOANS ORIGINATED 57 $73,880 59 $90,571 5 $57,548 APPLICATIONS APPROVED, NOT ACCEPTED 3 $69,667 7 $91,983 1 $80,000 APPLICATIONS DENIED 1 $60,000 0 $0 0 $0 APPLICATIONS WITHDRAWN 2 $56,445 5 $111,546 0 $0 FILES CLOSED FOR INCOMPLETENESS 1 $45,890 2 $98,850 0 $0
Detailed PMIC statistics for the following Tracts:
0121.00
, 0122.00 , 0123.00 , 0124.00 , 0125.00 Fire-safe hotels and motels in Hibbing, Minnesota:
Hibbing Park Hotel, 1402 E Howard St, Hibbing, Minnesota 55746 Phone: (800) 262-3481
Hampton Inn Hibbing, 4225 9th Ave W, Hibbing, Minnesota 55746 Phone: (218) 262-0000, Fax: (218) 262-0002
All 2 fire-safe hotels and motels in Hibbing, Minnesota
Most common first names in Hibbing, MN among deceased individuals Name Count Lived (average)
John 254 78.2 years Mary 233 81.9 years William 143 74.7 years Robert 125 70.3 years George 114 76.2 years Frank 111 79.5 years Joseph 96 73.6 years Anna 87 86.1 years James 83 72.0 years Margaret 83 80.6 years
Most common last names in Hibbing, MN among deceased individuals Last name Count Lived (average)
Johnson 155 78.1 years Anderson 92 78.1 years Maki 53 78.8 years Nelson 49 77.1 years Olson 48 75.3 years Erickson 46 79.1 years Carlson 42 78.3 years Peterson 34 76.5 years Larson 25 81.5 years Gustafson 24 77.8 years
Hibbing compared to Minnesota state average:
Median household income below state average. Median house value significantly below state average. Unemployed percentage below state average. Black race population percentage significantly below state average. Hispanic race population percentage significantly below state average. Foreign-born population percentage significantly below state average. Length of stay since moving in significantly above state average. House age above state average.
#29 on the list of "Top 101 cities with the lowest number of burglaries per 100,000 residents (population 5,000+)"
#65 on the list of "Top 100 safest cities (lowest city-data.com crime index)"
#98 on the list of "Top 101 cities with largest percentage of females in industries: mining, quarrying, and oil and gas extraction (population 5,000+)"
#99 (55746) on the list of "Top 101 zip codes with the largest percentage of Swedish first ancestries (pop 5,000+)"
#39 on the list of "Top 101 counties with the lowest Particulate Matter (PM2.5 ) Annual air pollution readings in 2012 (µg/m3 )"
#54 on the list of "Top 101 counties with the lowest percentage of residents relocating to foreign countries in 2011 (pop. 50,000+)"
#55 on the list of "Top 101 counties with the largest increase in the number of births per 1000 residents 2000-2006 to 2007-2013 (pop 50,000+)"
#70 on the list of "Top 101 counties with the lowest number of births per 1000 residents 2007-2013"
#80 on the list of "Top 101 counties with the highest carbon monoxide air pollution readings in 2012 (ppm)"
Top Patent Applicants
William M. Christensen (19)
Richard F. Kiesel (8)
Gary J. Corradi (5)
Kendall J. Dykhuis (5)
Gary M. Liubakka (5)
Daniel E. Lamphere (5)
William Christensen (4)
David W. Hendrickson (4)
Robert Janezich (3)
Gregory D. Lindahl (3)
Total of 59 patent applications in 2008-2024.


 Recent articles from our blog. Our writers, many of them Ph.D. graduates or candidates, create easy-to-read articles on a wide variety of topics.

 (58.6 miles
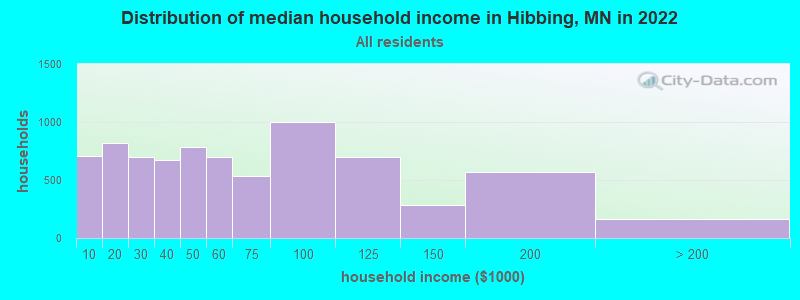


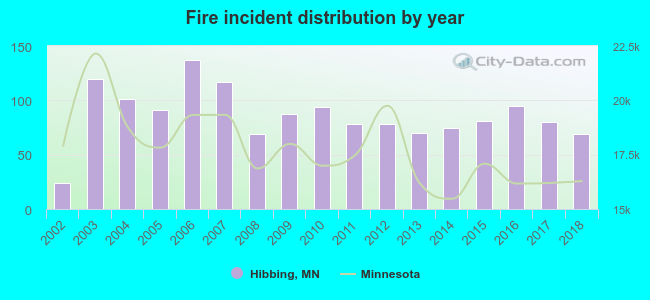 Based on the data from the years 2002 - 2018 the average number of fires per year is 86. The highest number of fires - 137 took place in 2006, and the least - 24 in 2002. The data has a rising trend.
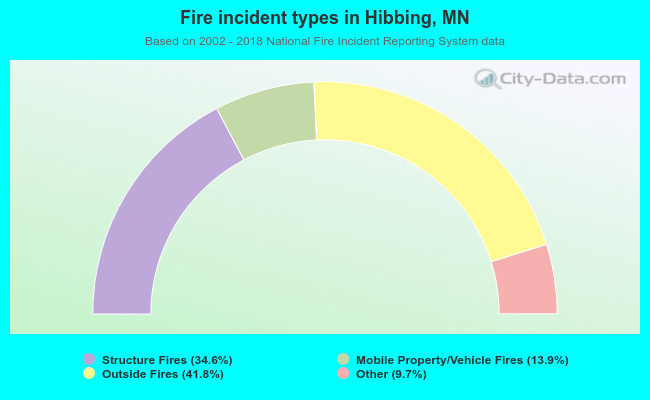 When looking into fire subcategories, the most incidents belonged to: Outside Fires (41.8%), and Structure Fires (34.6%).