Moorhead, Minnesota Submit your own pictures of this city and show them to the world
OSM Map
General Map
Google Map
MSN Map
OSM Map
General Map
Google Map
MSN Map
OSM Map
General Map
Google Map
MSN Map
OSM Map
General Map
Google Map
MSN Map
Please wait while loading the map...
Population in 2022: 44,861 (99% urban, 1% rural). Population change since 2000: +39.4%Males: 22,476 Females: 22,385
March 2022 cost of living index in Moorhead: 97.7 (near average, U.S. average is 100) Percentage of residents living in poverty in 2022: 18.4%for White Non-Hispanic residents , 43.0% for Black residents , 20.2% for Hispanic or Latino residents , 83.3% for American Indian residents , 100.0% for Native Hawaiian and other Pacific Islander residents , 39.2% for other race residents , 31.8% for two or more races residents )
Profiles of local businesses
Business Search - 14 Million verified businesses
Data:
Median household income ($)
Median household income (% change since 2000)
Household income diversity
Ratio of average income to average house value (%)
Ratio of average income to average rent
Median household income ($) - White
Median household income ($) - Black or African American
Median household income ($) - Asian
Median household income ($) - Hispanic or Latino
Median household income ($) - American Indian and Alaska Native
Median household income ($) - Multirace
Median household income ($) - Other Race
Median household income for houses/condos with a mortgage ($)
Median household income for apartments without a mortgage ($)
Races - White alone (%)
Races - White alone (% change since 2000)
Races - Black alone (%)
Races - Black alone (% change since 2000)
Races - American Indian alone (%)
Races - American Indian alone (% change since 2000)
Races - Asian alone (%)
Races - Asian alone (% change since 2000)
Races - Hispanic (%)
Races - Hispanic (% change since 2000)
Races - Native Hawaiian and Other Pacific Islander alone (%)
Races - Native Hawaiian and Other Pacific Islander alone (% change since 2000)
Races - Two or more races (%)
Races - Two or more races (% change since 2000)
Races - Other race alone (%)
Races - Other race alone (% change since 2000)
Racial diversity
Unemployment (%)
Unemployment (% change since 2000)
Unemployment (%) - White
Unemployment (%) - Black or African American
Unemployment (%) - Asian
Unemployment (%) - Hispanic or Latino
Unemployment (%) - American Indian and Alaska Native
Unemployment (%) - Multirace
Unemployment (%) - Other Race
Population density (people per square mile)
Population - Males (%)
Population - Females (%)
Population - Males (%) - White
Population - Males (%) - Black or African American
Population - Males (%) - Asian
Population - Males (%) - Hispanic or Latino
Population - Males (%) - American Indian and Alaska Native
Population - Males (%) - Multirace
Population - Males (%) - Other Race
Population - Females (%) - White
Population - Females (%) - Black or African American
Population - Females (%) - Asian
Population - Females (%) - Hispanic or Latino
Population - Females (%) - American Indian and Alaska Native
Population - Females (%) - Multirace
Population - Females (%) - Other Race
Coronavirus confirmed cases (May 19, 2024)
Deaths caused by coronavirus (May 19, 2024)
Coronavirus confirmed cases (per 100k population) (May 19, 2024)
Deaths caused by coronavirus (per 100k population) (May 19, 2024)
Daily increase in number of cases (May 19, 2024)
Weekly increase in number of cases (May 19, 2024)
Cases doubled (in days) (May 19, 2024)
Hospitalized patients (Apr 18, 2022)
Negative test results (Apr 18, 2022)
Total test results (Apr 18, 2022)
COVID Vaccine doses distributed (per 100k population) (Sep 19, 2023)
COVID Vaccine doses administered (per 100k population) (Sep 19, 2023)
COVID Vaccine doses distributed (Sep 19, 2023)
COVID Vaccine doses administered (Sep 19, 2023)
Likely homosexual households (%)
Likely homosexual households (% change since 2000)
Likely homosexual households - Lesbian couples (%)
Likely homosexual households - Lesbian couples (% change since 2000)
Likely homosexual households - Gay men (%)
Likely homosexual households - Gay men (% change since 2000)
Cost of living index
Median gross rent ($)
Median contract rent ($)
Median monthly housing costs ($)
Median house or condo value ($)
Median house or condo value ($ change since 2000)
Mean house or condo value by units in structure - 1, detached ($)
Mean house or condo value by units in structure - 1, attached ($)
Mean house or condo value by units in structure - 2 ($)
Mean house or condo value by units in structure by units in structure - 3 or 4 ($)
Mean house or condo value by units in structure - 5 or more ($)
Mean house or condo value by units in structure - Boat, RV, van, etc. ($)
Mean house or condo value by units in structure - Mobile home ($)
Median house or condo value ($) - White
Median house or condo value ($) - Black or African American
Median house or condo value ($) - Asian
Median house or condo value ($) - Hispanic or Latino
Median house or condo value ($) - American Indian and Alaska Native
Median house or condo value ($) - Multirace
Median house or condo value ($) - Other Race
Median resident age
Resident age diversity
Median resident age - Males
Median resident age - Females
Median resident age - White
Median resident age - Black or African American
Median resident age - Asian
Median resident age - Hispanic or Latino
Median resident age - American Indian and Alaska Native
Median resident age - Multirace
Median resident age - Other Race
Median resident age - Males - White
Median resident age - Males - Black or African American
Median resident age - Males - Asian
Median resident age - Males - Hispanic or Latino
Median resident age - Males - American Indian and Alaska Native
Median resident age - Males - Multirace
Median resident age - Males - Other Race
Median resident age - Females - White
Median resident age - Females - Black or African American
Median resident age - Females - Asian
Median resident age - Females - Hispanic or Latino
Median resident age - Females - American Indian and Alaska Native
Median resident age - Females - Multirace
Median resident age - Females - Other Race
Commute - mean travel time to work (minutes)
Travel time to work - Less than 5 minutes (%)
Travel time to work - Less than 5 minutes (% change since 2000)
Travel time to work - 5 to 9 minutes (%)
Travel time to work - 5 to 9 minutes (% change since 2000)
Travel time to work - 10 to 19 minutes (%)
Travel time to work - 10 to 19 minutes (% change since 2000)
Travel time to work - 20 to 29 minutes (%)
Travel time to work - 20 to 29 minutes (% change since 2000)
Travel time to work - 30 to 39 minutes (%)
Travel time to work - 30 to 39 minutes (% change since 2000)
Travel time to work - 40 to 59 minutes (%)
Travel time to work - 40 to 59 minutes (% change since 2000)
Travel time to work - 60 to 89 minutes (%)
Travel time to work - 60 to 89 minutes (% change since 2000)
Travel time to work - 90 or more minutes (%)
Travel time to work - 90 or more minutes (% change since 2000)
Marital status - Never married (%)
Marital status - Now married (%)
Marital status - Separated (%)
Marital status - Widowed (%)
Marital status - Divorced (%)
Median family income ($)
Median family income (% change since 2000)
Median non-family income ($)
Median non-family income (% change since 2000)
Median per capita income ($)
Median per capita income (% change since 2000)
Median family income ($) - White
Median family income ($) - Black or African American
Median family income ($) - Asian
Median family income ($) - Hispanic or Latino
Median family income ($) - American Indian and Alaska Native
Median family income ($) - Multirace
Median family income ($) - Other Race
Median year house/condo built
Median year apartment built
Year house built - Built 2005 or later (%)
Year house built - Built 2000 to 2004 (%)
Year house built - Built 1990 to 1999 (%)
Year house built - Built 1980 to 1989 (%)
Year house built - Built 1970 to 1979 (%)
Year house built - Built 1960 to 1969 (%)
Year house built - Built 1950 to 1959 (%)
Year house built - Built 1940 to 1949 (%)
Year house built - Built 1939 or earlier (%)
Average household size
Household density (households per square mile)
Average household size - White
Average household size - Black or African American
Average household size - Asian
Average household size - Hispanic or Latino
Average household size - American Indian and Alaska Native
Average household size - Multirace
Average household size - Other Race
Occupied housing units (%)
Vacant housing units (%)
Owner occupied housing units (%)
Renter occupied housing units (%)
Vacancy status - For rent (%)
Vacancy status - For sale only (%)
Vacancy status - Rented or sold, not occupied (%)
Vacancy status - For seasonal, recreational, or occasional use (%)
Vacancy status - For migrant workers (%)
Vacancy status - Other vacant (%)
Residents with income below the poverty level (%)
Residents with income below 50% of the poverty level (%)
Children below poverty level (%)
Poor families by family type - Married-couple family (%)
Poor families by family type - Male, no wife present (%)
Poor families by family type - Female, no husband present (%)
Poverty status for native-born residents (%)
Poverty status for foreign-born residents (%)
Poverty among high school graduates not in families (%)
Poverty among people who did not graduate high school not in families (%)
Residents with income below the poverty level (%) - White
Residents with income below the poverty level (%) - Black or African American
Residents with income below the poverty level (%) - Asian
Residents with income below the poverty level (%) - Hispanic or Latino
Residents with income below the poverty level (%) - American Indian and Alaska Native
Residents with income below the poverty level (%) - Multirace
Residents with income below the poverty level (%) - Other Race
Air pollution - Air Quality Index (AQI)
Air pollution - CO
Air pollution - NO2
Air pollution - SO2
Air pollution - Ozone
Air pollution - PM10
Air pollution - PM25
Air pollution - Pb
Crime - Murders per 100,000 population
Crime - Rapes per 100,000 population
Crime - Robberies per 100,000 population
Crime - Assaults per 100,000 population
Crime - Burglaries per 100,000 population
Crime - Thefts per 100,000 population
Crime - Auto thefts per 100,000 population
Crime - Arson per 100,000 population
Crime - City-data.com crime index
Crime - Violent crime index
Crime - Property crime index
Crime - Murders per 100,000 population (5 year average)
Crime - Rapes per 100,000 population (5 year average)
Crime - Robberies per 100,000 population (5 year average)
Crime - Assaults per 100,000 population (5 year average)
Crime - Burglaries per 100,000 population (5 year average)
Crime - Thefts per 100,000 population (5 year average)
Crime - Auto thefts per 100,000 population (5 year average)
Crime - Arson per 100,000 population (5 year average)
Crime - City-data.com crime index (5 year average)
Crime - Violent crime index (5 year average)
Crime - Property crime index (5 year average)
1996 Presidential Elections Results (%) - Democratic Party (Clinton)
1996 Presidential Elections Results (%) - Republican Party (Dole)
1996 Presidential Elections Results (%) - Other
2000 Presidential Elections Results (%) - Democratic Party (Gore)
2000 Presidential Elections Results (%) - Republican Party (Bush)
2000 Presidential Elections Results (%) - Other
2004 Presidential Elections Results (%) - Democratic Party (Kerry)
2004 Presidential Elections Results (%) - Republican Party (Bush)
2004 Presidential Elections Results (%) - Other
2008 Presidential Elections Results (%) - Democratic Party (Obama)
2008 Presidential Elections Results (%) - Republican Party (McCain)
2008 Presidential Elections Results (%) - Other
2012 Presidential Elections Results (%) - Democratic Party (Obama)
2012 Presidential Elections Results (%) - Republican Party (Romney)
2012 Presidential Elections Results (%) - Other
2016 Presidential Elections Results (%) - Democratic Party (Clinton)
2016 Presidential Elections Results (%) - Republican Party (Trump)
2016 Presidential Elections Results (%) - Other
2020 Presidential Elections Results (%) - Democratic Party (Biden)
2020 Presidential Elections Results (%) - Republican Party (Trump)
2020 Presidential Elections Results (%) - Other
Ancestries Reported - Arab (%)
Ancestries Reported - Czech (%)
Ancestries Reported - Danish (%)
Ancestries Reported - Dutch (%)
Ancestries Reported - English (%)
Ancestries Reported - French (%)
Ancestries Reported - French Canadian (%)
Ancestries Reported - German (%)
Ancestries Reported - Greek (%)
Ancestries Reported - Hungarian (%)
Ancestries Reported - Irish (%)
Ancestries Reported - Italian (%)
Ancestries Reported - Lithuanian (%)
Ancestries Reported - Norwegian (%)
Ancestries Reported - Polish (%)
Ancestries Reported - Portuguese (%)
Ancestries Reported - Russian (%)
Ancestries Reported - Scotch-Irish (%)
Ancestries Reported - Scottish (%)
Ancestries Reported - Slovak (%)
Ancestries Reported - Subsaharan African (%)
Ancestries Reported - Swedish (%)
Ancestries Reported - Swiss (%)
Ancestries Reported - Ukrainian (%)
Ancestries Reported - United States (%)
Ancestries Reported - Welsh (%)
Ancestries Reported - West Indian (%)
Ancestries Reported - Other (%)
Educational Attainment - No schooling completed (%)
Educational Attainment - Less than high school (%)
Educational Attainment - High school or equivalent (%)
Educational Attainment - Less than 1 year of college (%)
Educational Attainment - 1 or more years of college (%)
Educational Attainment - Associate degree (%)
Educational Attainment - Bachelor's degree (%)
Educational Attainment - Master's degree (%)
Educational Attainment - Professional school degree (%)
Educational Attainment - Doctorate degree (%)
School Enrollment - Nursery, preschool (%)
School Enrollment - Kindergarten (%)
School Enrollment - Grade 1 to 4 (%)
School Enrollment - Grade 5 to 8 (%)
School Enrollment - Grade 9 to 12 (%)
School Enrollment - College undergrad (%)
School Enrollment - Graduate or professional (%)
School Enrollment - Not enrolled in school (%)
School enrollment - Public schools (%)
School enrollment - Private schools (%)
School enrollment - Not enrolled (%)
Median number of rooms in houses and condos
Median number of rooms in apartments
Housing units lacking complete plumbing facilities (%)
Housing units lacking complete kitchen facilities (%)
Density of houses
Urban houses (%)
Rural houses (%)
Households with people 60 years and over (%)
Households with people 65 years and over (%)
Households with people 75 years and over (%)
Households with one or more nonrelatives (%)
Households with no nonrelatives (%)
Population in households (%)
Family households (%)
Nonfamily households (%)
Population in families (%)
Family households with own children (%)
Median number of bedrooms in owner occupied houses
Mean number of bedrooms in owner occupied houses
Median number of bedrooms in renter occupied houses
Mean number of bedrooms in renter occupied houses
Median number of vehichles in owner occupied houses
Mean number of vehichles in owner occupied houses
Median number of vehichles in renter occupied houses
Mean number of vehichles in renter occupied houses
Mortgage status - with mortgage (%)
Mortgage status - with second mortgage (%)
Mortgage status - with home equity loan (%)
Mortgage status - with both second mortgage and home equity loan (%)
Mortgage status - without a mortgage (%)
Average family size
Average family size - White
Average family size - Black or African American
Average family size - Asian
Average family size - Hispanic or Latino
Average family size - American Indian and Alaska Native
Average family size - Multirace
Average family size - Other Race
Geographical mobility - Same house 1 year ago (%)
Geographical mobility - Moved within same county (%)
Geographical mobility - Moved from different county within same state (%)
Geographical mobility - Moved from different state (%)
Geographical mobility - Moved from abroad (%)
Place of birth - Born in state of residence (%)
Place of birth - Born in other state (%)
Place of birth - Native, outside of US (%)
Place of birth - Foreign born (%)
Housing units in structures - 1, detached (%)
Housing units in structures - 1, attached (%)
Housing units in structures - 2 (%)
Housing units in structures - 3 or 4 (%)
Housing units in structures - 5 to 9 (%)
Housing units in structures - 10 to 19 (%)
Housing units in structures - 20 to 49 (%)
Housing units in structures - 50 or more (%)
Housing units in structures - Mobile home (%)
Housing units in structures - Boat, RV, van, etc. (%)
House/condo owner moved in on average (years ago)
Renter moved in on average (years ago)
Year householder moved into unit - Moved in 1999 to March 2000 (%)
Year householder moved into unit - Moved in 1995 to 1998 (%)
Year householder moved into unit - Moved in 1990 to 1994 (%)
Year householder moved into unit - Moved in 1980 to 1989 (%)
Year householder moved into unit - Moved in 1970 to 1979 (%)
Year householder moved into unit - Moved in 1969 or earlier (%)
Means of transportation to work - Drove car alone (%)
Means of transportation to work - Carpooled (%)
Means of transportation to work - Public transportation (%)
Means of transportation to work - Bus or trolley bus (%)
Means of transportation to work - Streetcar or trolley car (%)
Means of transportation to work - Subway or elevated (%)
Means of transportation to work - Railroad (%)
Means of transportation to work - Ferryboat (%)
Means of transportation to work - Taxicab (%)
Means of transportation to work - Motorcycle (%)
Means of transportation to work - Bicycle (%)
Means of transportation to work - Walked (%)
Means of transportation to work - Other means (%)
Working at home (%)
Industry diversity
Most Common Industries - Agriculture, forestry, fishing and hunting, and mining (%)
Most Common Industries - Agriculture, forestry, fishing and hunting (%)
Most Common Industries - Mining, quarrying, and oil and gas extraction (%)
Most Common Industries - Construction (%)
Most Common Industries - Manufacturing (%)
Most Common Industries - Wholesale trade (%)
Most Common Industries - Retail trade (%)
Most Common Industries - Transportation and warehousing, and utilities (%)
Most Common Industries - Transportation and warehousing (%)
Most Common Industries - Utilities (%)
Most Common Industries - Information (%)
Most Common Industries - Finance and insurance, and real estate and rental and leasing (%)
Most Common Industries - Finance and insurance (%)
Most Common Industries - Real estate and rental and leasing (%)
Most Common Industries - Professional, scientific, and management, and administrative and waste management services (%)
Most Common Industries - Professional, scientific, and technical services (%)
Most Common Industries - Management of companies and enterprises (%)
Most Common Industries - Administrative and support and waste management services (%)
Most Common Industries - Educational services, and health care and social assistance (%)
Most Common Industries - Educational services (%)
Most Common Industries - Health care and social assistance (%)
Most Common Industries - Arts, entertainment, and recreation, and accommodation and food services (%)
Most Common Industries - Arts, entertainment, and recreation (%)
Most Common Industries - Accommodation and food services (%)
Most Common Industries - Other services, except public administration (%)
Most Common Industries - Public administration (%)
Occupation diversity
Most Common Occupations - Management, business, science, and arts occupations (%)
Most Common Occupations - Management, business, and financial occupations (%)
Most Common Occupations - Management occupations (%)
Most Common Occupations - Business and financial operations occupations (%)
Most Common Occupations - Computer, engineering, and science occupations (%)
Most Common Occupations - Computer and mathematical occupations (%)
Most Common Occupations - Architecture and engineering occupations (%)
Most Common Occupations - Life, physical, and social science occupations (%)
Most Common Occupations - Education, legal, community service, arts, and media occupations (%)
Most Common Occupations - Community and social service occupations (%)
Most Common Occupations - Legal occupations (%)
Most Common Occupations - Education, training, and library occupations (%)
Most Common Occupations - Arts, design, entertainment, sports, and media occupations (%)
Most Common Occupations - Healthcare practitioners and technical occupations (%)
Most Common Occupations - Health diagnosing and treating practitioners and other technical occupations (%)
Most Common Occupations - Health technologists and technicians (%)
Most Common Occupations - Service occupations (%)
Most Common Occupations - Healthcare support occupations (%)
Most Common Occupations - Protective service occupations (%)
Most Common Occupations - Fire fighting and prevention, and other protective service workers including supervisors (%)
Most Common Occupations - Law enforcement workers including supervisors (%)
Most Common Occupations - Food preparation and serving related occupations (%)
Most Common Occupations - Building and grounds cleaning and maintenance occupations (%)
Most Common Occupations - Personal care and service occupations (%)
Most Common Occupations - Sales and office occupations (%)
Most Common Occupations - Sales and related occupations (%)
Most Common Occupations - Office and administrative support occupations (%)
Most Common Occupations - Natural resources, construction, and maintenance occupations (%)
Most Common Occupations - Farming, fishing, and forestry occupations (%)
Most Common Occupations - Construction and extraction occupations (%)
Most Common Occupations - Installation, maintenance, and repair occupations (%)
Most Common Occupations - Production, transportation, and material moving occupations (%)
Most Common Occupations - Production occupations (%)
Most Common Occupations - Transportation occupations (%)
Most Common Occupations - Material moving occupations (%)
People in Group quarters - Institutionalized population (%)
People in Group quarters - Correctional institutions (%)
People in Group quarters - Federal prisons and detention centers (%)
People in Group quarters - Halfway houses (%)
People in Group quarters - Local jails and other confinement facilities (including police lockups) (%)
People in Group quarters - Military disciplinary barracks (%)
People in Group quarters - State prisons (%)
People in Group quarters - Other types of correctional institutions (%)
People in Group quarters - Nursing homes (%)
People in Group quarters - Hospitals/wards, hospices, and schools for the handicapped (%)
People in Group quarters - Hospitals/wards and hospices for chronically ill (%)
People in Group quarters - Hospices or homes for chronically ill (%)
People in Group quarters - Military hospitals or wards for chronically ill (%)
People in Group quarters - Other hospitals or wards for chronically ill (%)
People in Group quarters - Hospitals or wards for drug/alcohol abuse (%)
People in Group quarters - Mental (Psychiatric) hospitals or wards (%)
People in Group quarters - Schools, hospitals, or wards for the mentally retarded (%)
People in Group quarters - Schools, hospitals, or wards for the physically handicapped (%)
People in Group quarters - Institutions for the deaf (%)
People in Group quarters - Institutions for the blind (%)
People in Group quarters - Orthopedic wards and institutions for the physically handicapped (%)
People in Group quarters - Wards in general hospitals for patients who have no usual home elsewhere (%)
People in Group quarters - Wards in military hospitals for patients who have no usual home elsewhere (%)
People in Group quarters - Juvenile institutions (%)
People in Group quarters - Long-term care (%)
People in Group quarters - Homes for abused, dependent, and neglected children (%)
People in Group quarters - Residential treatment centers for emotionally disturbed children (%)
People in Group quarters - Training schools for juvenile delinquents (%)
People in Group quarters - Short-term care, detention or diagnostic centers for delinquent children (%)
People in Group quarters - Type of juvenile institution unknown (%)
People in Group quarters - Noninstitutionalized population (%)
People in Group quarters - College dormitories (includes college quarters off campus) (%)
People in Group quarters - Military quarters (%)
People in Group quarters - On base (%)
People in Group quarters - Barracks, unaccompanied personnel housing (UPH), (Enlisted/Officer), ;and similar group living quarters for military personnel (%)
People in Group quarters - Transient quarters for temporary residents (%)
People in Group quarters - Military ships (%)
People in Group quarters - Group homes (%)
People in Group quarters - Homes or halfway houses for drug/alcohol abuse (%)
People in Group quarters - Homes for the mentally ill (%)
People in Group quarters - Homes for the mentally retarded (%)
People in Group quarters - Homes for the physically handicapped (%)
People in Group quarters - Other group homes (%)
People in Group quarters - Religious group quarters (%)
People in Group quarters - Dormitories (%)
People in Group quarters - Agriculture workers' dormitories on farms (%)
People in Group quarters - Job Corps and vocational training facilities (%)
People in Group quarters - Other workers' dormitories (%)
People in Group quarters - Crews of maritime vessels (%)
People in Group quarters - Other nonhousehold living situations (%)
People in Group quarters - Other noninstitutional group quarters (%)
Residents speaking English at home (%)
Residents speaking English at home - Born in the United States (%)
Residents speaking English at home - Native, born elsewhere (%)
Residents speaking English at home - Foreign born (%)
Residents speaking Spanish at home (%)
Residents speaking Spanish at home - Born in the United States (%)
Residents speaking Spanish at home - Native, born elsewhere (%)
Residents speaking Spanish at home - Foreign born (%)
Residents speaking other language at home (%)
Residents speaking other language at home - Born in the United States (%)
Residents speaking other language at home - Native, born elsewhere (%)
Residents speaking other language at home - Foreign born (%)
Class of Workers - Employee of private company (%)
Class of Workers - Self-employed in own incorporated business (%)
Class of Workers - Private not-for-profit wage and salary workers (%)
Class of Workers - Local government workers (%)
Class of Workers - State government workers (%)
Class of Workers - Federal government workers (%)
Class of Workers - Self-employed workers in own not incorporated business and Unpaid family workers (%)
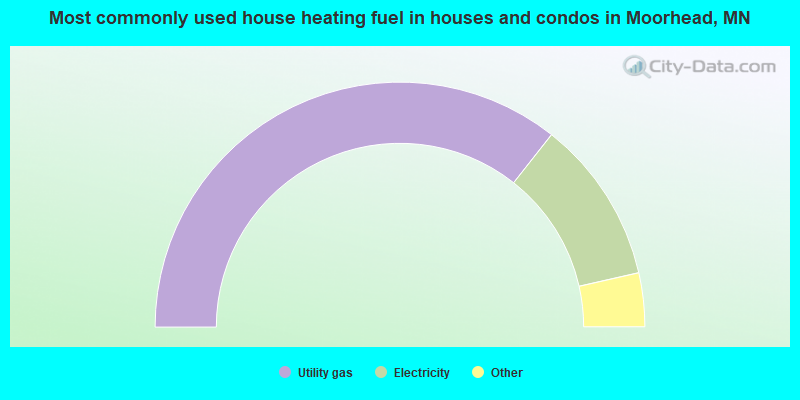
House heating fuel used in houses and condos - Utility gas (%)
House heating fuel used in houses and condos - Bottled, tank, or LP gas (%)
House heating fuel used in houses and condos - Electricity (%)
House heating fuel used in houses and condos - Fuel oil, kerosene, etc. (%)
House heating fuel used in houses and condos - Coal or coke (%)
House heating fuel used in houses and condos - Wood (%)
House heating fuel used in houses and condos - Solar energy (%)
House heating fuel used in houses and condos - Other fuel (%)
House heating fuel used in houses and condos - No fuel used (%)
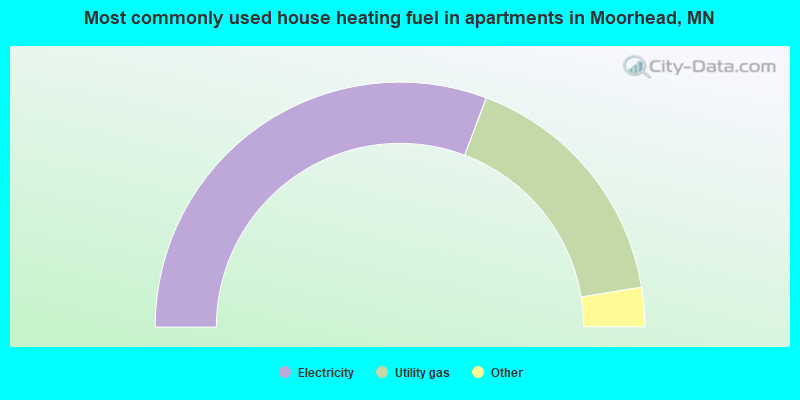
House heating fuel used in apartments - Utility gas (%)
House heating fuel used in apartments - Bottled, tank, or LP gas (%)
House heating fuel used in apartments - Electricity (%)
House heating fuel used in apartments - Fuel oil, kerosene, etc. (%)
House heating fuel used in apartments - Coal or coke (%)
House heating fuel used in apartments - Wood (%)
House heating fuel used in apartments - Solar energy (%)
House heating fuel used in apartments - Other fuel (%)
House heating fuel used in apartments - No fuel used (%)
Armed forces status - In Armed Forces (%)
Armed forces status - Civilian (%)
Armed forces status - Civilian - Veteran (%)
Armed forces status - Civilian - Nonveteran (%)
Fatal accidents locations in years 2005-2021
Fatal accidents locations in 2005
Fatal accidents locations in 2006
Fatal accidents locations in 2007
Fatal accidents locations in 2008
Fatal accidents locations in 2009
Fatal accidents locations in 2010
Fatal accidents locations in 2011
Fatal accidents locations in 2012
Fatal accidents locations in 2013
Fatal accidents locations in 2014
Fatal accidents locations in 2015
Fatal accidents locations in 2016
Fatal accidents locations in 2017
Fatal accidents locations in 2018
Fatal accidents locations in 2019
Fatal accidents locations in 2020
Fatal accidents locations in 2021
Alcohol use - People drinking some alcohol every month (%)
Alcohol use - People not drinking at all (%)
Alcohol use - Average days/month drinking alcohol
Alcohol use - Average drinks/week
Alcohol use - Average days/year people drink much
Audiometry - Average condition of hearing (%)
Audiometry - People that can hear a whisper from across a quiet room (%)
Audiometry - People that can hear normal voice from across a quiet room (%)
Audiometry - Ears ringing, roaring, buzzing (%)
Audiometry - Had a job exposure to loud noise (%)
Audiometry - Had off-work exposure to loud noise (%)
Blood Pressure & Cholesterol - Has high blood pressure (%)
Blood Pressure & Cholesterol - Checking blood pressure at home (%)
Blood Pressure & Cholesterol - Frequently checking blood cholesterol (%)
Blood Pressure & Cholesterol - Has high cholesterol level (%)
Consumer Behavior - Money monthly spent on food at supermarket/grocery store
Consumer Behavior - Money monthly spent on food at other stores
Consumer Behavior - Money monthly spent on eating out
Consumer Behavior - Money monthly spent on carryout/delivered foods
Consumer Behavior - Income spent on food at supermarket/grocery store (%)
Consumer Behavior - Income spent on food at other stores (%)
Consumer Behavior - Income spent on eating out (%)
Consumer Behavior - Income spent on carryout/delivered foods (%)
Current Health Status - General health condition (%)
Current Health Status - Blood donors (%)
Current Health Status - Has blood ever tested for HIV virus (%)
Current Health Status - Left-handed people (%)
Dermatology - People using sunscreen (%)
Diabetes - Diabetics (%)
Diabetes - Had a blood test for high blood sugar (%)
Diabetes - People taking insulin (%)
Diet Behavior & Nutrition - Diet health (%)
Diet Behavior & Nutrition - Milk product consumption (# of products/month)
Diet Behavior & Nutrition - Meals not home prepared (#/week)
Diet Behavior & Nutrition - Meals from fast food or pizza place (#/week)
Diet Behavior & Nutrition - Ready-to-eat foods (#/month)
Diet Behavior & Nutrition - Frozen meals/pizza (#/month)
Drug Use - People that ever used marijuana or hashish (%)
Drug Use - Ever used hard drugs (%)
Drug Use - Ever used any form of cocaine (%)
Drug Use - Ever used heroin (%)
Drug Use - Ever used methamphetamine (%)
Health Insurance - People covered by health insurance (%)
Kidney Conditions-Urology - Avg. # of times urinating at night
Medical Conditions - People with asthma (%)
Medical Conditions - People with anemia (%)
Medical Conditions - People with psoriasis (%)
Medical Conditions - People with overweight (%)
Medical Conditions - Elderly people having difficulties in thinking or remembering (%)
Medical Conditions - People who ever received blood transfusion (%)
Medical Conditions - People having trouble seeing even with glass/contacts (%)
Medical Conditions - People with arthritis (%)
Medical Conditions - People with gout (%)
Medical Conditions - People with congestive heart failure (%)
Medical Conditions - People with coronary heart disease (%)
Medical Conditions - People with angina pectoris (%)
Medical Conditions - People who ever had heart attack (%)
Medical Conditions - People who ever had stroke (%)
Medical Conditions - People with emphysema (%)
Medical Conditions - People with thyroid problem (%)
Medical Conditions - People with chronic bronchitis (%)
Medical Conditions - People with any liver condition (%)
Medical Conditions - People who ever had cancer or malignancy (%)
Mental Health - People who have little interest in doing things (%)
Mental Health - People feeling down, depressed, or hopeless (%)
Mental Health - People who have trouble sleeping or sleeping too much (%)
Mental Health - People feeling tired or having little energy (%)
Mental Health - People with poor appetite or overeating (%)
Mental Health - People feeling bad about themself (%)
Mental Health - People who have trouble concentrating on things (%)
Mental Health - People moving or speaking slowly or too fast (%)
Mental Health - People having thoughts they would be better off dead (%)
Oral Health - Average years since last visit a dentist
Oral Health - People embarrassed because of mouth (%)
Oral Health - People with gum disease (%)
Oral Health - General health of teeth and gums (%)
Oral Health - Average days a week using dental floss/device
Oral Health - Average days a week using mouthwash for dental problem
Oral Health - Average number of teeth
Pesticide Use - Households using pesticides to control insects (%)
Pesticide Use - Households using pesticides to kill weeds (%)
Physical Activity - People doing vigorous-intensity work activities (%)
Physical Activity - People doing moderate-intensity work activities (%)
Physical Activity - People walking or bicycling (%)
Physical Activity - People doing vigorous-intensity recreational activities (%)
Physical Activity - People doing moderate-intensity recreational activities (%)
Physical Activity - Average hours a day doing sedentary activities
Physical Activity - Average hours a day watching TV or videos
Physical Activity - Average hours a day using computer
Physical Functioning - People having limitations keeping them from working (%)
Physical Functioning - People limited in amount of work they can do (%)
Physical Functioning - People that need special equipment to walk (%)
Physical Functioning - People experiencing confusion/memory problems (%)
Physical Functioning - People requiring special healthcare equipment (%)
Prescription Medications - Average number of prescription medicines taking
Preventive Aspirin Use - Adults 40+ taking low-dose aspirin (%)
Reproductive Health - Vaginal deliveries (%)
Reproductive Health - Cesarean deliveries (%)
Reproductive Health - Deliveries resulted in a live birth (%)
Reproductive Health - Pregnancies resulted in a delivery (%)
Reproductive Health - Women breastfeeding newborns (%)
Reproductive Health - Women that had a hysterectomy (%)
Reproductive Health - Women that had both ovaries removed (%)
Reproductive Health - Women that have ever taken birth control pills (%)
Reproductive Health - Women taking birth control pills (%)
Reproductive Health - Women that have ever used Depo-Provera or injectables (%)
Reproductive Health - Women that have ever used female hormones (%)
Sexual Behavior - People 18+ that ever had sex (vaginal, anal, or oral) (%)
Sexual Behavior - Males 18+ that ever had vaginal sex with a woman (%)
Sexual Behavior - Males 18+ that ever performed oral sex on a woman (%)
Sexual Behavior - Males 18+ that ever had anal sex with a woman (%)
Sexual Behavior - Males 18+ that ever had any sex with a man (%)
Sexual Behavior - Females 18+ that ever had vaginal sex with a man (%)
Sexual Behavior - Females 18+ that ever performed oral sex on a man (%)
Sexual Behavior - Females 18+ that ever had anal sex with a man (%)
Sexual Behavior - Females 18+ that ever had any kind of sex with a woman (%)
Sexual Behavior - Average age people first had sex
Sexual Behavior - Average number of female sex partners in lifetime (males 18+)
Sexual Behavior - Average number of female vaginal sex partners in lifetime (males 18+)
Sexual Behavior - Average age people first performed oral sex on a woman (18+)
Sexual Behavior - Average number of woman performed oral sex on in lifetime (18+)
Sexual Behavior - Average number of male sex partners in lifetime (males 18+)
Sexual Behavior - Average number of male anal sex partners in lifetime (males 18+)
Sexual Behavior - Average age people first performed oral sex on a man (18+)
Sexual Behavior - Average number of male oral sex partners in lifetime (18+)
Sexual Behavior - People using protection when performing oral sex (%)
Sexual Behavior - Average number of times people have vaginal or anal sex a year
Sexual Behavior - People having sex without condom (%)
Sexual Behavior - Average number of male sex partners in lifetime (females 18+)
Sexual Behavior - Average number of male vaginal sex partners in lifetime (females 18+)
Sexual Behavior - Average number of female sex partners in lifetime (females 18+)
Sexual Behavior - Circumcised males 18+ (%)
Sleep Disorders - Average hours sleeping at night
Sleep Disorders - People that has trouble sleeping (%)
Smoking-Cigarette Use - People smoking cigarettes (%)
Taste & Smell - People 40+ having problems with smell (%)
Taste & Smell - People 40+ having problems with taste (%)
Taste & Smell - People 40+ that ever had wisdom teeth removed (%)
Taste & Smell - People 40+ that ever had tonsils teeth removed (%)
Taste & Smell - People 40+ that ever had a loss of consciousness because of a head injury (%)
Taste & Smell - People 40+ that ever had a broken nose or other serious injury to face or skull (%)
Taste & Smell - People 40+ that ever had two or more sinus infections (%)
Weight - Average height (inches)
Weight - Average weight (pounds)
Weight - Average BMI
Weight - People that are obese (%)
Weight - People that ever were obese (%)
Weight - People trying to lose weight (%)
Officers per 1,000 residents here:
1.30Minnesota average:
1.76
Latest news from Moorhead, MN collected exclusively by city-data.com from local newspapers, TV, and radio stations
Ancestries: Norwegian (22.0%), German (19.4%), American (5.5%), Scandinavian (4.3%), African (3.4%), European (3.1%).
Current Local Time:
Land area: 13.4 square miles.
Population density: 3,338 people per square mile (average).
3,082 residents are foreign born (3.2% Asia , 2.2% Africa , 0.8% Europe ).
This city:
6.9%Minnesota:
8.5%
Median real estate property taxes paid for housing units with mortgages in 2022: $3,001 (1.3%)Median real estate property taxes paid for housing units with no mortgage in 2022: $3,168 (1.3%)
Nearest city with pop. 50,000+: Fargo, ND
Nearest city with pop. 200,000+: Minneapolis, MN
Nearest city with pop. 1,000,000+: Chicago, IL
Nearest cities:
Prairie Rose, ND (2.2 miles),
Briarwood, ND (2.4 miles),
North River, ND (2.5 miles),
Latitude: 46.86 N, Longitude: 96.76 W
Daytime population change due to commuting: -8,136 (-18.1%)Workers who live and work in this city: 10,619 (43.4%)
Single-family new house construction building permits:
2022: 59 buildings , average cost: $282,0002021: 108 buildings , average cost: $252,6002020: 129 buildings , average cost: $219,8002019: 125 buildings , average cost: $191,2002018: 134 buildings , average cost: $201,9002017: 118 buildings , average cost: $195,6002016: 145 buildings , average cost: $207,9002015: 199 buildings , average cost: $201,3002014: 185 buildings , average cost: $191,1002013: 131 buildings , average cost: $191,0002012: 88 buildings , average cost: $164,9002011: 84 buildings , average cost: $192,9002010: 163 buildings , average cost: $151,6002009: 177 buildings , average cost: $142,2002008: 197 buildings , average cost: $147,8002007: 233 buildings , average cost: $153,3002006: 335 buildings , average cost: $137,1002005: 333 buildings , average cost: $137,4002004: 309 buildings , average cost: $135,3002003: 205 buildings , average cost: $127,1002002: 212 buildings , average cost: $114,0002001: 116 buildings , average cost: $112,6002000: 100 buildings , average cost: $107,1001999: 97 buildings , average cost: $121,4001998: 105 buildings , average cost: $98,5001997: 52 buildings , average cost: $113,500Unemployment in December 2023:
Most common occupations in Moorhead, MN (%)
Both Males Females
Other office and administrative support workers, including supervisors (4.3%)
Building and grounds cleaning and maintenance occupations (4.0%)
Retail sales workers, except cashiers (3.9%)
Other management occupations, except farmers and farm managers (3.7%)
Other sales and related occupations, including supervisors (3.6%)
Secretaries and administrative assistants (3.3%)
Information and record clerks, except customer service representatives (2.8%)
Building and grounds cleaning and maintenance occupations (5.3%)
Driver/sales workers and truck drivers (5.0%)
Electrical equipment mechanics and other installation, maintenance, and repair workers, including supervisors (4.9%)
Other sales and related occupations, including supervisors (4.3%)
Other management occupations, except farmers and farm managers (3.8%)
Retail sales workers, except cashiers (3.7%)
Sales representatives, services, wholesale and manufacturing (3.7%)
Other office and administrative support workers, including supervisors (7.1%)
Secretaries and administrative assistants (5.9%)
Information and record clerks, except customer service representatives (4.4%)
Retail sales workers, except cashiers (4.1%)
Cashiers (4.0%)
Child care workers (3.7%)
Other management occupations, except farmers and farm managers (3.7%)
Air pollution and air quality trends(lower is better)
AQI PM10 PM2.5
Tornado activity:
Moorhead-area historical tornado activity is near Minnesota state average. It is 2% greater than the overall U.S. average.
On 6/28/1975, a category F4 (max. wind speeds 207-260 mph) tornado 1.4 miles away from the Moorhead city center caused between $50,000 and $500,000 in damages.
On 6/20/1957, a category F5 (max. wind speeds 261-318 mph) tornado 25.0 miles away from the city center killed 10 people and injured 103 people and caused between $5,000,000 and $50,000,000 in damages.
Earthquake activity:
Moorhead-area historical earthquake activity is significantly above Minnesota state average. It is 19% smaller than the overall U.S. average. On 7/9/1975 at 14:54:15, a magnitude 4.6 (4.6 MB, Class: Light, Intensity: IV - V) earthquake occurred 89.5 miles away from the city center On 6/5/1993 at 01:24:53, a magnitude 4.1 (4.1 LG, Depth: 6.2 mi) earthquake occurred 85.3 miles away from Moorhead center On 8/18/1959 at 06:37:13, a magnitude 7.7 (7.7 UK, Class: Major, Intensity: VIII - XII) earthquake occurred 688.7 miles away from Moorhead center, causing $26,000,000 total damage On 3/4/1983 at 06:32:18, a magnitude 4.6 (4.4 MB, 4.6 LG, 4.4 ML) earthquake occurred 223.8 miles away from the city center On 10/20/1995 at 15:57:18, a magnitude 3.7 (3.7 LG, Depth: 3.1 mi, Class: Light, Intensity: II - III) earthquake occurred 74.6 miles away from the city center On 10/25/1990 at 06:25:25, a magnitude 3.9 (3.6 MB, 3.9 LG, Depth: 3.1 mi) earthquake occurred 228.1 miles away from Moorhead center Magnitude types: regional Lg-wave magnitude (LG), body-wave magnitude (MB), local magnitude (ML) Natural disasters: The number of natural disasters in Clay County (27) is a lot greater than the US average (15).Major Disasters (Presidential) Declared: 21Emergencies Declared: 4Floods: 22, Storms: 12, Tornadoes: 5, Winds: 3, Winter Storms: 3, Blizzard: 1, Drought: 1, Heavy Rain: 1, Hurricane: 1, Snow: 1, Other: 1 (Note: some incidents may be assigned to more than one category). Main business address for: AMERICAN CRYSTAL SUGAR CO /MN/ SUGAR & CONFECTIONERY PRODUCTS ).
Hospitals and medical centers in Moorhead: CLAY COUNTY RESIDENCE II (2842 VILLAGE DRIVE) ST ANSGAR HOSPITAL (715 N 11TH ST) EVENTIDE LUTHERAN HOME (1405 7TH STREET SOUTH)
GOLDEN LIVINGCENTER - MOORHEAD (2810 NORTH 2ND AVENUE)
Amtrak station near Moorhead: 2 miles: FARGO (420 4TH ST. N) Services: ticket office, fully wheelchair accessible, enclosed waiting area, public restrooms, public payphones, vending machines, free short-term parking, free long-term parking, call for car rental service, taxi stand.
Colleges/Universities in Moorhead: Minnesota State University-Moorhead Full-time enrollment: 6,096; Location: 1104 7th Ave S; Public; Website: www.mnstate.edu; Offers Doctor's degree )
Concordia College at Moorhead Full-time enrollment: 2,767; Location: 901 S 8th St; Private, not-for-profit; Website: www.cord.edu; Offers Master's degree )
Minnesota School of Business-Moorhead Full-time enrollment: 195; Location: 2777 34th Street South; Private, for-profit; Website: www.msbcollege.edu/)
Other colleges/universities with over 2000 students near Moorhead:
North Dakota State University-Main Campus (about 4 miles; Fargo, ND ; Full-time enrollment: 12,680)
North Dakota State College of Science (about 42 miles; Wahpeton, ND ; FT enrollment: 2,318)
Minnesota State Community and Technical College (about 51 miles; Fergus Falls, MN ; FT enrollment: 4,863)
University of North Dakota (about 75 miles; Grand Forks, ND ; FT enrollment: 12,858)
Northland Community and Technical College (about 92 miles; Thief River Falls, MN ; FT enrollment: 2,717)
Alexandria Technical & Community College (about 96 miles; Alexandria, MN ; FT enrollment: 2,324)
Bemidji State University (about 99 miles; Bemidji, MN ; FT enrollment: 4,316)
Public high schools in Moorhead:
Private high school in Moorhead: PARK CHRISTIAN SCHOOL Students: 355, Location: 300 17TH ST N, Grades: PK-12)
Public elementary/middle schools in Moorhead: R. ASP ELEMENTARY Location: 910 N 11TH ST, Grades: KG-5)
ELLEN HOPKINS ELEMENTARY Location: 2020 S 11TH ST, Grades: KG-5)S.G.REINERTSEN ELEMENTARY Location: 1201 40TH AVE S, Grades: KG-5)HORIZON MIDDLE SCHOOL Location: 3601 12TH AVE S, Grades: 6-8)
PROBSTFIELD ELEMENTARY Location: 2410 14TH ST S, Grades: PK-6)
Private elementary/middle school in Moorhead: ST JOSEPH ELEMENTARY SCHOOL Students: 247, Location: 1005 2ND AVE S, Grades: PK-8)
See full list of schools located in Moorhead Library in Moorhead: LAKE AGASSIZ REGIONAL LIBRARY Operating income: $3,272,263; Location: 118 5TH ST S; 270,818 books ; 17,010 e-books ; 17,440 audio materials ; 10,471 video materials ; 14 state licensed databases ; 10 other licensed databases ; 687 print serial subscriptions )
Notable locations in Moorhead: (A) , Heritage Hjemkomst Interpretive Center (B) , Village Green Golf Course (C) , Meadows Golf Course (D) , Moorhead Country Club (E) , Moorhead Travel Information Center (F) , Concordia Field (G) , Moorhead City Hall (H) , Law Enforcement Center (I) , Clay County Courthouse (J) , Moorhead City Library (K) , Moorehead Fire Department South Station (L) , Moorehead Fire Department Headquarters (M) , Concordia College Observatory (N) , Erickson Hall (O) , Grant Center (P) , Hallett Hall (Q) , Outreach Center (R) , International Center (S) , Development Center (T) . Display/hide their locations on the map
Shopping Centers: (1) , Center Mall (2) . Display/hide their locations on the map
Churches in Moorhead include: (A) , Church of Saint John the Divine (B) , Faith Hope Love Church (C) , First Presbyterian Church (D) , Good Shepherd Lutheran Church (E) , Newman Center (F) , Trinity Lutheran Church (G) , United Church of First Congregational (H) , Evangelical Lutheran Church (I) . Display/hide their locations on the map
Cemeteries: (1) , Riverside Cemetery (2) , Saint Joseph Cemetery (3) , Evergreen Cemetery (4) . Display/hide their locations on the map
Parks in Moorhead include: (1) , Knapp Park (2) , Solomon Gilman Comstock House State Historic Site (3) , South Park (4) , Moorview Soccer Complex (5) , Ridgewood Park (6) , Village Green Park (7) , Angeles Park (8) , Riverview Estates Park (9) . Display/hide their locations on the map
Tourist attractions:
Hotels:
Courts:
Birthplace of: Annella Zervas - Benedictine Nun, Warren Magnuson - Politician, Ada Comstock - Women's education pioneer, Adolph Murie - Naturalist, Becky Gulsvig - Stage actress, Brian Lee (ice hockey b. 1987) - Ice hockey player, Chris VandeVelde - Ice hockey player, Dane Sayers - Martial artist, Jason Blake - NHL player (New York Islanders, born : Sep 2, 1973), Jason Blake (ice hockey) - Ice hockey player.
Clay County has a predicted average indoor radon screening level greater than 4 pCi/L (pico curies per liter) - Highest Potential Average household size: This city:
2.4 peopleMinnesota:
2.5 people
Percentage of family households: This city:
58.5%Whole state:
64.6%
Percentage of households with unmarried partners: This city:
6.7%Whole state:
6.9%
Likely homosexual households (counted as self-reported same-sex unmarried-partner households)
Lesbian couples: 0.2% of all households Gay men: 0.2% of all households
People in group quarters in Moorhead in 2010:
3,146 people in college/university student housing
263 people in nursing facilities/skilled-nursing facilities
83 people in emergency and transitional shelters (with sleeping facilities) for people experiencing homelessness
56 people in group homes intended for adults
54 people in local jails and other municipal confinement facilities
21 people in correctional facilities intended for juveniles
10 people in residential treatment centers for adults
7 people in other noninstitutional facilities
6 people in group homes for juveniles (non-correctional)
4 people in workers' group living quarters and job corps centers
People in group quarters in Moorhead in 2000:
3,030 people in college dormitories (includes college quarters off campus)
382 people in nursing homes
210 people in other noninstitutional group quarters
101 people in local jails and other confinement facilities (including police lockups)
44 people in homes for the mentally retarded
21 people in unknown juvenile institutions
17 people in other group homes
14 people in halfway houses
11 people in homes or halfway houses for drug/alcohol abuse
6 people in homes for abused, dependent, and neglected children
Banks with most branches in Moorhead (2011 data):
Wells Fargo Bank, National Association: Moorhead Hornbachers Branch, Moorhead Main Branch, Holiday Branch. Info updated 2011/04/05: Bank assets: $1,161,490.0 mil, Deposits: $905,653.0 mil, headquarters in Sioux Falls, SD, positive income , 6395 total offices , Holding Company: Wells Fargo & Company
Gate City Bank: Moorhead Downtown Branch at 305 8th Street South, branch established on 1999/10/18; Moorhead Branch at 2929 20th Street South, branch established on 1997/10/06. Info updated 2011/07/21: Bank assets: $1,403.0 mil, Deposits: $1,231.5 mil, headquarters in Fargo, ND, positive income , Consumer Lending Specialization, 32 total offices
State Bank of Hawley: Moorhead Branch at 3004 South 14th Street, branch established on 1995/01/18. Info updated 2006/11/03: Bank assets: $90.6 mil, Deposits: $81.4 mil, headquarters in Hawley, MN, positive income , Commercial Lending Specialization, 2 total offices , Holding Company: State Bank Of Hawley Employee Stock Ownership Plan & Trust
Bank of the West: Moorhead Branch at 800 30th Avenue South, branch established on 2006/12/04. Info updated 2009/11/16: Bank assets: $62,408.3 mil, Deposits: $43,995.2 mil, headquarters in San Francisco, CA, positive income , 647 total offices , Holding Company: Bnp Paribas
U.S. Bank National Association: Moorhead Branch at 403 Center Avenue, branch established on 1954/09/09. Info updated 2012/01/30: Bank assets: $330,470.8 mil, Deposits: $236,091.5 mil, headquarters in Cincinnati, OH, positive income , 3121 total offices , Holding Company: U.S. Bancorp
Northwestern Bank, National Association: Moorhead Branch at 2405 South 8th Street, branch established on 1999/02/15. Info updated 2006/11/03: Bank assets: $138.2 mil, Deposits: $116.5 mil, headquarters in Dilworth, MN, positive income , Commercial Lending Specialization, 4 total offices , Holding Company: Northwestern Bancshares, Inc.
BREMER BANK, NATIONAL ASSOCIATION: Moorhead Branch at 3131 Frontage Road South, branch established on 1998/07/13. Info updated 2006/11/03: Bank assets: $1,562.1 mil, Deposits: $1,223.3 mil, headquarters in Fargo, ND, positive income , Commercial Lending Specialization, 18 total offices , Holding Company: Otto Bremer Foundation
State Bank & Trust: Moorhead Branch at 1333 8th Street South, branch established on 1996/11/01. Info updated 2006/11/03: Bank assets: $2,226.6 mil, Deposits: $1,916.5 mil, headquarters in Fargo, ND, positive income , Commercial Lending Specialization, 16 total offices , Holding Company: State Bankshares, Inc.
American Federal Bank: Moorhead Branch at 601 Center Avenue, branch established on 1891/01/01. Info updated 2011/07/21: Bank assets: $439.6 mil, Deposits: $363.5 mil, headquarters in Fargo, ND, positive income , Commercial Lending Specialization, 13 total offices
For population 15 years and over in Moorhead:
Never married: 40.2%Now married: 45.8%Separated: 1.0%Widowed: 4.2%Divorced: 8.7% For population 25 years and over in Moorhead:
High school or higher: 94.0%Bachelor's degree or higher: 39.6%Graduate or professional degree: 13.1%Unemployed: 5.5%Mean travel time to work (commute): 16.6 minutes
Education Gini index (Inequality in education) Here:
10.3Minnesota average:
10.9
Religion statistics for Moorhead, MN (based on Clay County data)
Religion Adherents Congregations Mainline Protestant 17,959 32 Catholic 9,900 11 Evangelical Protestant 8,055 30 Other 24 1 None 23,061 -
Source: Clifford Grammich, Kirk Hadaway, Richard Houseal, Dale E.Jones, Alexei Krindatch, Richie Stanley and Richard H.Taylor. 2012. 2010 U.S.Religion Census: Religious Congregations & Membership Study. Association of Statisticians of American Religious Bodies. Jones, Dale E., et al. 2002. Congregations and Membership in the United States 2000. Nashville, TN: Glenmary Research Center. Graphs represent county-level data
Food Environment Statistics: Number of grocery stores : 7Clay County :
1.28 / 10,000 pop.Minnesota :
1.83 / 10,000 pop.
Number of convenience stores (no gas) : 1This county :
0.18 / 10,000 pop.State :
0.49 / 10,000 pop.
Number of convenience stores (with gas) : 20Here :
3.66 / 10,000 pop.State :
3.90 / 10,000 pop.
Number of full-service restaurants : 22Clay County :
4.03 / 10,000 pop.Minnesota :
6.98 / 10,000 pop.
Adult diabetes rate : Clay County :
6.4%Minnesota :
6.5%
Adult obesity rate : Clay County :
26.5%State :
25.9%
Low-income preschool obesity rate : Clay County :
11.6%Minnesota :
13.0%
Health and Nutrition: Healthy diet rate : Here:
50.9%Minnesota:
50.6%
Average overall health of teeth and gums : Here:
50.6%Minnesota:
48.4%
Average BMI : This city:
28.0Minnesota:
28.5
People feeling badly about themselves : Moorhead:
20.4%Minnesota:
21.0%
People not drinking alcohol at all : Moorhead:
9.5%Minnesota:
9.8%
Average hours sleeping at night : Moorhead:
6.9Minnesota:
6.8
General health condition : Here:
59.1%Minnesota:
57.7%
Average condition of hearing : This city:
80.3%Minnesota:
79.3%
More about Health and Nutrition of Moorhead, MN Residents
Local government employment and payroll (March 2022)
Function
Full-time employees
Monthly full-time payroll
Average yearly full-time wage
Part-time employees
Monthly part-time payroll
Police Protection - Officers
62 $443,683 $85,874 0 $0 Streets and Highways
38 $221,003 $69,790 3 $1,417 Electric Power
38 $314,859 $99,429 3 $576 Firefighters
38 $270,670 $85,475 0 $0 Water Supply
24 $172,105 $86,053 0 $0 Parks and Recreation
23 $139,110 $72,579 34 $10,277 Sewerage
19 $130,357 $82,331 0 $0 Other Government Administration
18 $75,458 $50,305 3 $342 Solid Waste Management
18 $91,993 $61,329 0 $0 Financial Administration
16 $113,810 $85,358 0 $0 Police - Other
13 $66,265 $61,168 9 $15,930 Other and Unallocable
13 $110,243 $101,763 2 $6,312 Natural Resources
7 $36,007 $61,726 4 $3,485 Health
5 $25,294 $60,706 0 $0 Judicial and Legal
4 $37,056 $111,168 1 $3,662 Transit
3 $19,926 $79,704 0 $0 Fire - Other
1 $6,080 $72,960 0 $0 Housing and Community Development (Local)
1 $9,486 $113,832 0 $0
Totals for Government
341 $2,283,405 $80,354 59 $42,001
Moorhead government finances - Expenditure in 2021 (per resident):
Construction - Regular Highways: $19,884,000 ($443.24)
Current Operations - Electric Utilities: $25,078,000 ($559.02)
Police Protection: $11,029,000 ($245.85)Sewerage: $6,428,000 ($143.29)Central Staff Services: $6,140,000 ($136.87)Regular Highways: $5,773,000 ($128.69)Parks and Recreation: $5,520,000 ($123.05)Local Fire Protection: $5,008,000 ($111.63)Water Utilities: $4,629,000 ($103.19)Solid Waste Management: $4,498,000 ($100.27)Transit Utilities: $3,136,000 ($69.90)General - Other: $2,233,000 ($49.78)Financial Administration: $1,460,000 ($32.54)Libraries: $905,000 ($20.17)Judicial and Legal Services: $789,000 ($17.59)Protective Inspection and Regulation - Other: $624,000 ($13.91)General Public Buildings: $534,000 ($11.90)Air Transportation: $505,000 ($11.26)Housing and Community Development: $329,000 ($7.33)Electric Utilities - Interest on Debt: $523,000 ($11.66)
General - Interest on Debt: $6,839,000 ($152.45)
Other Capital Outlay - Transit Utilities: $1,626,000 ($36.25)
Parks and Recreation: $1,057,000 ($23.56)Central Staff Services: $412,000 ($9.18)Financial Administration: $140,000 ($3.12)General Public Building: $78,000 ($1.74)Local Fire Protection: $15,000 ($0.33)Total Salaries and Wages: $28,241,000 ($629.52)
Water Utilities - Interest on Debt: $501,000 ($11.17)
Moorhead government finances - Revenue in 2021 (per resident):
Charges - Sewerage: $8,857,000 ($197.43)
Other: $5,380,000 ($119.93)Solid Waste Management: $4,547,000 ($101.36)Parks and Recreation: $1,664,000 ($37.09)Air Transportation: $75,000 ($1.67)Federal Intergovernmental - Other: $3,547,000 ($79.07)
Highways: $2,282,000 ($50.87)Transit Utilities: $2,006,000 ($44.72)Housing and Community Development: $247,000 ($5.51)Local Intergovernmental - Highways: $461,000 ($10.28)
General Local Government Support: $243,000 ($5.42)Other: $72,000 ($1.60)Miscellaneous - Special Assessments: $9,370,000 ($208.87)
General Revenue - Other: $3,203,000 ($71.40)Interest Earnings: $1,457,000 ($32.48)Sale of Property: $816,000 ($18.19)Fines and Forfeits: $264,000 ($5.88)Rents: $95,000 ($2.12)Donations From Private Sources: $27,000 ($0.60)Revenue - Electric Utilities: $42,686,000 ($951.52)
Water Utilities: $9,947,000 ($221.73)Transit Utilities: $157,000 ($3.50)State Intergovernmental - General Local Government Support: $11,278,000 ($251.40)
Highways: $8,751,000 ($195.07)Transit Utilities: $2,057,000 ($45.85)Other: $1,028,000 ($22.92)Tax - Property: $13,470,000 ($300.26)
Alcoholic Beverage License: $71,000 ($1.58)Other License: $12,000 ($0.27)
Moorhead government finances - Debt in 2021 (per resident):
Long Term Debt - Beginning Outstanding - Unspecified Public Purpose: $244,895,000 ($5458.97)
Outstanding Unspecified Public Purpose: $227,632,000 ($5074.16)Beginning Outstanding - Public Debt for Private Purpose: $99,574,000 ($2219.61)Outstanding Nonguaranteed - Industrial Revenue: $80,685,000 ($1798.56)Retired Unspecified Public Purpose: $31,531,000 ($702.86)Retired Nonguaranteed - Public Debt for Private Purpose: $18,889,000 ($421.06)Issue, Unspecified Public Purpose: $14,268,000 ($318.05)
Moorhead government finances - Cash and Securities in 2021 (per resident):
Other Funds - Cash and Securities: $49,498,000 ($1103.36)
Sinking Funds - Cash and Securities: $55,029,000 ($1226.66)
Businesses in Moorhead, MN
Name Count Name Count
Ace Hardware 1 New Balance 1 AmericInn 1 Nike 1 Arby's 1 Papa John's Pizza 1 Buffalo Wild Wings 1 Payless 1 Burger King 2 Pizza Hut 1 CVS 1 Qdoba Mexican Grill 1 Carson Pirie Scott 1 Quiznos 1 Curves 1 RadioShack 1 Dairy Queen 2 Sears 1 Domino's Pizza 1 Starbucks 1 Fashion Bug 1 Subaru 1 FedEx 2 Subway 3 GNC 1 Super 8 1 H&R Block 1 T-Mobile 1 Jones New York 1 Taco Bell 2 KFC 1 Target 1 Kmart 1 Travelodge 1 Lane Furniture 2 True Value 1 Little Caesars Pizza 1 U-Haul 1 MasterBrand Cabinets 1 UPS 3 Maurices 1 Village Inn 1 McDonald's 2 Walgreens 2 Menards 1
Strongest AM radio stations in Moorhead:
KVOX (1280 AM; 5 kW; MOORHEAD, MN; Owner: CAPSTAR TX LIMITED PARTNERSHIP)
KFNW (1200 AM; 10 kW; WEST FARGO, ND; Owner: NORTHWESTERN COLLEGE)
WDAY (970 AM; 5 kW; FARGO, ND; Owner: FORUM COMMUNICATIONS COMPANY)
KFGO (790 AM; 5 kW; FARGO, ND; Owner: CAPSTAR TX LIMITED PARTNERSHIP)
KQWB (1660 AM; 10 kW; WEST FARGO, ND; Owner: MONTEREY LICENSES, LLC)
WWNL (1080 AM; 50 kW; PITTSBURGH, PA; Owner: STEEL CITY RADIO, INC.)
KPRM (870 AM; 25 kW; PARK RAPIDS, MN; Owner: DE LA HUNT BROADCASTING CORP.)
KBRF (1250 AM; 10 kW; FERGUS FALLS, MN; Owner: RESULT RADIO, INC.)
KXMR (710 AM; 50 kW; BISMARCK, ND; Owner: RADIO BISMARCK MANDAN, LLC)
WEBC (560 AM; 50 kW; DULUTH, MN)
WCCO (830 AM; 50 kW; MINNEAPOLIS, MN; Owner: INFINITY MEDIA CORPORATION)
KSJB (600 AM; 5 kW; JAMESTOWN, ND; Owner: CHESTERMAN COMM. JAMESTOWN, INC.)
WCTS (1030 AM; 50 kW; MAPLEWOOD, MN; Owner: CNTL. BAPT. THEO/AL SEMI MINNEAPOLIS)
Strongest FM radio stations in Moorhead:
KVOX-FM (99.9 FM; MOORHEAD, MN; Owner: MONTEREY LICENSES, LLC)
KCCM-FM (91.1 FM; MOORHEAD, MN; Owner: MINNESOTA PUBLIC RADIO)
KQWB-FM (98.7 FM; MOORHEAD, MN; Owner: MONTEREY LICENSES, LLC)
KFAB-FM (92.7 FM; KINDRED, ND; Owner: CAPSTAR TX LIMITED PARTNERSHIP)
KCCD (90.3 FM; MOORHEAD, MN; Owner: MINNESOTA PUBLIC RADIO)
WDAY-FM (93.7 FM; FARGO, ND; Owner: CAPSTAR TX LIMITED PARTNERSHIP)
KFNW-FM (97.9 FM; FARGO, ND; Owner: NORTHWESTERN COLLEGE)
KKBX (101.9 FM; FARGO, ND; Owner: CAPSTAR TX LIMITED PARTNERSHIP)
KDSU (91.9 FM; FARGO, ND; Owner: NORTH DAKOTA STATE UNIVERSITY)
KPFX (107.9 FM; FARGO, ND; Owner: MONTEREY LICENSES, LLC)
KFBN (88.7 FM; FARGO, ND; Owner: FARGO BAPTIST CHURCH)
KLTA (105.1 FM; BRECKENRIDGE, MN; Owner: MONTEREY LICENSES, LLC)
KEGK (106.9 FM; WAHPETON, ND; Owner: GUDERIAN BROADCASTING, INC.)
KRVI (95.1 FM; DETROIT LAKES, MN; Owner: CAPSTAR TX LIMITED PARTNERSHIP)
KDAM (104.7 FM; HOPE, ND; Owner: CLEAR CHANNEL BROADCASTING LICENSES, INC.)
KDJZ (100.7 FM; HARWOOD, ND; Owner: TOM INGSTAD NORTH DAKOTA BROADCASTING LLC)
TV broadcast stations around Moorhead:
KVRR (Channel 15; FARGO, ND; Owner: RED RIVER BROADCAST CO., LLC)
KVNJ-LP (Channel 2; FARGO, ND; Owner: G.I.G., INC.)
K56ET (Channel 56; FARGO, ND; Owner: TRINITY BROADCASTING NETWORK)
WDAY-TV (Channel 6; FARGO, ND; Owner: FORUM COMMUNICATIONS COMPANY)
KFME (Channel 13; FARGO, ND; Owner: PRAIRIE PUBLIC BROADCASTING, INC.)
KXJB-TV (Channel 4; VALLEY CITY, ND; Owner: CATAMOUNT BROADCASTING OF FARGO LLC)
KVLY-TV (Channel 11; FARGO, ND; Owner: NORTH DAKOTA TELEVISION LICENSE SUB, L.L.C.)
National Bridge Inventory (NBI) Statistics 58 Number of bridges1,122ft / 342m Total length $2,290,999,000 Total costs770,086 Total average daily traffic61,629 Total average daily truck traffic
New bridges - historical statistics
2 1930-1939 7 1950-1959 8 1960-1969 4 1970-1979 2 1980-1989 15 1990-1999 15 2000-2009 5 2010-2019
See full National Bridge Inventory statistics for Moorhead, MN
Home Mortgage Disclosure Act Aggregated Statistics For Year 2009(Based on 6 full and 2 partial tracts) A) FHA, FSA/RHS & VA B) Conventional C) Refinancings D) Home Improvement Loans E) Loans on Dwellings For 5+ Families F) Non-occupant Loans on G) Loans On Manufactured Number Average Value Number Average Value Number Average Value Number Average Value Number Average Value Number Average Value Number Average Value
LOANS ORIGINATED 213 $125,068 177 $120,407 607 $127,604 85 $34,578 3 $703,000 62 $154,264 1 $73,480 APPLICATIONS APPROVED, NOT ACCEPTED 9 $130,724 5 $114,134 43 $109,868 4 $112,968 0 $0 2 $63,000 0 $0 APPLICATIONS DENIED 18 $123,953 12 $103,068 124 $126,448 24 $24,451 1 $104,000 15 $86,108 3 $32,890 APPLICATIONS WITHDRAWN 13 $121,848 19 $127,347 117 $132,569 16 $60,600 0 $0 3 $109,537 1 $73,480 FILES CLOSED FOR INCOMPLETENESS 0 $0 0 $0 27 $152,420 4 $21,250 0 $0 0 $0 0 $0
Aggregated Statistics For Year 2008(Based on 6 full and 2 partial tracts) A) FHA, FSA/RHS & VA B) Conventional C) Refinancings D) Home Improvement Loans E) Loans on Dwellings For 5+ Families F) Non-occupant Loans on G) Loans On Manufactured Number Average Value Number Average Value Number Average Value Number Average Value Number Average Value Number Average Value Number Average Value
LOANS ORIGINATED 165 $122,302 234 $123,635 356 $93,048 151 $31,578 17 $420,051 85 $114,485 1 $64,000 APPLICATIONS APPROVED, NOT ACCEPTED 3 $102,333 12 $129,676 27 $131,630 9 $58,196 1 $90,000 1 $92,000 0 $0 APPLICATIONS DENIED 10 $113,317 29 $97,110 128 $126,141 41 $20,216 0 $0 6 $101,500 7 $28,407 APPLICATIONS WITHDRAWN 6 $106,913 25 $125,422 73 $112,663 19 $36,432 0 $0 6 $73,187 1 $35,000 FILES CLOSED FOR INCOMPLETENESS 1 $140,000 2 $88,595 11 $134,164 4 $32,415 0 $0 0 $0 0 $0
Aggregated Statistics For Year 2007(Based on 6 full and 2 partial tracts) A) FHA, FSA/RHS & VA B) Conventional C) Refinancings D) Home Improvement Loans E) Loans on Dwellings For 5+ Families F) Non-occupant Loans on G) Loans On Manufactured Number Average Value Number Average Value Number Average Value Number Average Value Number Average Value Number Average Value Number Average Value
LOANS ORIGINATED 94 $119,113 464 $114,456 359 $91,024 198 $30,252 5 $510,688 86 $100,064 4 $34,250 APPLICATIONS APPROVED, NOT ACCEPTED 1 $163,920 20 $121,972 51 $97,096 18 $32,177 0 $0 5 $94,158 1 $14,000 APPLICATIONS DENIED 7 $126,043 54 $95,379 205 $108,375 59 $33,076 2 $105,000 12 $83,557 6 $31,398 APPLICATIONS WITHDRAWN 6 $134,122 36 $123,079 99 $101,833 23 $23,026 0 $0 5 $66,938 0 $0 FILES CLOSED FOR INCOMPLETENESS 0 $0 8 $109,989 41 $123,735 1 $73,480 0 $0 4 $148,555 0 $0
Aggregated Statistics For Year 2006(Based on 6 full and 2 partial tracts) A) FHA, FSA/RHS & VA B) Conventional C) Refinancings D) Home Improvement Loans E) Loans on Dwellings For 5+ Families F) Non-occupant Loans on G) Loans On Manufactured Number Average Value Number Average Value Number Average Value Number Average Value Number Average Value Number Average Value Number Average Value
LOANS ORIGINATED 113 $114,206 535 $97,660 439 $88,798 154 $29,822 8 $786,444 143 $79,653 3 $37,667 APPLICATIONS APPROVED, NOT ACCEPTED 2 $102,000 31 $100,617 62 $82,328 14 $26,490 0 $0 10 $79,653 0 $0 APPLICATIONS DENIED 8 $112,922 53 $85,116 202 $96,247 50 $34,229 0 $0 18 $73,846 3 $12,457 APPLICATIONS WITHDRAWN 3 $141,180 61 $104,355 147 $112,215 25 $49,600 1 $150,000 26 $91,868 0 $0 FILES CLOSED FOR INCOMPLETENESS 1 $128,000 20 $92,390 62 $111,898 4 $15,000 0 $0 10 $74,580 0 $0
Aggregated Statistics For Year 2005(Based on 6 full and 2 partial tracts) A) FHA, FSA/RHS & VA B) Conventional C) Refinancings D) Home Improvement Loans E) Loans on Dwellings For 5+ Families F) Non-occupant Loans on G) Loans On Manufactured Number Average Value Number Average Value Number Average Value Number Average Value Number Average Value Number Average Value Number Average Value
LOANS ORIGINATED 130 $113,779 600 $98,402 551 $93,934 206 $28,219 13 $428,395 169 $95,413 1 $48,940 APPLICATIONS APPROVED, NOT ACCEPTED 2 $110,070 57 $90,385 63 $90,059 8 $26,459 0 $0 23 $88,123 2 $26,500 APPLICATIONS DENIED 9 $106,897 55 $87,863 198 $102,344 73 $34,964 0 $0 39 $89,104 4 $20,000 APPLICATIONS WITHDRAWN 9 $123,799 62 $102,408 151 $112,497 27 $72,832 0 $0 20 $86,322 0 $0 FILES CLOSED FOR INCOMPLETENESS 1 $17,000 16 $107,421 101 $117,695 5 $74,442 0 $0 8 $117,060 0 $0
Aggregated Statistics For Year 2004(Based on 6 full and 2 partial tracts) A) FHA, FSA/RHS & VA B) Conventional C) Refinancings D) Home Improvement Loans E) Loans on Dwellings For 5+ Families F) Non-occupant Loans on G) Loans On Manufactured Number Average Value Number Average Value Number Average Value Number Average Value Number Average Value Number Average Value Number Average Value
LOANS ORIGINATED 141 $99,746 493 $99,545 594 $83,325 137 $27,640 12 $568,982 126 $79,646 5 $28,842 APPLICATIONS APPROVED, NOT ACCEPTED 1 $122,000 36 $100,123 77 $88,057 15 $27,766 0 $0 12 $96,280 3 $51,000 APPLICATIONS DENIED 7 $99,231 46 $84,856 152 $85,852 55 $26,354 0 $0 14 $96,202 9 $32,321 APPLICATIONS WITHDRAWN 9 $82,479 44 $103,025 143 $98,553 14 $34,905 0 $0 15 $87,683 0 $0 FILES CLOSED FOR INCOMPLETENESS 0 $0 4 $96,280 112 $104,214 2 $36,000 0 $0 2 $73,000 0 $0
Aggregated Statistics For Year 2003(Based on 6 full and 2 partial tracts) A) FHA, FSA/RHS & VA B) Conventional C) Refinancings D) Home Improvement Loans E) Loans on Dwellings For 5+ Families F) Non-occupant Loans on Number Average Value Number Average Value Number Average Value Number Average Value Number Average Value Number Average Value
LOANS ORIGINATED 134 $97,213 431 $99,029 1,419 $87,633 81 $23,082 10 $327,488 119 $66,975 APPLICATIONS APPROVED, NOT ACCEPTED 1 $77,000 27 $93,918 83 $92,197 8 $36,328 0 $0 5 $44,400 APPLICATIONS DENIED 7 $85,536 35 $72,190 274 $86,869 31 $12,041 0 $0 19 $75,319 APPLICATIONS WITHDRAWN 8 $82,365 39 $99,129 183 $84,747 6 $38,687 0 $0 8 $98,878 FILES CLOSED FOR INCOMPLETENESS 2 $74,500 7 $111,827 22 $79,295 1 $3,320 0 $0 2 $85,505
Aggregated Statistics For Year 2002(Based on 6 full and 1 partial tracts) A) FHA, FSA/RHS & VA B) Conventional C) Refinancings D) Home Improvement Loans E) Loans on Dwellings For 5+ Families F) Non-occupant Loans on Number Average Value Number Average Value Number Average Value Number Average Value Number Average Value Number Average Value
LOANS ORIGINATED 157 $87,836 307 $78,095 750 $81,014 83 $22,799 8 $316,569 74 $59,686 APPLICATIONS APPROVED, NOT ACCEPTED 3 $61,183 11 $79,882 84 $67,230 14 $13,204 0 $0 7 $67,086 APPLICATIONS DENIED 6 $66,095 42 $56,923 152 $69,142 27 $13,198 0 $0 12 $54,026 APPLICATIONS WITHDRAWN 8 $83,498 24 $83,334 97 $88,866 3 $9,000 0 $0 8 $64,199 FILES CLOSED FOR INCOMPLETENESS 0 $0 0 $0 80 $87,972 2 $46,730 0 $0 0 $0
Aggregated Statistics For Year 2001(Based on 6 full and 1 partial tracts) A) FHA, FSA/RHS & VA B) Conventional C) Refinancings D) Home Improvement Loans E) Loans on Dwellings For 5+ Families F) Non-occupant Loans on Number Average Value Number Average Value Number Average Value Number Average Value Number Average Value Number Average Value
LOANS ORIGINATED 204 $82,113 250 $78,462 614 $69,807 65 $20,201 12 $285,241 32 $64,188 APPLICATIONS APPROVED, NOT ACCEPTED 2 $84,000 12 $63,890 42 $62,606 11 $20,223 0 $0 4 $63,022 APPLICATIONS DENIED 7 $66,506 23 $33,637 162 $59,882 26 $23,584 0 $0 5 $55,446 APPLICATIONS WITHDRAWN 15 $72,037 18 $89,217 73 $71,209 6 $14,130 0 $0 4 $42,500 FILES CLOSED FOR INCOMPLETENESS 0 $0 3 $96,990 16 $81,629 2 $17,000 0 $0 0 $0
Aggregated Statistics For Year 2000(Based on 6 full and 1 partial tracts) A) FHA, FSA/RHS & VA B) Conventional C) Refinancings D) Home Improvement Loans E) Loans on Dwellings For 5+ Families F) Non-occupant Loans on Number Average Value Number Average Value Number Average Value Number Average Value Number Average Value Number Average Value
LOANS ORIGINATED 168 $77,360 252 $79,308 196 $49,999 96 $14,772 6 $130,333 42 $52,799 APPLICATIONS APPROVED, NOT ACCEPTED 2 $62,800 21 $56,660 36 $58,593 16 $17,124 0 $0 2 $110,000 APPLICATIONS DENIED 13 $81,556 70 $34,316 109 $49,220 31 $18,789 0 $0 9 $89,380 APPLICATIONS WITHDRAWN 1 $90,000 16 $100,668 50 $63,256 11 $31,435 0 $0 1 $80,000 FILES CLOSED FOR INCOMPLETENESS 1 $42,090 1 $34,340 13 $87,285 0 $0 0 $0 1 $26,000
Aggregated Statistics For Year 1999(Based on 6 full and 3 partial tracts) A) FHA, FSA/RHS & VA B) Conventional C) Refinancings D) Home Improvement Loans E) Loans on Dwellings For 5+ Families F) Non-occupant Loans on Number Average Value Number Average Value Number Average Value Number Average Value Number Average Value Number Average Value
LOANS ORIGINATED 185 $72,413 233 $75,725 352 $52,352 84 $16,378 8 $392,845 38 $47,719 APPLICATIONS APPROVED, NOT ACCEPTED 1 $51,650 13 $83,830 57 $52,730 12 $19,619 0 $0 1 $50,000 APPLICATIONS DENIED 18 $80,864 42 $41,533 125 $40,563 43 $17,428 0 $0 7 $61,131 APPLICATIONS WITHDRAWN 6 $64,215 18 $81,385 67 $64,307 22 $40,721 0 $0 5 $40,464 FILES CLOSED FOR INCOMPLETENESS 1 $54,340 5 $81,144 12 $76,769 0 $0 0 $0 2 $59,500
Detailed HMDA statistics for the following Tracts:
0201.00
, 0202.02 , 0203.00 , 0204.00 , 0205.00 , 0206.00 , 0301.03 , 0301.06
Private Mortgage Insurance Companies Aggregated Statistics For Year 2009(Based on 6 full and 2 partial tracts) A) Conventional B) Refinancings C) Non-occupant Loans on Number Average Value Number Average Value Number Average Value
LOANS ORIGINATED 30 $153,063 19 $146,684 0 $0 APPLICATIONS APPROVED, NOT ACCEPTED 4 $145,105 3 $150,173 1 $47,630 APPLICATIONS DENIED 0 $0 5 $134,720 0 $0 APPLICATIONS WITHDRAWN 2 $124,000 2 $94,175 0 $0 FILES CLOSED FOR INCOMPLETENESS 0 $0 0 $0 0 $0
Aggregated Statistics For Year 2008(Based on 6 full and 2 partial tracts) A) Conventional B) Refinancings C) Non-occupant Loans on Number Average Value Number Average Value Number Average Value
LOANS ORIGINATED 73 $121,500 26 $152,978 9 $102,396 APPLICATIONS APPROVED, NOT ACCEPTED 19 $130,935 5 $111,534 2 $148,420 APPLICATIONS DENIED 4 $115,378 1 $114,620 0 $0 APPLICATIONS WITHDRAWN 1 $69,230 3 $100,473 1 $99,000 FILES CLOSED FOR INCOMPLETENESS 1 $113,000 0 $0 1 $113,000
Aggregated Statistics For Year 2007(Based on 6 full and 2 partial tracts) A) Conventional B) Refinancings C) Non-occupant Loans on Number Average Value Number Average Value Number Average Value
LOANS ORIGINATED 173 $123,888 46 $127,267 16 $96,022 APPLICATIONS APPROVED, NOT ACCEPTED 13 $115,572 10 $170,868 1 $118,510 APPLICATIONS DENIED 3 $87,737 0 $0 3 $87,737 APPLICATIONS WITHDRAWN 5 $96,876 5 $169,784 3 $77,093 FILES CLOSED FOR INCOMPLETENESS 1 $221,860 1 $143,000 0 $0
Aggregated Statistics For Year 2006(Based on 6 full and 2 partial tracts) A) Conventional B) Refinancings C) Non-occupant Loans on Number Average Value Number Average Value Number Average Value
LOANS ORIGINATED 96 $123,278 35 $131,884 10 $115,723 APPLICATIONS APPROVED, NOT ACCEPTED 5 $111,144 6 $110,677 0 $0 APPLICATIONS DENIED 0 $0 0 $0 0 $0 APPLICATIONS WITHDRAWN 1 $121,000 6 $120,773 0 $0 FILES CLOSED FOR INCOMPLETENESS 0 $0 0 $0 0 $0
Aggregated Statistics For Year 2005(Based on 6 full and 2 partial tracts) A) Conventional B) Refinancings C) Non-occupant Loans on Number Average Value Number Average Value Number Average Value
LOANS ORIGINATED 102 $116,523 45 $119,742 28 $97,498 APPLICATIONS APPROVED, NOT ACCEPTED 9 $128,531 16 $108,728 3 $102,000 APPLICATIONS DENIED 2 $350,840 1 $120,000 1 $120,000 APPLICATIONS WITHDRAWN 6 $205,070 8 $107,500 1 $150,000 FILES CLOSED FOR INCOMPLETENESS 0 $0 0 $0 0 $0
Aggregated Statistics For Year 2004(Based on 6 full and 2 partial tracts) A) Conventional B) Refinancings C) Non-occupant Loans on Number Average Value Number Average Value Number Average Value
LOANS ORIGINATED 95 $107,378 44 $114,129 21 $77,772 APPLICATIONS APPROVED, NOT ACCEPTED 11 $105,415 15 $113,808 2 $116,785 APPLICATIONS DENIED 6 $81,500 2 $105,000 2 $92,000 APPLICATIONS WITHDRAWN 6 $82,825 4 $79,752 5 $68,200 FILES CLOSED FOR INCOMPLETENESS 2 $71,060 0 $0 1 $74,000
Aggregated Statistics For Year 2003(Based on 6 full and 2 partial tracts) A) Conventional B) Refinancings C) Non-occupant Loans on Number Average Value Number Average Value Number Average Value
LOANS ORIGINATED 103 $104,652 132 $101,024 15 $72,343 APPLICATIONS APPROVED, NOT ACCEPTED 14 $118,011 22 $117,280 3 $83,333 APPLICATIONS DENIED 2 $73,500 2 $165,745 2 $73,500 APPLICATIONS WITHDRAWN 4 $91,360 2 $107,050 0 $0 FILES CLOSED FOR INCOMPLETENESS 2 $114,000 1 $150,000 0 $0
Aggregated Statistics For Year 2002(Based on 6 full and 1 partial tracts) A) Conventional B) Refinancings C) Non-occupant Loans on Number Average Value Number Average Value Number Average Value
LOANS ORIGINATED 84 $84,807 75 $95,946 28 $68,715 APPLICATIONS APPROVED, NOT ACCEPTED 8 $79,170 12 $89,972 5 $49,814 APPLICATIONS DENIED 1 $79,000 4 $88,500 3 $69,000 APPLICATIONS WITHDRAWN 2 $65,115 5 $70,162 3 $68,270 FILES CLOSED FOR INCOMPLETENESS 0 $0 0 $0 0 $0
Aggregated Statistics For Year 2001(Based on 6 full and 1 partial tracts) A) Conventional B) Refinancings C) Non-occupant Loans on Number Average Value Number Average Value Number Average Value
LOANS ORIGINATED 66 $92,161 40 $101,561 8 $62,650 APPLICATIONS APPROVED, NOT ACCEPTED 3 $74,827 4 $88,500 0 $0 APPLICATIONS DENIED 2 $89,000 2 $94,075 1 $99,000 APPLICATIONS WITHDRAWN 0 $0 1 $82,000 0 $0 FILES CLOSED FOR INCOMPLETENESS 0 $0 0 $0 0 $0
Aggregated Statistics For Year 2000(Based on 6 full and 1 partial tracts) A) Conventional B) Refinancings C) Non-occupant Loans on Number Average Value Number Average Value Number Average Value
LOANS ORIGINATED 75 $85,070 9 $94,838 11 $52,184 APPLICATIONS APPROVED, NOT ACCEPTED 9 $80,502 2 $87,500 0 $0 APPLICATIONS DENIED 0 $0 0 $0 0 $0 APPLICATIONS WITHDRAWN 2 $58,000 0 $0 0 $0 FILES CLOSED FOR INCOMPLETENESS 0 $0 0 $0 0 $0
Aggregated Statistics For Year 1999(Based on 6 full and 3 partial tracts) A) Conventional B) Refinancings C) Non-occupant Loans on Number Average Value Number Average Value Number Average Value
LOANS ORIGINATED 83 $86,166 23 $90,707 5 $75,428 APPLICATIONS APPROVED, NOT ACCEPTED 4 $63,565 3 $73,333 0 $0 APPLICATIONS DENIED 2 $77,860 1 $72,110 0 $0 APPLICATIONS WITHDRAWN 0 $0 1 $66,120 0 $0 FILES CLOSED FOR INCOMPLETENESS 0 $0 0 $0 0 $0
Detailed PMIC statistics for the following Tracts:
0201.00
, 0202.02 , 0203.00 , 0204.00 , 0205.00 , 0206.00 , 0301.03 , 0301.06 Fire-safe hotels and motels in Moorhead, Minnesota:
Super 8 Motel, 3621 S 8TH St, Moorhead, Minnesota 56560 Phone: (218) 233-8880, Fax: (218) 233-8880
Courtyard By Marriott Fargo-Moorhead, 1080 28th Ave S, Moorhead, Minnesota 56560 Phone: (218) 284-1000, Fax: (218) 284-1200
Grand Inn Moorhead, 810 Belsly Blvd Moorhead, Moorhead, Minnesota 56560 Phone: (218) 233-7501, Fax: (218) 236-7852
Microtel Inn & Suites, 2915 12th Street S, Moorhead, Minnesota 56560 Phone: (218) 284-4022, Fax: (218) 284-4023
Americinn Lodge & Suites & Event Center Of Moorhead, 600 30th Ave S, Moorhead, Minnesota 56560 Phone: (218) 287-7100, Fax: (218) 287-4862
All 5 fire-safe hotels and motels in Moorhead, Minnesota
Most common first names in Moorhead, MN among deceased individuals Name Count Lived (average)
John 139 74.7 years Robert 104 71.6 years Anna 77 84.4 years James 75 71.9 years Mary 72 80.2 years William 72 77.4 years Arthur 70 77.9 years Helen 65 82.5 years George 64 77.5 years Clara 59 84.2 years
Most common last names in Moorhead, MN among deceased individuals Last name Count Lived (average)
Johnson 186 78.9 years Anderson 126 79.6 years Olson 109 78.8 years Nelson 105 77.3 years Larson 89 79.1 years Peterson 86 79.3 years Hanson 52 79.0 years Erickson 51 79.0 years Smith 42 74.9 years Thompson 40 77.1 years
Moorhead compared to Minnesota state average:
Unemployed percentage below state average. Median age significantly below state average. Length of stay since moving in above state average. Number of college students above state average.
#3 on the list of "Top 101 cities with the most local government spending on highway construction per resident (population 10,000+)"
#9 (56560) on the list of "Top 101 zip codes with the largest percentage of Norwegian first ancestries (pop 5,000+)"
Top Patent Applicants
Allen C. Faue (51)
Robert Shaw (13)
Gordon J. Lee (5)
Gregory K. Harmelink (3)
Divyata Kakumanu (3)
Erik S. Hopperstad (3)
Kristin A. Schipull (3)
Douglas L. Schulz (3)
Jacob A. Halvorson (2)
Gary H. Strom (2)
Total of 143 patent applications in 2008-2024.
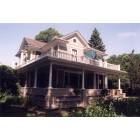


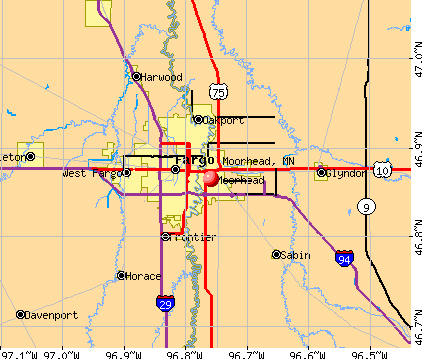


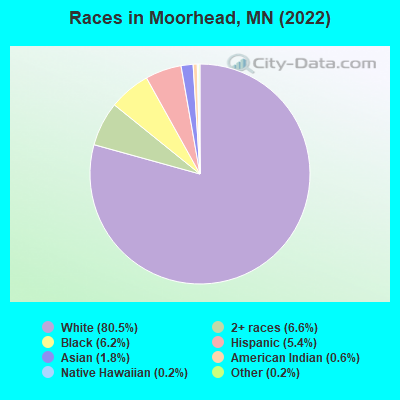
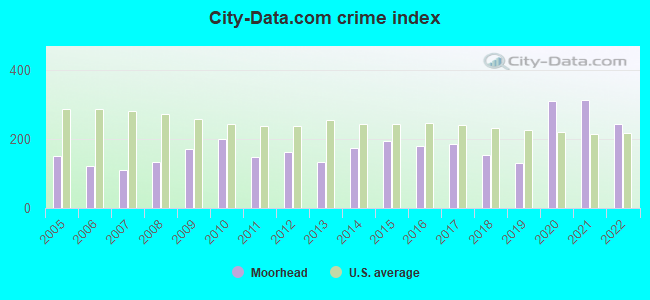
 Recent articles from our blog. Our writers, many of them Ph.D. graduates or candidates, create easy-to-read articles on a wide variety of topics.

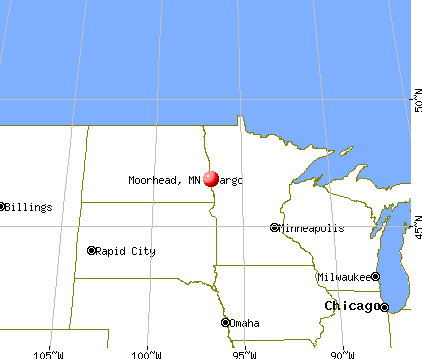
 (2.4 miles
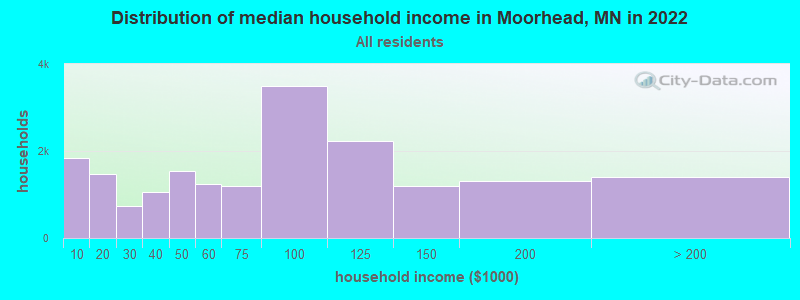
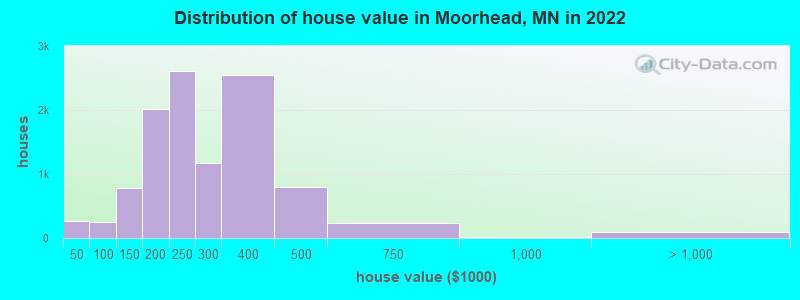

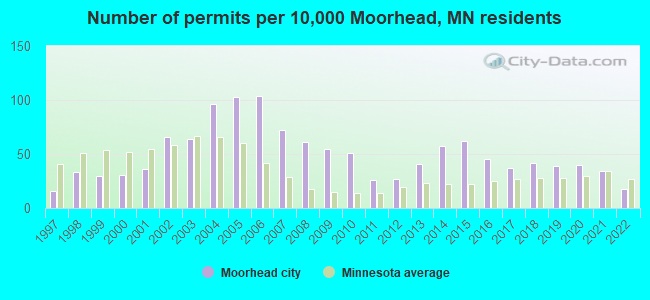
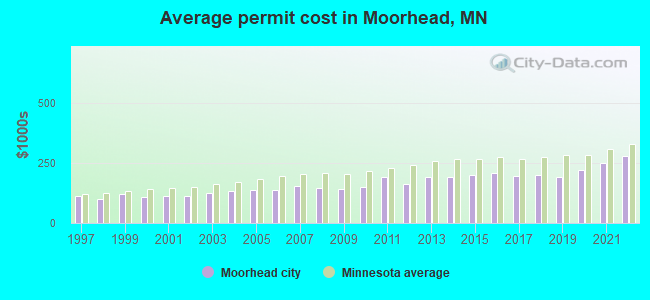
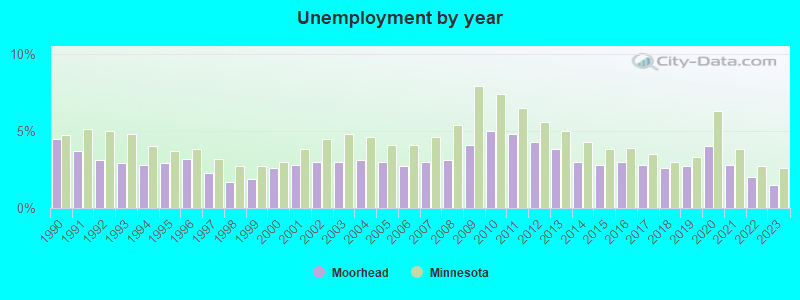
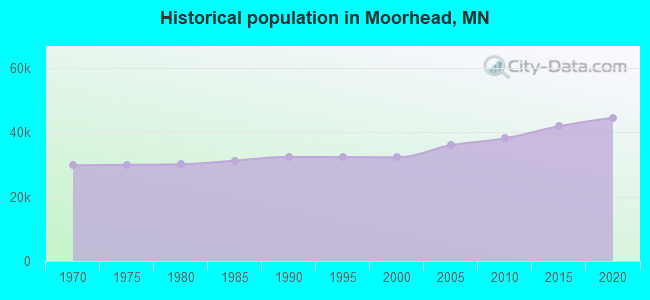
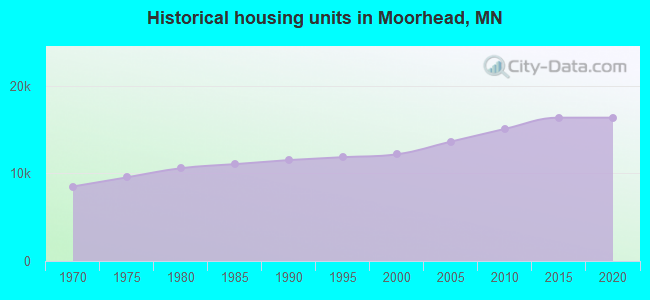
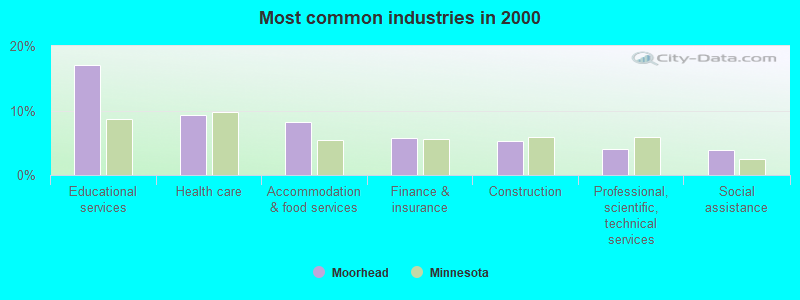
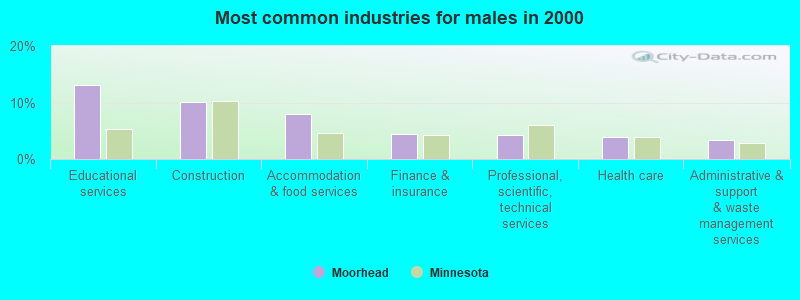
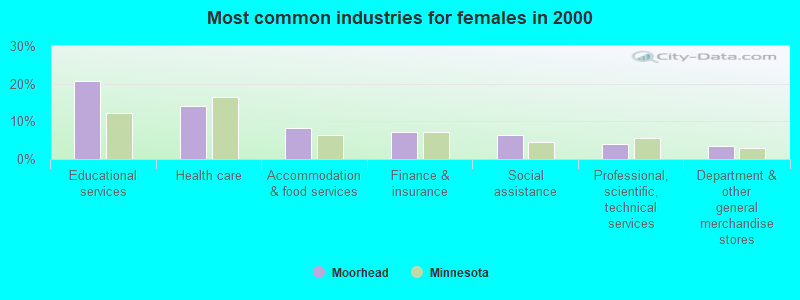
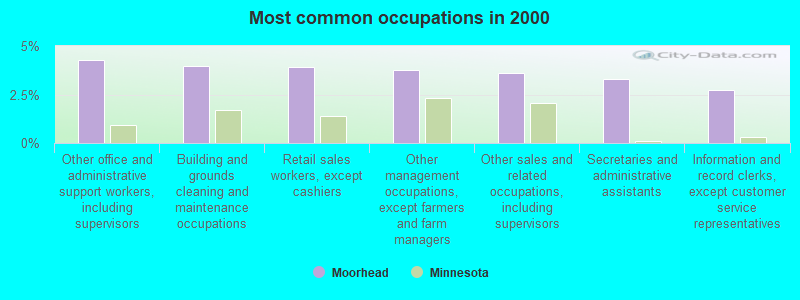
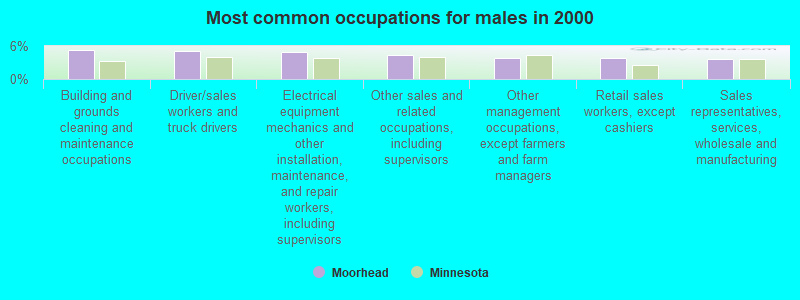
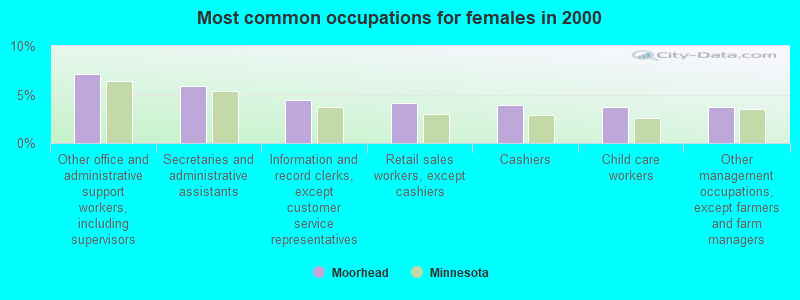
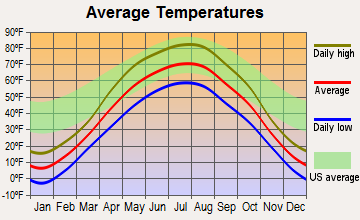
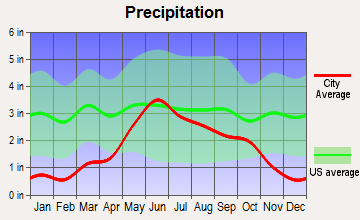
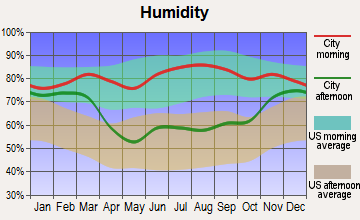
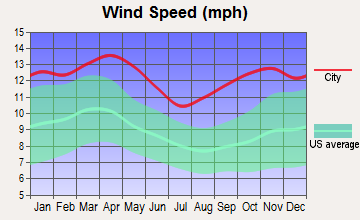
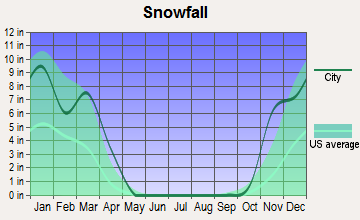
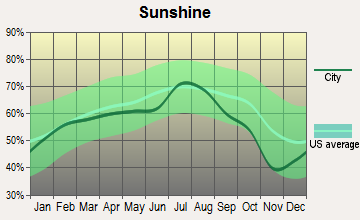
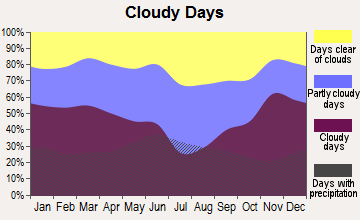


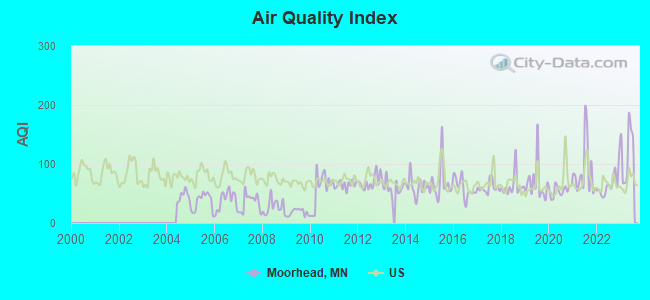
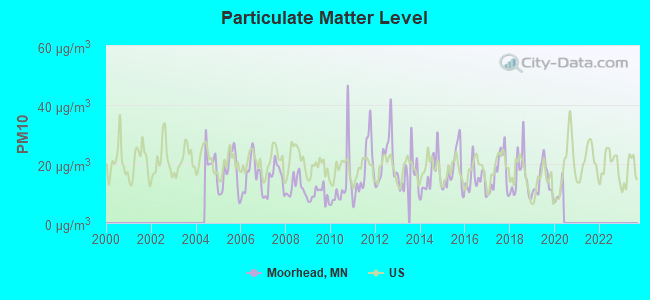
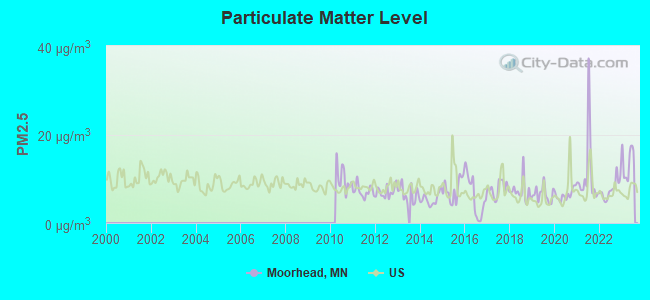

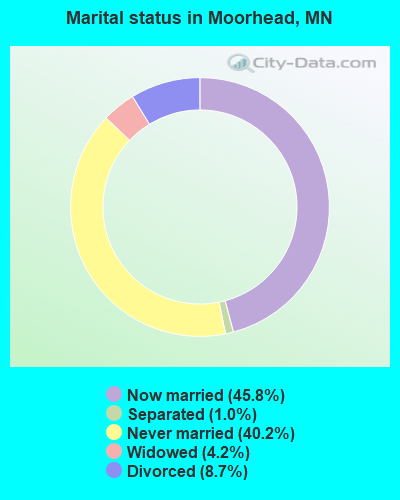
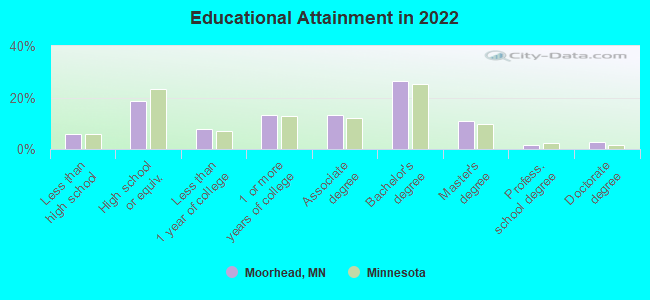
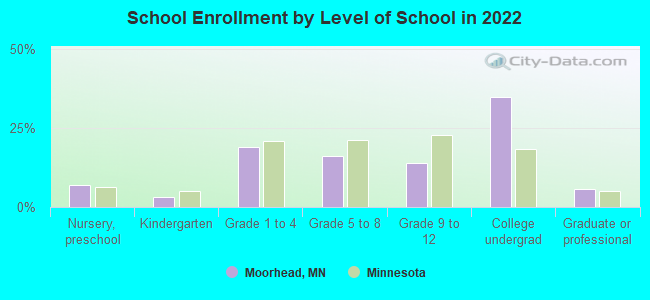
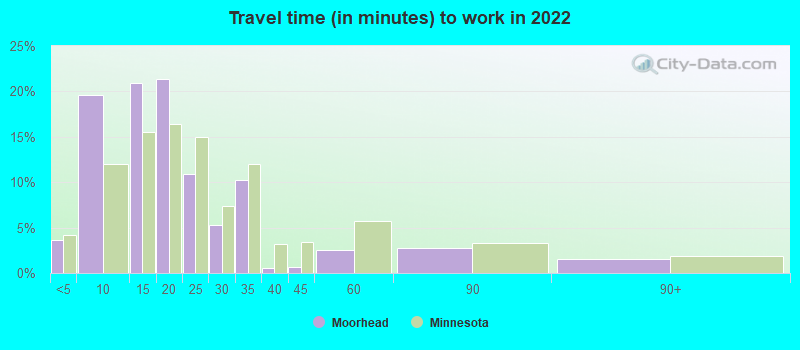
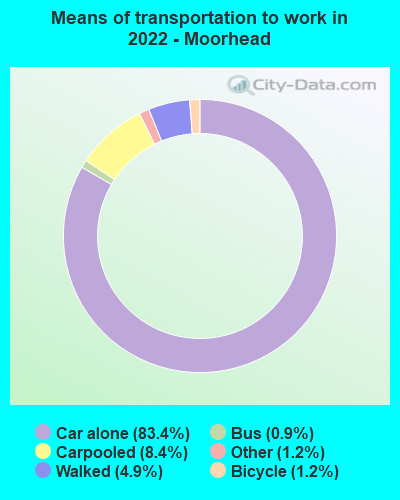
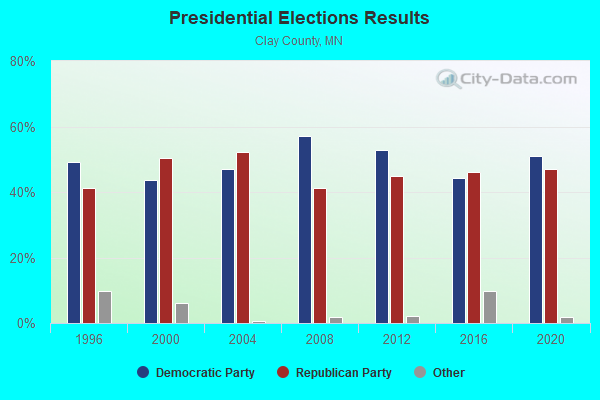
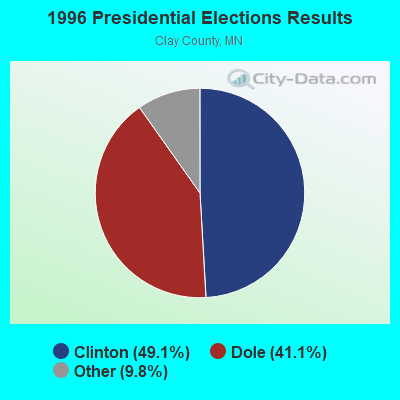
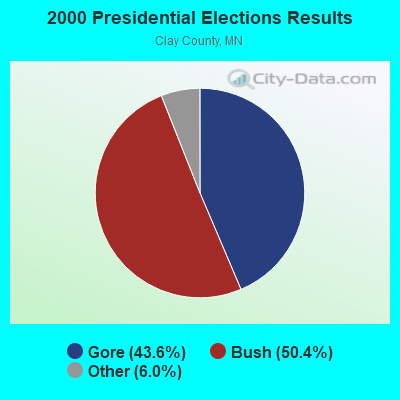
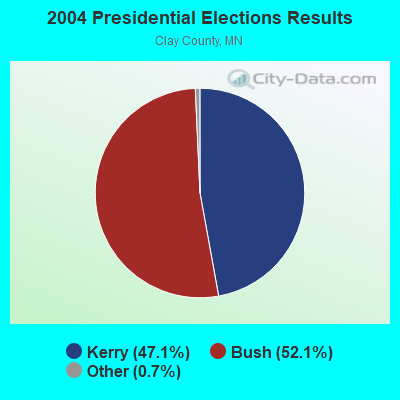
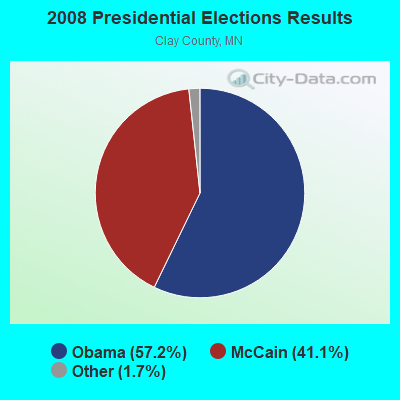
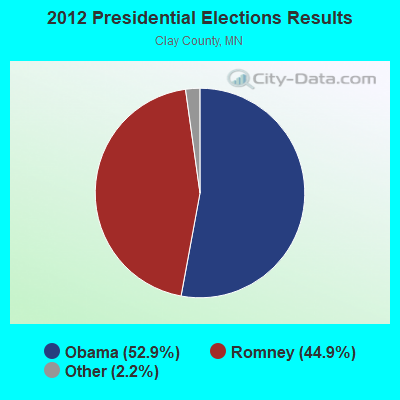
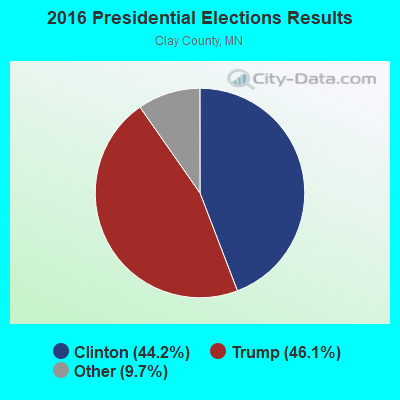
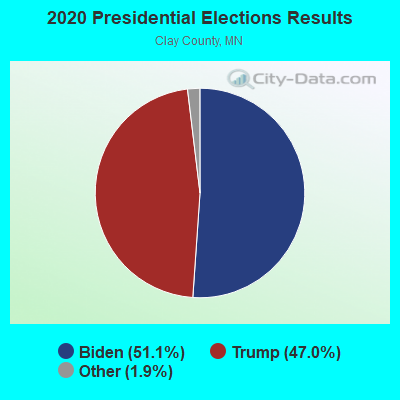

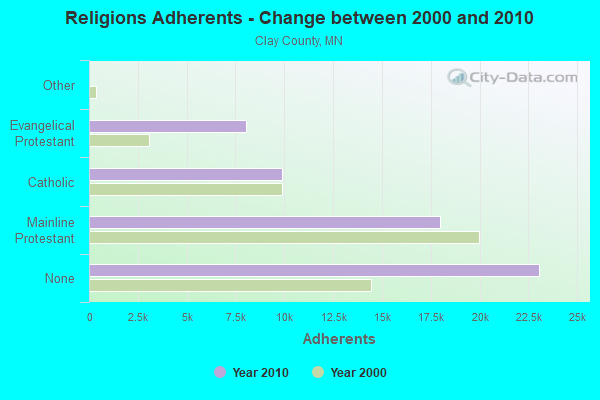
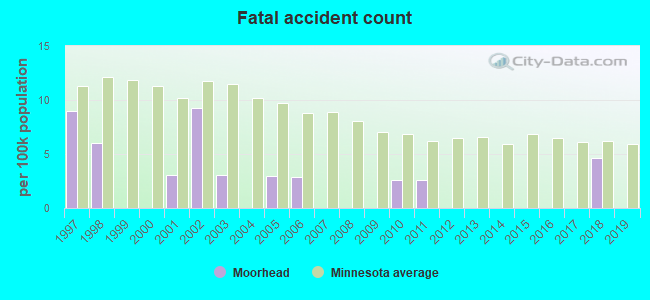
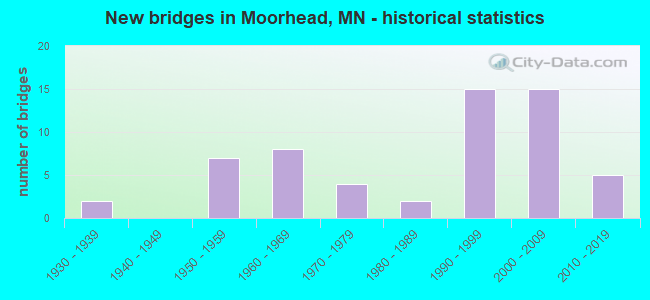
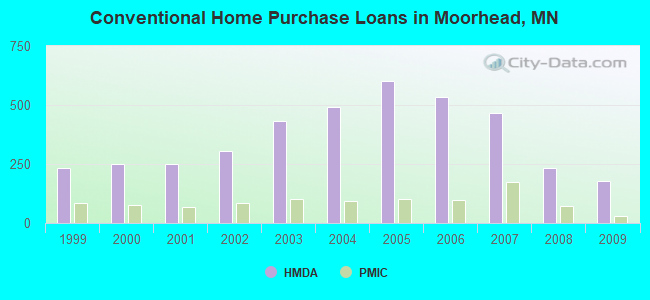
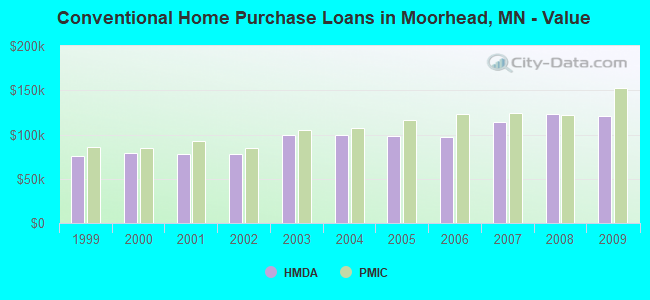
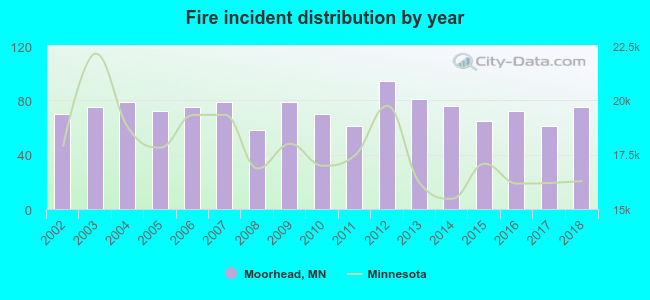 According to the data from the years 2002 - 2018 the average number of fire incidents per year is 73. The highest number of fires - 94 took place in 2012, and the least - 58 in 2008. The data has an increasing trend.
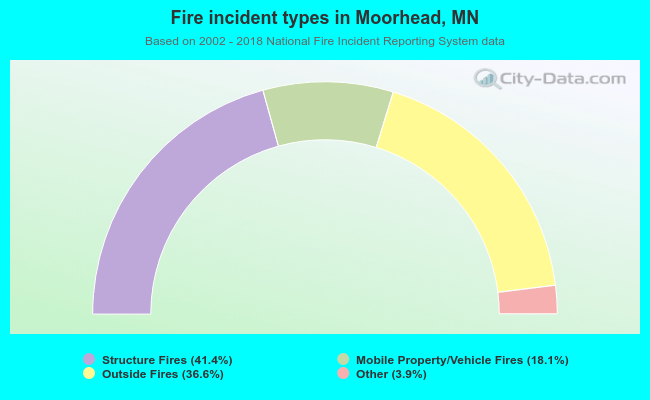 When looking into fire subcategories, the most incidents belonged to: Structure Fires (41.4%), and Outside Fires (36.6%).