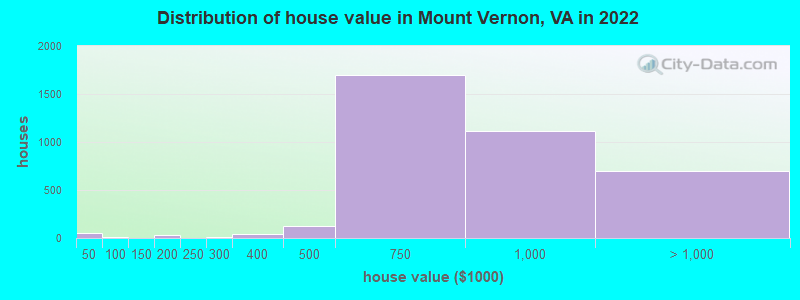
Estimated median house or condo value in 2022: $752,738 (it was $177,200 in 2000)
Mount Vernon:
$752,738
VA:
$365,700
Mean prices in 2022:all housing units: $923,461; detached houses: $995,575; townhouses or other attached units: $439,188; in 3-to-4-unit structures: $256,296; in 5-or-more-unit structures: $342,337; mobile homes: $50,840
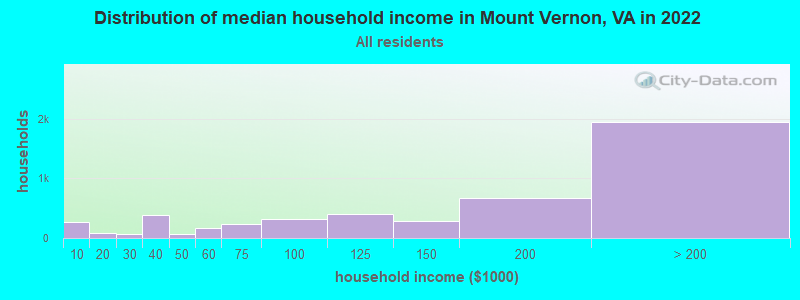
Median gross rent in 2022: $1,460.
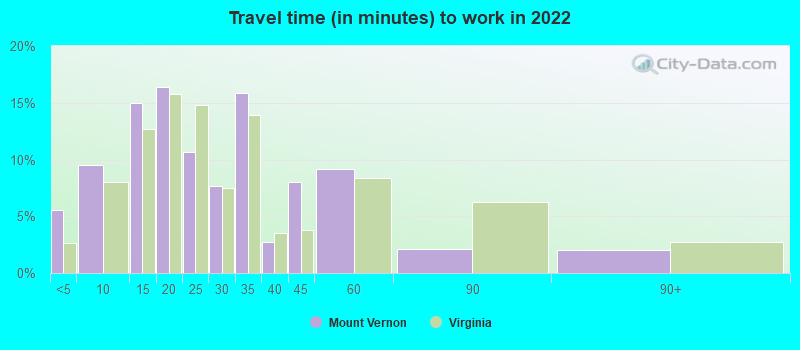
March 2022 cost of living index in Mount Vernon: 161.8 (very high, U.S. average is 100)
Percentage of residents living in poverty in 2022: 9.1%
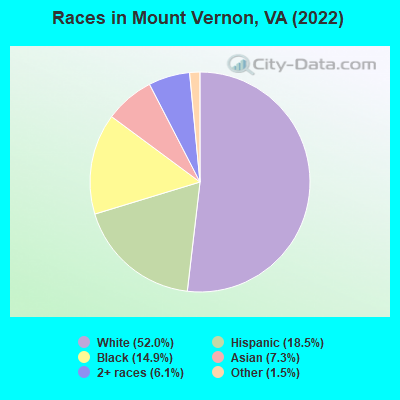
(9.0% for White Non-Hispanic residents, 10.6% for Black residents, 16.3% for Hispanic or Latino residents, 1.5% for other race residents, 2.4% for two or more races residents)
Ancestries: Irish (6.1%), Ghanaian (6.0%), European (4.8%), German (4.5%), Italian (4.2%), American (4.1%).
Current Local Time: EST time zone
Elevation: 115 feet
Land area: 7.61 square miles.
Population density: 1,632 people per square mile (low).
2,763 residents are foreign born (7.6% Latin America, 6.0% Africa, 4.8% Asia, 2.3% Europe).
This place:
20.9%
Virginia:
12.6%
Median real estate property taxes paid for housing units with mortgages in 2022: $7,234 (1.0%) Median real estate property taxes paid for housing units with no mortgage in 2022: $8,288 (1.0%)
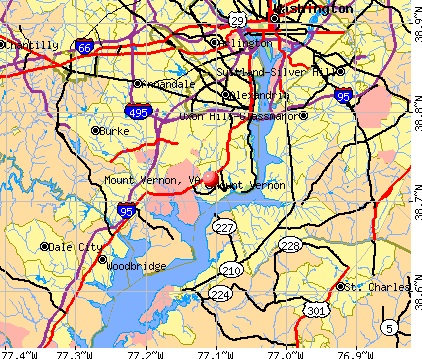
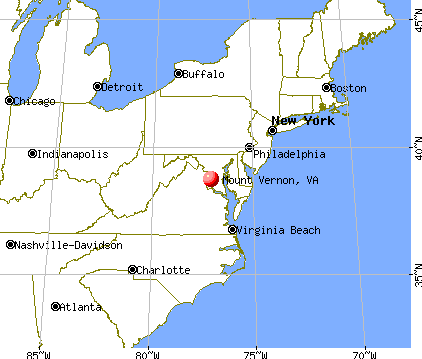
Nearest city with pop. 50,000+: Alexandria, VA (6.6 miles , pop. 128,283).
Nearest city with pop. 200,000+: Washington, DC (14.0 miles , pop. 572,059).
Nearest city with pop. 1,000,000+: Philadelphia, PA (137.0 miles , pop. 1,517,550).
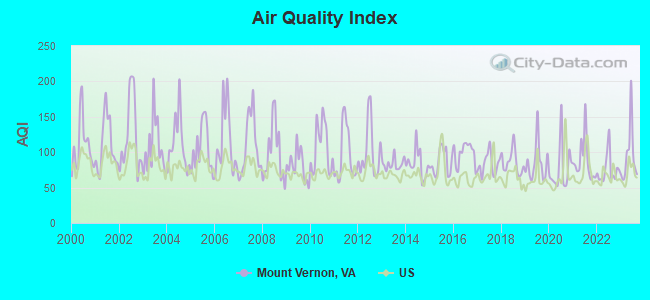
Air Quality Index (AQI) level in 2023 was 94.6. This is worse than average.
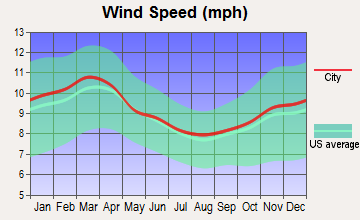
City:
94.6
U.S.:
72.6
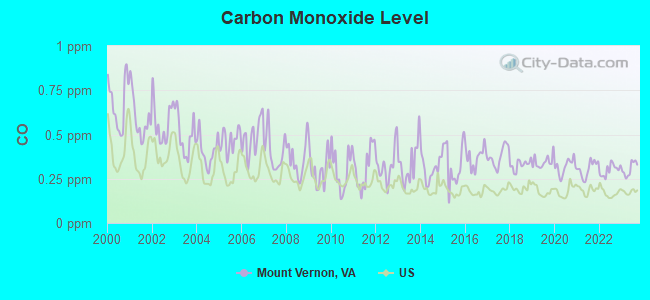
Carbon Monoxide (CO) [ppm] level in 2023 was 0.305. This is worse than average.Closest monitor was 0.6 miles away from the city center.
City:
0.305
U.S.:
0.251
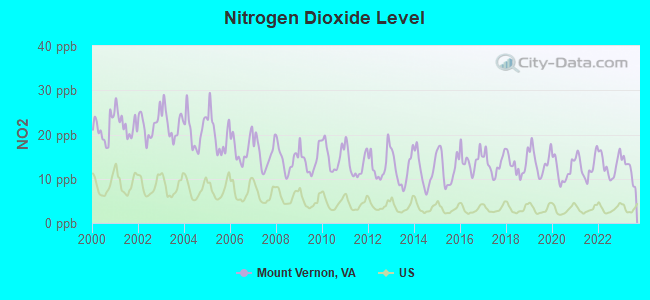
Nitrogen Dioxide (NO2) [ppb] level in 2023 was 12.1. This is significantly worse than average.Closest monitor was 0.6 miles away from the city center.
City:
12.1
U.S.:
5.1
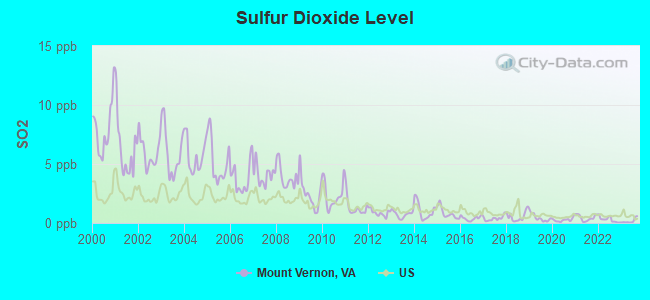
Sulfur Dioxide (SO2) [ppb] level in 2023 was 0.173. This is significantly better than average.Closest monitor was 0.6 miles away from the city center.
City:
0.173
U.S.:
1.515
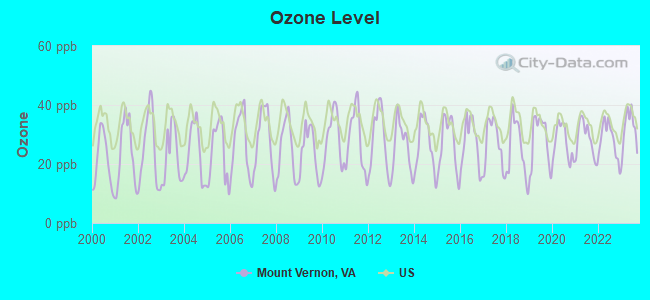
Ozone [ppb] level in 2023 was 32.0. This is about average.Closest monitor was 0.6 miles away from the city center.
City:
32.0
U.S.:
33.3
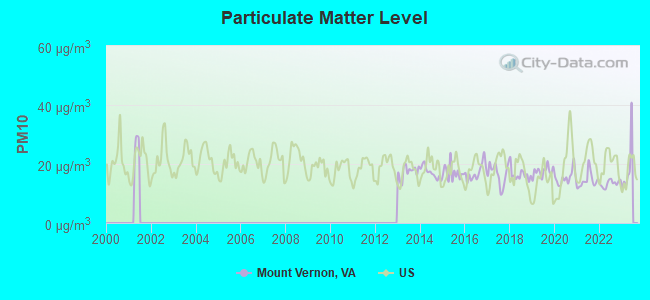
Particulate Matter (PM10) [µg/m3] level in 2022 was 13.4. This is significantly better than average.Closest monitor was 2.0 miles away from the city center.
City:
13.4
U.S.:
19.2
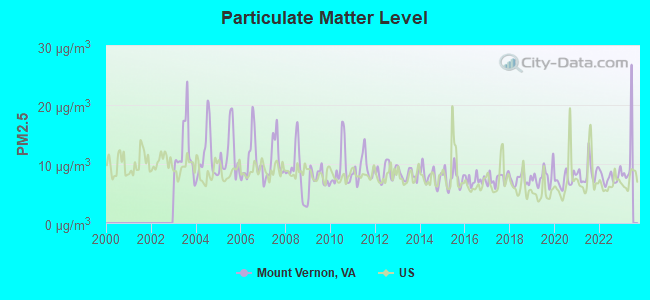
Particulate Matter (PM2.5) [µg/m3] level in 2022 was 7.72. This is about average.Closest monitor was 3.3 miles away from the city center.
City:
7.72
U.S.:
8.11
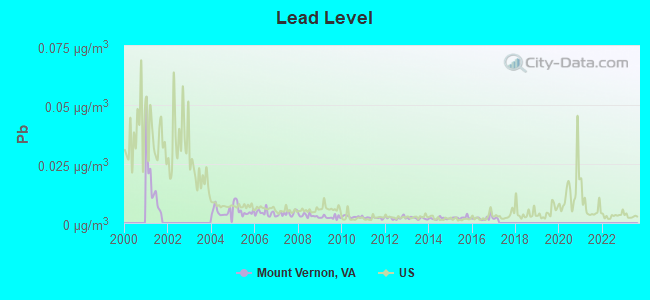
Lead (Pb) [µg/m3] level in 2016 was 0.00212. This is significantly better than average.Closest monitor was 2.0 miles away from the city center.
City:
0.00212
U.S.:
0.00931
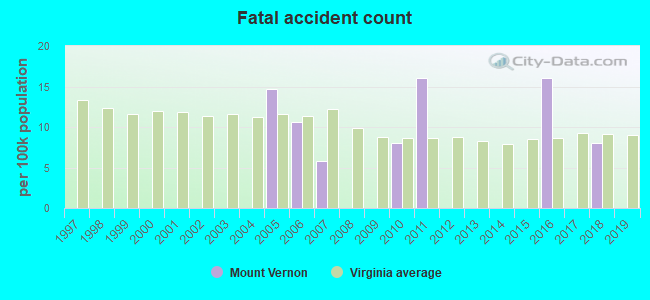
Tornado activity:
Mount Vernon-area historical tornado activity is above Virginia state average. It is 7% greater than the overall U.S. average.
On 4/28/2002, a category F4 (max. wind speeds 207-260 mph) tornado 12.7 miles away from the Mount Vernon place center killed 3 peopleand injured 122 peopleand caused $124 million in damages.
On 9/5/1979, a category F3 (max. wind speeds 158-206 mph) tornado 4.1 miles away from the place center killed one personand injured 6 peopleand causedbetween $500,000 and $5,000,000 in damages.
Earthquake activity:
Mount Vernon-area historical earthquake activity is significantly above Virginia state average. It is 56% smaller than the overall U.S. average.
On 8/23/2011 at 17:51:04, a magnitude 5.8 (5.8 MW, Depth: 3.7 mi, Class: Moderate, Intensity: VI - VII) earthquake occurred 72.2 miles away from the city center On 8/25/2011 at 05:07:52, a magnitude 4.5 (4.5 ML, Depth: 4.2 mi, Class: Light, Intensity: IV - V) earthquake occurred 71.2 miles away from the city center On 12/9/2003 at 20:59:18, a magnitude 4.5 (4.5 ML, Depth: 6.2 mi) earthquake occurred 85.1 miles away from the city center On 12/9/2003 at 20:59:14, a magnitude 4.5 (4.5 MB, 4.5 LG) earthquake occurred 89.8 miles away from Mount Vernon center On 1/16/1994 at 01:49:16, a magnitude 4.6 (4.6 MB, 4.6 LG, Depth: 3.1 mi) earthquake occurred 124.8 miles away from Mount Vernon center On 9/25/1998 at 19:52:52, a magnitude 5.2 (4.8 MB, 4.3 MS, 5.2 LG, 4.5 MW, Depth: 3.1 mi) earthquake occurred 258.5 miles away from the city center Magnitude types: regional Lg-wave magnitude (LG), body-wave magnitude (MB), local magnitude (ML), surface-wave magnitude (MS), moment magnitude (MW)
Natural disasters:
The number of natural disasters in Fairfax County (15) is near the US average (15). Major Disasters (Presidential) Declared: 12 Emergencies Declared: 3
Causes of natural disasters: Winter Storms: 5, Hurricanes: 4, Snowstorms: 3, Storms: 2, Tropical Storms: 2, Blizzard: 1, Flood: 1, Tornado: 1, Wind: 1, Other: 1 (Note: some incidents may be assigned to more than one category).
Hospitals and medical centers near Mount Vernon:
INOVA MOUNT VERNON HOSPITAL Acute Care Hospitals (about 3 miles away; ALEXANDRIA, VA)
MANORCARE HEALTH SERVICES-ALEXANDRIA (Nursing Home, about 3 miles away; ALEXANDRIA, VA)
1ST AMERICAN HOME HEALTH CARE SERVICES (Home Health Center, about 5 miles away; ALEXANDRIA, VA)
PEDIATRIC SERVICES OF AMERICA (Home Health Center, about 5 miles away; SPRINGFIELD, VA)
BELVOIR WOODS HEALTH CARE CENTER (Nursing Home, about 5 miles away; FORT BELVOIR, VA)
AMERICARE IN HOME NURSING (Home Health Center, about 6 miles away; SPRINGFIELD, VA)
DOMAIN MEDICAL HOME HEALTH AND STAFFING, INC (Home Health Center, about 6 miles away; ALEXANDRIA, VA)
Amtrak stations near Mount Vernon:
7 miles: ALEXANDRIA (110 CALLAHAN DR.) . Services: ticket office, partially wheelchair accessible, enclosed waiting area, public restrooms, public payphones, vending machines, ATM, free short-term parking, free long-term parking, call for car rental service, call for taxi service, public transit connection.
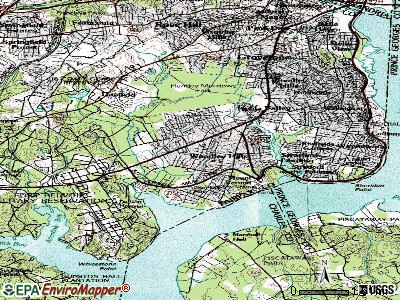
Notable locations in Mount Vernon: Woodlawn Plantation (A), Mount Vernon Yacht Club (B), Woodlawn Country Club (C), Engleside Office Park (D), Mount Vernon Country Club (E), Fairfax County Fire and Rescue Department Station 24 Woodlawn (F), Woodlawn Mansion (G), Pope-Leighey House (H), Fairfax County Fire Station Number 24, Woodlawn (I). Display/hide their locations on the map
Shopping Centers: Engleside Plaza Shopping Center (1), Sacramento Shopping Center (2), Woodlawn Shopping Center (3), Mount Vernon Shopping Center (4), Pear Tree Village Shopping Center (5). Display/hide their locations on the map
Churches in Mount Vernon include: Good Shepherd Catholic Church (A), Saint James Church (B), Bethel World Outreach Church (C), Ship of Zion Baptist Church (D), Emmanuel Church (E), Engleside Church (F), Epiphany Church (G), Wesley Church (H), Woodlawn Church (I). Display/hide their locations on the map
Parks in Mount Vernon include: Grist Mill Park (1), Mount Vernon Community Park (2), Mount Vernon Manor Park (3), Mount Vernon Woods Park (4), Mount Zephyr Park (5), Muddy Hole Farm Park (6), Vernon Heights Park (7), Washington Mill Park (8), Woodlawn Park (9). Display/hide their locations on the map
Fairfax County has a predicted average indoor radon screening level greater than 4 pCi/L (pico curies per liter) - Highest Potential
Average household size:
This place:
2.7 people
Virginia:
2.5 people
Percentage of family households:
This place:
76.3%
Whole state:
67.0%
Percentage of households with unmarried partners:
This place:
4.2%
Whole state:
5.7%
Likely homosexual households (counted as self-reported same-sex unmarried-partner households)
Lesbian couples: 0.5% of all households
Gay men: 0.4% of all households
2 people in nursing homes in 2000
2 people in other noninstitutional group quarters in 2000
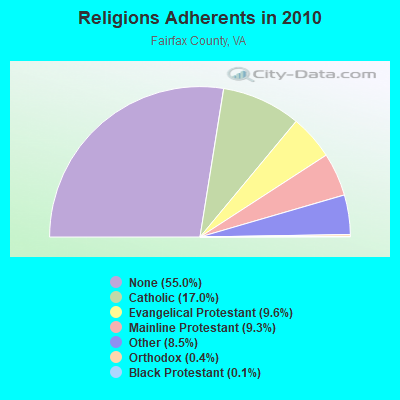
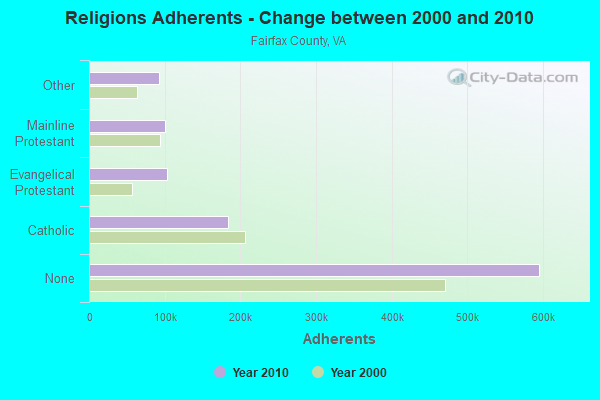
Religion statistics for Mount Vernon, VA (based on Fairfax County data)
Religion
Adherents
Congregations
Catholic
184,183
29
Evangelical Protestant
103,522
316
Mainline Protestant
100,525
146
Other
91,925
119
Orthodox
4,694
8
Black Protestant
1,509
9
None
595,368
-
Source: Clifford Grammich, Kirk Hadaway, Richard Houseal, Dale E.Jones, Alexei Krindatch, Richie Stanley and Richard H.Taylor. 2012. 2010 U.S.Religion Census: Religious Congregations & Membership Study. Association of Statisticians of American Religious Bodies. Jones, Dale E., et al. 2002. Congregations and Membership in the United States 2000. Nashville, TN: Glenmary Research Center. Graphs represent county-level data
Mount Vernon Wharf (Lat: 38.704278 Lon: -77.088583), Type: Building, Overall height: 11 m, Call Sign: WHH334, Assigned Frequencies: 156.450 MHz, 156.800 MHz, Grant Date: 03/24/2021, Expiration Date: 04/12/2031, Registrant: Mount Vernon Ladies Association, 3200 Mount Vernon Mem Hwy, Mount Vernon, VA 22121, Phone: (703) 799-8660, Email:
FCC Registered Amateur Radio Licenses:
3
Call Sign: KB4WTJ, Grant Date: 11/05/1996, Expiration Date: 11/05/2006, Cancellation Date: 11/06/2008, Registrant: Kathrine L Rockne Truxall, Box 357, Mount Vernon, VA 22121
Call Sign: WQ4L, Licensee ID: L00146593, Grant Date: 12/21/2017, Expiration Date: 01/15/2028, Certifier: John W Reiser, Registrant: John W Reiser, Mount Vernon, VA 22121-0329
Call Sign: KA4ROP, Previous Call Sign: KQ4EFQ, Licensee ID: L02598621, Grant Date: 12/03/2022, Expiration Date: 12/03/2032, Certifier: Justin Ropella, Registrant: Justin Ropella, Po Box 344, Mount Vernon, VA 22121
Home Mortgage Disclosure Act Aggregated Statistics For Year 2009 (Based on 6 full tracts)
A) FHA, FSA/RHS & VA Home Purchase Loans
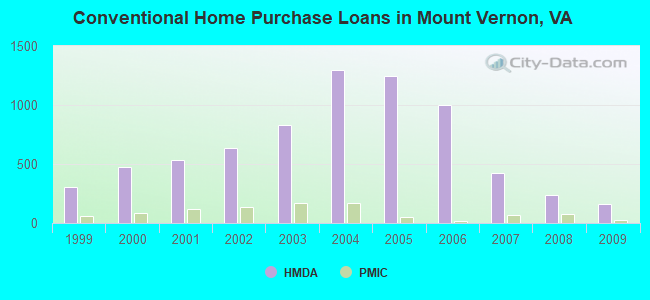
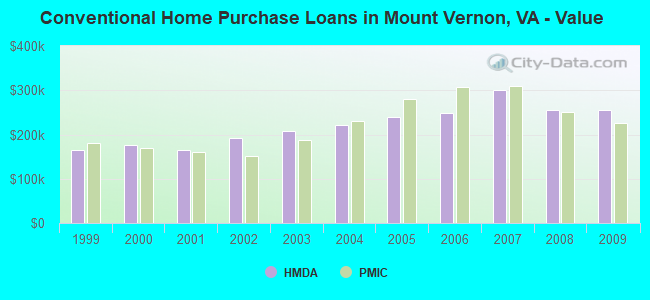
B) Conventional Home Purchase Loans
C) Refinancings
D) Home Improvement Loans
F) Non-occupant Loans on < 5 Family Dwellings (A B C & D)
G) Loans On Manufactured Home Dwelling (A B C & D)
Number
Average Value
Number
Average Value
Number
Average Value
Number
Average Value
Number
Average Value
Number
Average Value
LOANS ORIGINATED
331
$255,281
164
$256,390
658
$310,781
26
$204,385
76
$193,724
0
$0
APPLICATIONS APPROVED, NOT ACCEPTED
23
$241,217
12
$239,583
40
$295,975
4
$14,750
4
$174,000
0
$0
APPLICATIONS DENIED
46
$222,435
38
$155,526
215
$301,693
23
$122,609
34
$119,706
3
$100,667
APPLICATIONS WITHDRAWN
56
$191,500
40
$237,000
180
$312,900
4
$171,250
20
$176,700
0
$0
FILES CLOSED FOR INCOMPLETENESS
7
$123,714
11
$182,364
37
$273,784
0
$0
7
$97,429
0
$0
Aggregated Statistics For Year 2008 (Based on 6 full tracts)
A) FHA, FSA/RHS & VA Home Purchase Loans
B) Conventional Home Purchase Loans
C) Refinancings
D) Home Improvement Loans
F) Non-occupant Loans on < 5 Family Dwellings (A B C & D)
G) Loans On Manufactured Home Dwelling (A B C & D)
Number
Average Value
Number
Average Value
Number
Average Value
Number
Average Value
Number
Average Value
Number
Average Value
LOANS ORIGINATED
241
$267,672
239
$255,431
362
$286,273
55
$68,400
84
$182,655
2
$17,500
APPLICATIONS APPROVED, NOT ACCEPTED
21
$249,476
35
$246,143
98
$288,929
15
$67,933
13
$189,154
1
$64,000
APPLICATIONS DENIED
46
$221,543
69
$212,087
326
$288,374
38
$105,000
34
$260,441
9
$60,000
APPLICATIONS WITHDRAWN
36
$240,694
59
$262,169
196
$320,311
8
$60,000
21
$194,810
2
$153,000
FILES CLOSED FOR INCOMPLETENESS
7
$267,000
8
$212,625
32
$319,688
4
$73,250
2
$173,000
0
$0
Aggregated Statistics For Year 2007 (Based on 6 full tracts)
A) FHA, FSA/RHS & VA Home Purchase Loans
B) Conventional Home Purchase Loans
C) Refinancings
D) Home Improvement Loans
E) Loans on Dwellings For 5+ Families
F) Non-occupant Loans on < 5 Family Dwellings (A B C & D)
G) Loans On Manufactured Home Dwelling (A B C & D)
Number
Average Value
Number
Average Value
Number
Average Value
Number
Average Value
Number
Average Value
Number
Average Value
Number
Average Value
LOANS ORIGINATED
16
$262,938
426
$301,284
748
$261,235
109
$110,697
0
$0
99
$228,788
1
$47,000
APPLICATIONS APPROVED, NOT ACCEPTED
0
$0
32
$256,188
194
$268,412
27
$94,148
0
$0
11
$225,091
1
$2,000
APPLICATIONS DENIED
1
$204,000
105
$263,190
580
$291,093
78
$135,731
1
$103,000
74
$219,324
5
$119,200
APPLICATIONS WITHDRAWN
2
$291,500
49
$292,837
263
$282,859
9
$143,444
0
$0
27
$269,556
0
$0
FILES CLOSED FOR INCOMPLETENESS
1
$342,000
11
$386,727
80
$303,200
3
$193,333
0
$0
7
$255,000
0
$0
Aggregated Statistics For Year 2006 (Based on 6 full tracts)
A) FHA, FSA/RHS & VA Home Purchase Loans
B) Conventional Home Purchase Loans
C) Refinancings
D) Home Improvement Loans
E) Loans on Dwellings For 5+ Families
F) Non-occupant Loans on < 5 Family Dwellings (A B C & D)
G) Loans On Manufactured Home Dwelling (A B C & D)
Number
Average Value
Number
Average Value
Number
Average Value
Number
Average Value
Number
Average Value
Number
Average Value
Number
Average Value
LOANS ORIGINATED
9
$282,222
1,003
$248,466
1,201
$269,021
160
$139,362
0
$0
154
$240,974
0
$0
APPLICATIONS APPROVED, NOT ACCEPTED
1
$293,000
89
$236,899
209
$247,086
34
$147,735
0
$0
24
$219,292
1
$44,000
APPLICATIONS DENIED
2
$263,000
226
$209,358
486
$276,185
100
$187,650
1
$179,000
66
$194,364
3
$51,333
APPLICATIONS WITHDRAWN
0
$0
130
$232,908
357
$281,078
29
$194,069
0
$0
29
$191,586
0
$0
FILES CLOSED FOR INCOMPLETENESS
0
$0
40
$219,750
84
$310,071
6
$118,333
0
$0
6
$331,000
0
$0
Aggregated Statistics For Year 2005 (Based on 6 full tracts)
A) FHA, FSA/RHS & VA Home Purchase Loans
B) Conventional Home Purchase Loans
C) Refinancings
D) Home Improvement Loans
E) Loans on Dwellings For 5+ Families
F) Non-occupant Loans on < 5 Family Dwellings (A B C & D)
G) Loans On Manufactured Home Dwelling (A B C & D)
Number
Average Value
Number
Average Value
Number
Average Value
Number
Average Value
Number
Average Value
Number
Average Value
Number
Average Value
LOANS ORIGINATED
11
$210,273
1,250
$240,243
1,633
$242,721
150
$161,027
5
$571,800
255
$199,557
3
$29,667
APPLICATIONS APPROVED, NOT ACCEPTED
0
$0
127
$203,260
218
$211,596
28
$105,393
0
$0
23
$184,565
1
$80,000
APPLICATIONS DENIED
0
$0
235
$214,702
500
$235,428
78
$142,615
0
$0
62
$196,565
4
$151,250
APPLICATIONS WITHDRAWN
0
$0
115
$240,139
367
$233,281
49
$160,102
0
$0
41
$215,927
0
$0
FILES CLOSED FOR INCOMPLETENESS
0
$0
38
$226,816
78
$237,897
6
$79,500
0
$0
11
$187,636
0
$0
Aggregated Statistics For Year 2004 (Based on 6 full tracts)
A) FHA, FSA/RHS & VA Home Purchase Loans
B) Conventional Home Purchase Loans
C) Refinancings
D) Home Improvement Loans
E) Loans on Dwellings For 5+ Families
F) Non-occupant Loans on < 5 Family Dwellings (A B C & D)
G) Loans On Manufactured Home Dwelling (A B C & D)
Number
Average Value
Number
Average Value
Number
Average Value
Number
Average Value
Number
Average Value
Number
Average Value
Number
Average Value
LOANS ORIGINATED
85
$185,741
1,298
$220,665
1,354
$204,353
131
$99,649
2
$11,420,500
229
$181,144
7
$65,714
APPLICATIONS APPROVED, NOT ACCEPTED
2
$189,500
121
$209,240
180
$192,656
22
$74,455
0
$0
22
$165,182
3
$15,667
APPLICATIONS DENIED
6
$174,000
199
$214,879
411
$187,365
109
$87,651
0
$0
59
$138,797
4
$108,000
APPLICATIONS WITHDRAWN
9
$168,667
110
$182,364
341
$180,460
46
$132,848
0
$0
31
$110,968
0
$0
FILES CLOSED FOR INCOMPLETENESS
2
$173,500
37
$179,108
69
$190,348
10
$43,800
0
$0
10
$141,800
2
$67,500
Aggregated Statistics For Year 2003 (Based on 6 full tracts)
A) FHA, FSA/RHS & VA Home Purchase Loans
B) Conventional Home Purchase Loans
C) Refinancings
D) Home Improvement Loans
F) Non-occupant Loans on < 5 Family Dwellings (A B C & D)
Number
Average Value
Number
Average Value
Number
Average Value
Number
Average Value
Number
Average Value
LOANS ORIGINATED
138
$160,413
829
$206,890
2,519
$196,038
78
$40,564
216
$125,329
APPLICATIONS APPROVED, NOT ACCEPTED
7
$154,571
61
$159,525
295
$183,834
27
$29,630
24
$126,875
APPLICATIONS DENIED
6
$170,500
93
$167,882
490
$162,529
55
$40,255
36
$92,361
APPLICATIONS WITHDRAWN
11
$152,364
84
$186,095
290
$163,855
11
$60,182
16
$319,000
FILES CLOSED FOR INCOMPLETENESS
2
$155,000
17
$160,471
108
$200,296
2
$47,500
9
$114,667
Aggregated Statistics For Year 2002 (Based on 6 full tracts)
A) FHA, FSA/RHS & VA Home Purchase Loans
B) Conventional Home Purchase Loans
C) Refinancings
D) Home Improvement Loans
F) Non-occupant Loans on < 5 Family Dwellings (A B C & D)
Number
Average Value
Number
Average Value
Number
Average Value
Number
Average Value
Number
Average Value
LOANS ORIGINATED
238
$136,445
635
$191,279
1,589
$211,723
74
$34,919
122
$105,385
APPLICATIONS APPROVED, NOT ACCEPTED
4
$102,250
63
$160,714
175
$162,354
19
$32,053
12
$74,000
APPLICATIONS DENIED
10
$136,800
73
$137,973
333
$122,853
62
$28,081
27
$78,037
APPLICATIONS WITHDRAWN
11
$110,727
63
$212,349
249
$150,936
18
$31,333
21
$98,524
FILES CLOSED FOR INCOMPLETENESS
3
$91,333
10
$145,800
51
$165,510
2
$125,000
3
$72,000
Aggregated Statistics For Year 2001 (Based on 6 full tracts)
A) FHA, FSA/RHS & VA Home Purchase Loans
B) Conventional Home Purchase Loans
C) Refinancings
D) Home Improvement Loans
F) Non-occupant Loans on < 5 Family Dwellings (A B C & D)
Number
Average Value
Number
Average Value
Number
Average Value
Number
Average Value
Number
Average Value
LOANS ORIGINATED
237
$126,384
531
$164,765
1,003
$180,666
67
$31,507
68
$106,956
APPLICATIONS APPROVED, NOT ACCEPTED
7
$95,000
36
$140,333
95
$152,074
25
$36,880
8
$80,625
APPLICATIONS DENIED
18
$96,167
62
$107,484
270
$115,467
85
$19,953
21
$62,810
APPLICATIONS WITHDRAWN
13
$130,769
66
$152,530
195
$143,103
25
$18,480
13
$145,231
FILES CLOSED FOR INCOMPLETENESS
1
$92,000
9
$197,444
35
$142,343
6
$92,333
3
$77,667
Aggregated Statistics For Year 2000 (Based on 6 full tracts)
A) FHA, FSA/RHS & VA Home Purchase Loans
B) Conventional Home Purchase Loans
C) Refinancings
D) Home Improvement Loans
E) Loans on Dwellings For 5+ Families
F) Non-occupant Loans on < 5 Family Dwellings (A B C & D)
Number
Average Value
Number
Average Value
Number
Average Value
Number
Average Value
Number
Average Value
Number
Average Value
LOANS ORIGINATED
251
$116,590
473
$175,689
183
$146,907
76
$34,118
1
$3,900,000
19
$82,947
APPLICATIONS APPROVED, NOT ACCEPTED
8
$152,000
43
$168,628
34
$129,559
19
$25,421
0
$0
1
$45,000
APPLICATIONS DENIED
21
$102,905
62
$121,129
181
$85,950
64
$17,094
0
$0
12
$44,500
APPLICATIONS WITHDRAWN
18
$138,278
43
$163,651
90
$79,656
13
$40,462
0
$0
4
$52,750
FILES CLOSED FOR INCOMPLETENESS
4
$96,000
7
$103,857
9
$87,333
3
$35,000
0
$0
3
$84,000
Aggregated Statistics For Year 1999 (Based on 6 full tracts)
A) FHA, FSA/RHS & VA Home Purchase Loans
B) Conventional Home Purchase Loans
C) Refinancings
D) Home Improvement Loans
F) Non-occupant Loans on < 5 Family Dwellings (A B C & D)


 Recent articles from our blog. Our writers, many of them Ph.D. graduates or candidates, create easy-to-read articles on a wide variety of topics.

 (6.6 miles