Palisades Park, New Jersey
Submit your own pictures of this borough and show them to the world
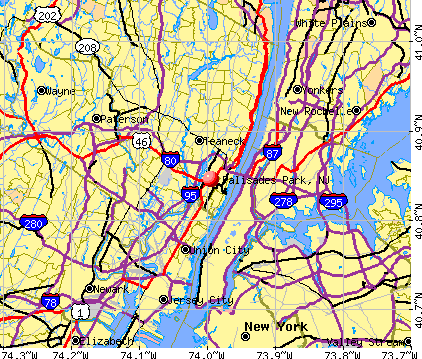
- OSM Map
- General Map
- Google Map
- MSN Map
Population change since 2000: +17.8%
 |
| Males: 9,358 | |
| Females: 10,748 |
| Median resident age: | 42.1 years |
| New Jersey median age: | 40.4 years |
Zip codes: 07650.
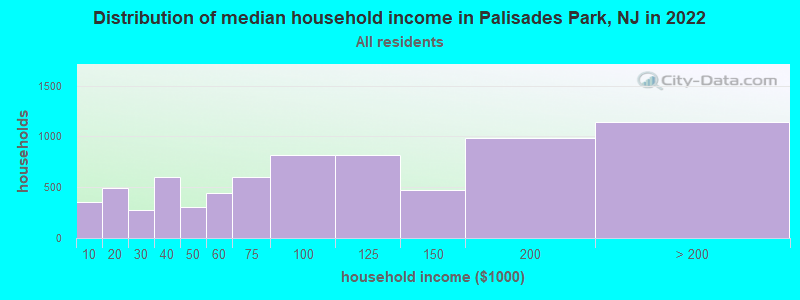
| Palisades Park: | $89,811 |
| NJ: | $96,346 |
Estimated per capita income in 2022: $41,074 (it was $22,607 in 2000)
Palisades Park borough income, earnings, and wages data
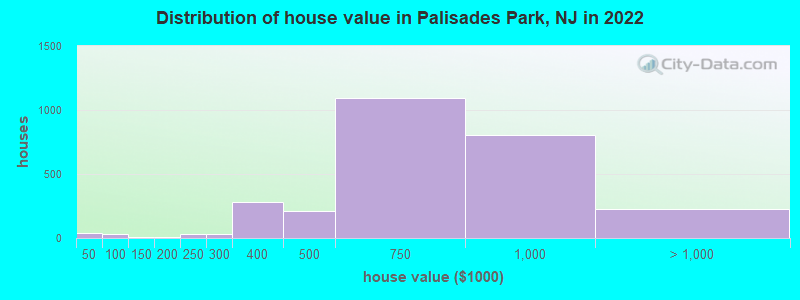
Estimated median house or condo value in 2022: $691,847 (it was $247,000 in 2000)
| Palisades Park: | $691,847 |
| NJ: | $428,900 |
Mean prices in 2022: all housing units: $711,570; detached houses: $598,507; townhouses or other attached units: $891,975; in 2-unit structures: $854,826; in 3-to-4-unit structures: over $1,000,000; in 5-or-more-unit structures: $361,312
Median gross rent in 2022: $1,866.
Palisades Park, NJ residents, houses, and apartments details
(19.5% for White Non-Hispanic residents, 2.0% for Black residents, 12.1% for Hispanic or Latino residents, 100.0% for American Indian residents, 10.6% for other race residents, 14.6% for two or more races residents)
Detailed information about poverty and poor residents in Palisades Park, NJ

Compare current foreclosures near Palisades Park, NJ:
| Photo | Address | Area | Beds / Baths | Price | Details |
|---|---|---|---|---|---|

|
#1
Morningside Ln
Palisades Park, NJ 07650
|
1,994 sq. feet
|
- baths - beds |
show details | |

|
#2
E Columbia Ave # B
Palisades Park, NJ 07650
|
- sq. feet
|
- baths - beds |
show details | |

|
#3
7th St
Palisades Park, NJ 07650
|
3,608 sq. feet
|
- baths - beds |
show details | |

|
#4
7th St Apt 2l
Palisades Park, NJ 07650
|
- sq. feet
|
- baths - beds |
show details | |

|
#5
2nd St Apt A
Palisades Park, NJ 07650
|
2,448 sq. feet
|
- baths - beds |
show details | |

|
#6
Highland Ave Apt G1
Palisades Park, NJ 07650
|
- sq. feet
|
- baths - beds |
show details | |

|
#7
Morningside Ln Apt B
Palisades Park, NJ 07650
|
- sq. feet
|
- baths - beds |
show details | |

|
#8
Commercial Ave
Palisades Park, NJ 07650
|
- sq. feet
|
- baths - beds |
show details | |

|
#9
Edsall Blv A
Palisades Park, NJ 07650
|
- sq. feet
|
- baths - beds |
show details | |

|
#10
3rd St # A
Palisades Park, NJ 07650
|
1,529 sq. feet
|
- baths - beds |
show details |
| Photo | Address | Area | Beds / Baths | Price | Details |
|---|---|---|---|---|---|

|
#11
Borough Ln
Palisades Park, NJ 07650
|
3,132 sq. feet
|
- baths - beds |
show details | |

|
#12
Grand Ave, Apt 1
Palisades Park, NJ 07650
|
- sq. feet
|
- baths - beds |
show details | |

|
#13
Edsall Blvd
Palisades Park, NJ 07650
|
- sq. feet
|
- baths - beds |
show details | |

|
#14
E Ruby Ave Apt B1
Palisades Park, NJ 07650
|
- sq. feet
|
- baths - beds |
show details | |

|
#15
Glen Ave
Palisades Park, NJ 07650
|
- sq. feet
|
- baths - beds |
show details | |

|
#16
1st St
Palisades Park, NJ 07650
|
3,580 sq. feet
|
- baths - beds |
show details | |

|
#17
E Edsall Blvd # A
Palisades Park, NJ 07650
|
- sq. feet
|
- baths - beds |
show details | |

|
#18
W Edsall Blvd Apt 137a
Palisades Park, NJ 07650
|
- sq. feet
|
- baths - beds |
show details | |

|
#19
7th St
Palisades Park, NJ 07650
|
- sq. feet
|
- baths - beds |
show details | |

|
#20
E Edsall Ave Apt D2
Palisades Park, NJ 07650
|
- sq. feet
|
- baths - beds |
show details |
| Photo | Address | Area | Beds / Baths | Price | Details |
|---|---|---|---|---|---|

|
#21
Bergen Blvd Apt 10a
Palisades Park, NJ 07650
|
- sq. feet
|
- baths - beds |
show details | |

|
#22
9th St # A
Palisades Park, NJ 07650
|
1,860 sq. feet
|
- baths - beds |
show details | |

|
#23
Momingaide L B
Palisades Park, NJ 07650
|
- sq. feet
|
- baths - beds |
show details | |

|
#24
Route 5
Palisades Park, NJ 07650
|
- sq. feet
|
- baths - beds |
show details | |

|
#25
Roff Ave
Palisades Park, NJ 07650
|
- sq. feet
|
- baths - beds |
show details | |

|
#26
10th St Apt 1
Palisades Park, NJ 07650
|
2,090 sq. feet
|
- baths - beds |
show details | |

|
#27
1st St
Palisades Park, NJ 07650
|
- sq. feet
|
- baths - beds |
show details | |

|
#28
W Sidney Ave
Mount Vernon, NY 10550
|
2,800 sq. feet
|
3 baths 8 beds |
$454,900
|
show details |

|
#29
Jersey Ave
Fairview, NJ 07022
|
1,073 sq. feet
|
1 baths 3 beds |
$414,900
|
show details |

|
#30
Willow St
Bloomfield, NJ 07003
|
1,092 sq. feet
|
1 baths 3 beds |
$499,900
|
show details |
| Photo | Address | Area | Beds / Baths | Price | Details |
|---|---|---|---|---|---|

|
#31
Ashland Ave
East Orange, NJ 07017
|
2,254 sq. feet
|
1 baths 5 beds |
$272,000
|
show details |

|
#32
Swinton Ave
Bronx, NY 10465
|
1,938 sq. feet
|
2 baths 3 beds |
$789,900
|
show details |

|
#33
Midland Ave Apt 4h
Bronxville, NY 10708
|
900 sq. feet
|
1 baths 1 beds |
$184,000
|
show details |

|
#34
Forest Ave
Paramus, NJ 07652
|
2,428 sq. feet
|
3 baths 5 beds |
$749,900
|
show details |

|
#35
Horizon Rd Apt 803
Fort Lee, NJ 07024
|
843 sq. feet
|
1 baths 1 beds |
$178,900
|
show details |

|
#36
177th St
Jamaica, NY 11433
|
1,156 sq. feet
|
1 baths 3 beds |
$450,000
|
show details |

|
#37
N Broadway
Irvington, NY 10533
|
850 sq. feet
|
1 baths 2 beds |
$315,000
|
show details |

|
#38
Central Park Ave Apt 9m
Yonkers, NY 10710
|
1,300 sq. feet
|
2 baths 3 beds |
$319,900
|
show details |

|
#39
96th St
Ozone Park, NY 11417
|
1,520 sq. feet
|
2 baths 3 beds |
$709,900
|
show details |

|
#40
Davenport Ave Apt 1b
New Rochelle, NY 10805
|
750 sq. feet
|
1 baths 1 beds |
$159,900
|
show details |
| Photo | Address | Area | Beds / Baths | Price | Details |
|---|---|---|---|---|---|

|
#41
Park Ave Apt 12
North Bergen, NJ 07047
|
835 sq. feet
|
1 baths 2 beds |
$379,900
|
show details |

|
#42
Fordham Hill Oval Apt 12d
Bronx, NY 10468
|
850 sq. feet
|
1 baths 1 beds |
$179,900
|
show details |

|
#43
S Orange Ave
Newark, NJ 07103
|
989 sq. feet
|
1 baths 2 beds |
$289,900
|
show details |

|
#44
17th Ave 1st Floor
Whitestone, NY 11357
|
610 sq. feet
|
1 baths 1 beds |
$229,900
|
show details |

|
#45
E 221st St
Bronx, NY 10467
|
1,890 sq. feet
|
2 baths 3 beds |
$554,900
|
show details |

|
#46
E 52nd St Apt 4f
New York, NY 10022
|
700 sq. feet
|
1 baths 1 beds |
$689,900
|
show details |

|
#47
90th St Apt 5d
Jackson Heights, NY 11372
|
1,000 sq. feet
|
1 baths 2 beds |
$269,900
|
show details |

|
#48
Fordham Hill Oval
Bronx, NY 10468
|
700 sq. feet
|
1 baths 1 beds |
$154,900
|
show details |

|
#49
2nd Ave # 5c
New York, NY 10029
|
550 sq. feet
|
1 baths 1 beds |
$429,900
|
show details |

|
Check over 1 million property listings on Foreclosure.com!
|
browse all offers | |||


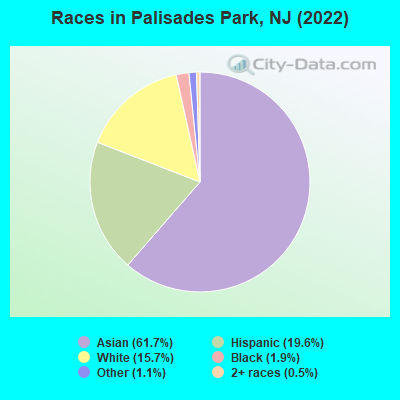
- 12,47361.7%Asian alone
- 3,96819.6%Hispanic
- 3,17815.7%White alone
- 3811.9%Black alone
- 2171.1%Other race alone
- 950.5%Two or more races
- 140.07%American Indian alone
Races in Palisades Park detailed stats: ancestries, foreign born residents, place of birth
According to our research of New Jersey and other state lists, there was 1 registered sex offender living in Palisades Park, New Jersey as of May 19, 2024.
The ratio of all residents to sex offenders in Palisades Park is 20,693 to 1.
The ratio of registered sex offenders to all residents in this city is much lower than the state average.
Type |
2009 |
2010 |
2011 |
2012 |
2013 |
2014 |
2015 |
2016 |
2017 |
2018 |
2019 |
2020 |
2021 |
2022 |
|---|---|---|---|---|---|---|---|---|---|---|---|---|---|---|
| Murders (per 100,000) | 0 (0.0) | 2 (10.2) | 0 (0.0) | 0 (0.0) | 0 (0.0) | 0 (0.0) | 0 (0.0) | 0 (0.0) | 0 (0.0) | 0 (0.0) | 0 (0.0) | 0 (0.0) | 1 (4.6) | 0 (0.0) |
| Rapes (per 100,000) | 0 (0.0) | 0 (0.0) | 0 (0.0) | 1 (5.0) | 0 (0.0) | 0 (0.0) | 1 (4.8) | 0 (0.0) | 0 (0.0) | 1 (4.8) | 1 (4.8) | 1 (4.8) | 2 (9.1) | 1 (5.0) |
| Robberies (per 100,000) | 10 (50.9) | 3 (15.3) | 7 (35.6) | 8 (40.3) | 7 (34.9) | 4 (19.5) | 5 (24.2) | 8 (38.3) | 6 (28.5) | 10 (47.9) | 4 (19.2) | 1 (4.8) | 2 (9.1) | 2 (10.0) |
| Assaults (per 100,000) | 10 (50.9) | 19 (96.8) | 15 (76.2) | 10 (50.4) | 12 (59.8) | 10 (48.8) | 15 (72.7) | 10 (47.9) | 9 (42.8) | 6 (28.7) | 11 (52.7) | 5 (24.0) | 6 (27.3) | 11 (55.0) |
| Burglaries (per 100,000) | 30 (152.8) | 42 (214.0) | 78 (396.2) | 44 (221.7) | 34 (169.5) | 38 (185.5) | 32 (155.0) | 28 (134.2) | 30 (142.7) | 34 (162.8) | 19 (91.0) | 23 (110.5) | 9 (41.0) | 33 (165.1) |
| Thefts (per 100,000) | 130 (661.9) | 83 (423.0) | 104 (528.3) | 95 (478.6) | 78 (388.8) | 69 (336.9) | 55 (266.4) | 74 (354.7) | 88 (418.4) | 80 (383.0) | 81 (388.0) | 65 (312.2) | 57 (259.5) | 101 (505.2) |
| Auto thefts (per 100,000) | 10 (50.9) | 2 (10.2) | 6 (30.5) | 11 (55.4) | 8 (39.9) | 2 (9.8) | 3 (14.5) | 11 (52.7) | 8 (38.0) | 16 (76.6) | 6 (28.7) | 17 (81.7) | 7 (31.9) | 12 (60.0) |
| Arson (per 100,000) | 0 (0.0) | 2 (10.2) | 0 (0.0) | 4 (20.2) | 1 (5.0) | 1 (4.9) | 0 (0.0) | 0 (0.0) | 0 (0.0) | 0 (0.0) | 0 (0.0) | 0 (0.0) | 0 (0.0) | 0 (0.0) |
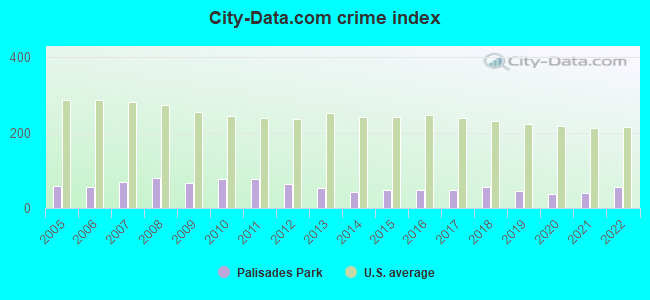
| City-Data.com crime index | 66.7 | 77.1 | 77.2 | 65.3 | 53.0 | 42.9 | 48.3 | 48.9 | 46.9 | 56.8 | 44.3 | 36.8 | 40.4 | 54.6 |
The City-Data.com crime index weighs serious crimes and violent crimes more heavily. Higher means more crime, U.S. average is 246.1. It adjusts for the number of visitors and daily workers commuting into cities.
Crime rate in Palisades Park detailed stats: murders, rapes, robberies, assaults, burglaries, thefts, arson
Full-time law enforcement employees in 2021, including police officers: 41 (40 officers - 38 male; 2 female).
| Officers per 1,000 residents here: | 1.82 |
| New Jersey average: | 5.53 |
 Recent articles from our blog. Our writers, many of them Ph.D. graduates or candidates, create easy-to-read articles on a wide variety of topics.

 | Korean Community Palisades Park Area? (7 replies) |
| Mother of Palisades Park Mayor James Rotundo Post Racist Rant On FB (95 replies) |
| It's been 9 months. Where is NJ Recreational Marijuana? (245 replies) |
| Is this an accurate map of New Jersey? (44 replies) |
| Fort Lee vs Leonia: commute and schools (5 replies) |
| Where to live (and demographic questions..) (17 replies) |
Latest news from Palisades Park, NJ collected exclusively by city-data.com from local newspapers, TV, and radio stations
Ancestries: Italian (2.4%), American (1.5%).
Current Local Time: EST time zone
Elevation: 100 feet
Land area: 1.21 square miles.
Population density: 16,619 people per square mile (very high).
12,482 residents are foreign born (46.2% Asia, 10.9% Latin America).
| This borough: | 61.7% |
| New Jersey: | 23.2% |
Median real estate property taxes paid for housing units with mortgages in 2022: $10,001 (1.5%)
Median real estate property taxes paid for housing units with no mortgage in 2022: $10,001 (1.4%)
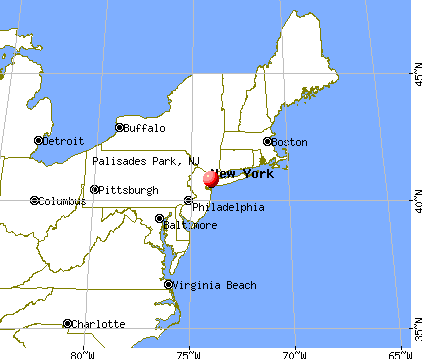
Nearest city with pop. 50,000+: Manhattan, NY  (5.4 miles , pop. 1,537,195).
Nearest cities:
), ), ), ), Latitude: 40.85 N, Longitude: 73.99 W
Daytime population change due to commuting: -6,691 (-33.1%)
Workers who live and work in this borough: 2,475 (21.9%)
Area code commonly used in this area: 201

| Here: | 3.8% |
| New Jersey: | 4.5% |
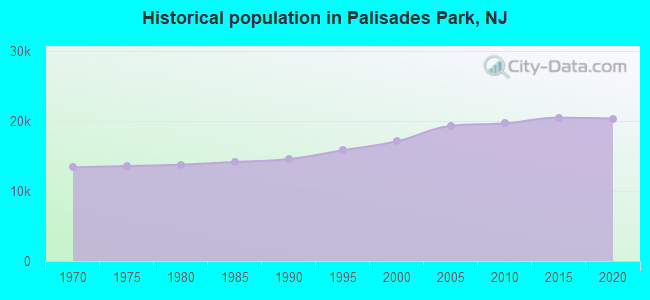
Population change in the 1990s: +2,533 (+17.4%).
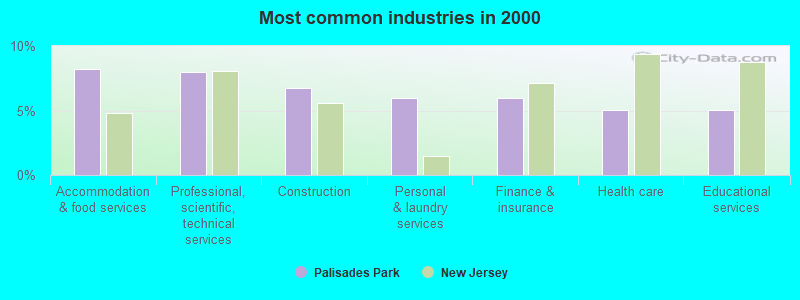
- Accommodation & food services (8.2%)
- Professional, scientific, technical services (7.9%)
- Construction (6.7%)
- Personal & laundry services (6.0%)
- Finance & insurance (6.0%)
- Health care (5.1%)
- Educational services (5.0%)
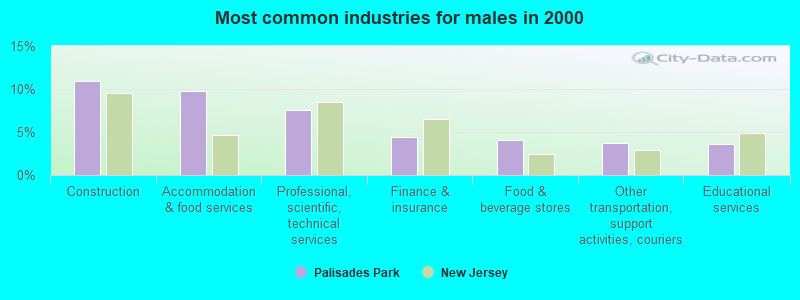
- Construction (11.0%)
- Accommodation & food services (9.7%)
- Professional, scientific, technical services (7.5%)
- Finance & insurance (4.4%)
- Food & beverage stores (4.1%)
- Other transportation, support activities, couriers (3.8%)
- Educational services (3.6%)
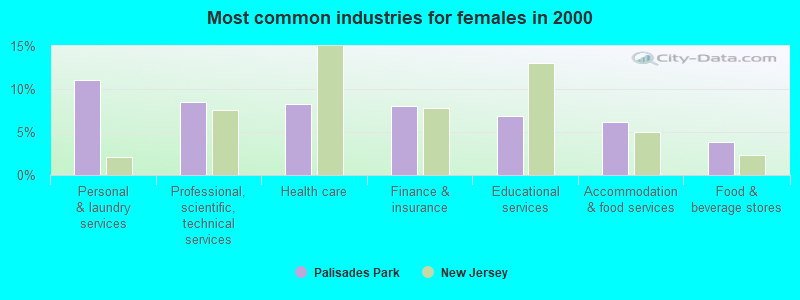
- Personal & laundry services (11.0%)
- Professional, scientific, technical services (8.5%)
- Health care (8.3%)
- Finance & insurance (8.1%)
- Educational services (6.9%)
- Accommodation & food services (6.1%)
- Food & beverage stores (3.9%)
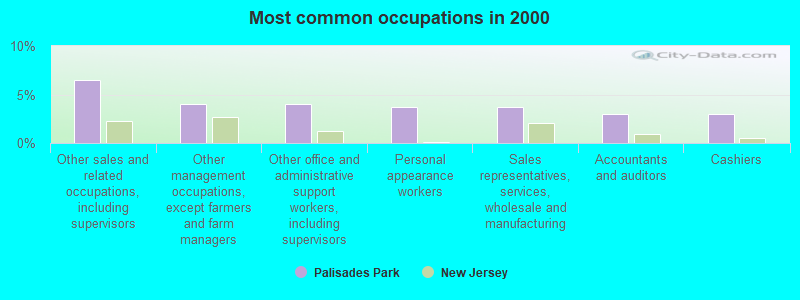
- Other sales and related occupations, including supervisors (6.5%)
- Other management occupations, except farmers and farm managers (4.1%)
- Other office and administrative support workers, including supervisors (4.0%)
- Personal appearance workers (3.7%)
- Sales representatives, services, wholesale and manufacturing (3.7%)
- Accountants and auditors (3.0%)
- Cashiers (3.0%)
- Other sales and related occupations, including supervisors (7.8%)
- Other management occupations, except farmers and farm managers (5.3%)
- Driver/sales workers and truck drivers (4.9%)
- Sales representatives, services, wholesale and manufacturing (4.4%)
- Computer specialists (4.0%)
- Construction laborers (3.7%)
- Top executives (3.5%)
- Personal appearance workers (8.1%)
- Other office and administrative support workers, including supervisors (7.7%)
- Secretaries and administrative assistants (5.7%)
- Other sales and related occupations, including supervisors (4.8%)
- Cashiers (4.3%)
- Accountants and auditors (3.9%)
- Information and record clerks, except customer service representatives (3.5%)
Average climate in Palisades Park, New Jersey
Based on data reported by over 4,000 weather stations


|
|


(lower is better)
Air Quality Index (AQI) level in 2023 was 113. This is significantly worse than average.
| City: | 113 |
| U.S.: | 73 |
Carbon Monoxide (CO) [ppm] level in 2023 was 0.314. This is worse than average. Closest monitor was 1.6 miles away from the city center.
| City: | 0.314 |
| U.S.: | 0.251 |
Nitrogen Dioxide (NO2) [ppb] level in 2023 was 15.7. This is significantly worse than average. Closest monitor was 1.6 miles away from the city center.
| City: | 15.7 |
| U.S.: | 5.1 |
Sulfur Dioxide (SO2) [ppb] level in 2023 was 0.397. This is significantly better than average. Closest monitor was 2.6 miles away from the city center.
| City: | 0.397 |
| U.S.: | 1.515 |
Ozone [ppb] level in 2023 was 29.0. This is about average. Closest monitor was 1.7 miles away from the city center.
| City: | 29.0 |
| U.S.: | 33.3 |
Particulate Matter (PM10) [µg/m3] level in 2003 was 26.9. This is worse than average. Closest monitor was 1.2 miles away from the city center.
| City: | 26.9 |
| U.S.: | 19.2 |
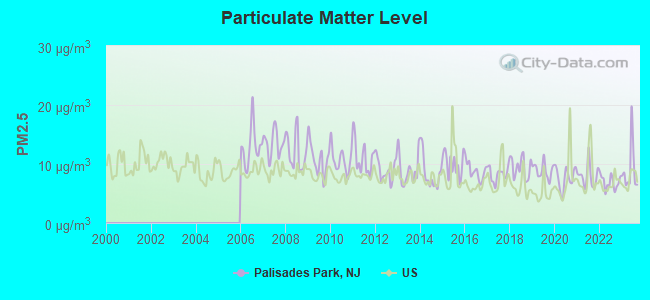
Particulate Matter (PM2.5) [µg/m3] level in 2023 was 9.02. This is about average. Closest monitor was 1.2 miles away from the city center.
| City: | 9.02 |
| U.S.: | 8.11 |
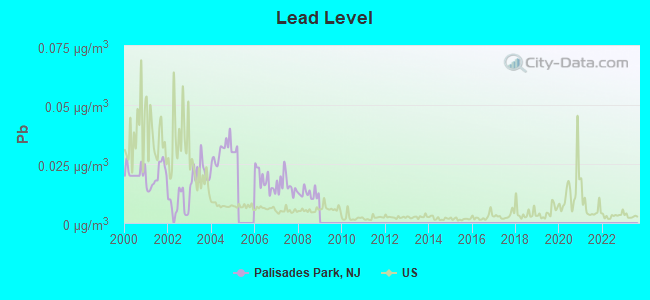
Lead (Pb) [µg/m3] level in 2008 was 0.0125. This is worse than average. Closest monitor was 4.3 miles away from the city center.
| City: | 0.0125 |
| U.S.: | 0.0093 |
Tornado activity:
Palisades Park-area historical tornado activity is slightly below New Jersey state average. It is 39% smaller than the overall U.S. average.
On 5/28/1973, a category F3 (max. wind speeds 158-206 mph) tornado 26.6 miles away from the Palisades Park borough center caused between $50,000 and $500,000 in damages.
On 7/15/1970, a category F2 (max. wind speeds 113-157 mph) tornado 6.5 miles away from the borough center caused between $5000 and $50,000 in damages.
Earthquake activity:
Palisades Park-area historical earthquake activity is significantly above New Jersey state average. It is 69% smaller than the overall U.S. average.On 8/23/2011 at 17:51:04, a magnitude 5.8 (5.8 MW, Depth: 3.7 mi, Class: Moderate, Intensity: VI - VII) earthquake occurred 292.6 miles away from the city center
On 10/7/1983 at 10:18:46, a magnitude 5.3 (5.1 MB, 5.3 LG, 5.1 ML) earthquake occurred 215.7 miles away from Palisades Park center
On 1/16/1994 at 01:49:16, a magnitude 4.6 (4.6 MB, 4.6 LG, Depth: 3.1 mi, Class: Light, Intensity: IV - V) earthquake occurred 113.0 miles away from Palisades Park center
On 4/20/2002 at 10:50:47, a magnitude 5.3 (5.3 ML, Depth: 3.0 mi) earthquake occurred 254.1 miles away from Palisades Park center
On 4/20/2002 at 10:50:47, a magnitude 5.2 (5.2 MB, 4.2 MS, 5.2 MW, 5.0 MW) earthquake occurred 252.2 miles away from Palisades Park center
On 1/16/1994 at 00:42:43, a magnitude 4.2 (4.2 MB, 4.0 LG, Depth: 3.1 mi) earthquake occurred 111.6 miles away from Palisades Park center
Magnitude types: regional Lg-wave magnitude (LG), body-wave magnitude (MB), local magnitude (ML), surface-wave magnitude (MS), moment magnitude (MW)
Natural disasters:
The number of natural disasters in Bergen County (29) is a lot greater than the US average (15).Major Disasters (Presidential) Declared: 18
Emergencies Declared: 10
Causes of natural disasters: Floods: 7, Hurricanes: 7, Storms: 6, Heavy Rains: 4, Snowstorms: 4, Winter Storms: 3, Blizzards: 2, Water Shortages: 2, Power Outage: 1, Tornado: 1, Tropical Storm: 1, Wind: 1, Other: 3 (Note: some incidents may be assigned to more than one category).

Hospitals and medical centers near Palisades Park:
- HOSPICE OF NEW YORK, LLC (Hospital, about 2 miles away; LONG ISLAND CITY, NY)
- FMC FAIRVIEW (Dialysis Facility, about 2 miles away; FAIRVIEW, NJ)
- CARITAS HEALTH CARE, INC (Hospital, about 3 miles away; ELMHURST, NY)
- CARE ONE AT TEANECK (Nursing Home, about 3 miles away; TEANECK, NJ)
- HOLY NAME HOME CARE (Home Health Center, about 3 miles away; TEANECK, NJ)
- HOLY NAME MEDICAL CENTER Acute Care Hospitals (about 3 miles away; TEANECK, NJ)
- INGLEMOOR CENTER (Nursing Home, about 3 miles away; ENGLEWOOD, NJ)
Amtrak stations near Palisades Park:
- 7 miles: NEW YORK (PENN STA) (NEW YORK, 7TH AVE. & W. 32ND ST.) . Services: ticket office, fully wheelchair accessible, enclosed waiting area, public restrooms, public payphones, full-service food facilities, snack bar, vending machines, ATM, paid short-term parking, paid long-term parking, call for car rental service, taxi stand, public transit connection.
- 8 miles: YONKERS (FOOT OF DOCK ST. & WELLS AVE.) . Services: fully wheelchair accessible, enclosed waiting area, public restrooms, public payphones, snack bar, paid short-term parking, paid long-term parking, call for car rental service, taxi stand, public transit connection.
- 9 miles: LA GUARDIA AIRPORT (QUEENS, ) - Bus Station . Services: enclosed waiting area, public restrooms, public payphones, snack bar and vending machines, ATM, paid short-term parking, paid long-term parking, car rental agency, taxi stand.
Colleges/universities with over 2000 students nearest to Palisades Park:
- CUNY City College (about 3 miles; New York, NY; Full-time enrollment: 12,533)
- Barnard College (about 4 miles; New York, NY; FT enrollment: 2,425)
- Teachers College at Columbia University (about 4 miles; New York, NY; FT enrollment: 3,762)
- Columbia University in the City of New York (about 4 miles; New York, NY; FT enrollment: 23,396)
- Yeshiva University (about 4 miles; New York, NY; FT enrollment: 4,015)
- Jersey College (about 4 miles; Teterboro, NJ; FT enrollment: 2,073)
- Fairleigh Dickinson University-Metropolitan Campus (about 4 miles; Teaneck, NJ; FT enrollment: 5,349)
Public high school in Palisades Park:
- PALISADES PARK JR-SR HIGH SCHOOL (Students: 590, Location: VETERANS PLAZA, Grades: 8-12)
Public elementary/middle schools in Palisades Park:
- LINDBERGH ELEMENTARY SCHOOL (Students: 659, Location: 401 GLEN AVE, Grades: 2-7)
- CHARLES R SMITH EARLY CHILHOOD CENTER (Location: 271 SECOND STREET, Grades: KG-1)
Private elementary/middle school in Palisades Park:
Points of interest:
Notable locations in Palisades Park: Palisades Park Emergency Medical Services (A), Palisades Park Fire Department (B). Display/hide their locations on the map
Churches in Palisades Park include: Grace Evangelical Lutheran Church (A), Central Bible Chapel (B), Saint Michael's Catholic Church (C). Display/hide their locations on the map
Birthplace of: Joan Bennett - Actress, Barbara McLean - Film editor, Barbara Bennett - Actress.
| This borough: | 2.8 people |
| New Jersey: | 2.7 people |
| This borough: | 72.4% |
| Whole state: | 69.3% |
| This borough: | 3.8% |
| Whole state: | 5.9% |
Likely homosexual households (counted as self-reported same-sex unmarried-partner households)
- Lesbian couples: 0.4% of all households
- Gay men: 0.2% of all households
9 people in other group homes in 2000
5 people in religious group quarters in 2000
Banks with most branches in Palisades Park (2011 data):
- JPMorgan Chase Bank, National Association: Palisades Park Branch at 460 Bergen Boulevard, branch established on 1993/10/25. Info updated 2011/11/10: Bank assets: $1,811,678.0 mil, Deposits: $1,190,738.0 mil, headquarters in Columbus, OH, positive income, International Specialization, 5577 total offices, Holding Company: Jpmorgan Chase & Co.
- Shinhan Bank America: Palisades Park Branch at 21 Grand Avenue, branch established on 2008/10/16. Info updated 2012/04/03: Bank assets: $958.9 mil, Deposits: $853.3 mil, headquarters in New York, NY, positive income, Commercial Lending Specialization, 15 total offices, Holding Company: Shinhan Financial Group Co., Ltd.
- PNC Bank, National Association: Palisades Park Branch at 264-266 Broad Avenue, branch established on 1934/04/05. Info updated 2012/03/20: Bank assets: $263,309.6 mil, Deposits: $197,343.0 mil, headquarters in Wilmington, DE, positive income, Commercial Lending Specialization, 3085 total offices, Holding Company: Pnc Financial Services Group, Inc., The
- BNB Bank, National Association: Palisades Park Branch at 136 Broad Avenue, branch established on 2004/11/15. Info updated 2006/11/03: Bank assets: $357.3 mil, Deposits: $304.7 mil, headquarters in Fort Lee, NJ, positive income, Commercial Lending Specialization, 4 total offices, Holding Company: Bnb Financial Services Corporation
- Sovereign Bank, National Association: Broad Avenue Branch at 300 Broad Avenue, branch established on 1995/11/17. Info updated 2012/01/31: Bank assets: $78,146.9 mil, Deposits: $48,042.9 mil, headquarters in Wilmington, DE, positive income, Commercial Lending Specialization, 718 total offices, Holding Company: Banco Santander, S.A.
- Woori America Bank: Palisades Park Branch at 225 Broad Avenue, branch established on 1995/03/15. Info updated 2012/04/03: Bank assets: $939.4 mil, Deposits: $822.6 mil, headquarters in New York, NY, positive income, Commercial Lending Specialization, 18 total offices, Holding Company: Woori Finance Holdings Co., Ltd.
- BankAsiana: Bankasiana at 7 Broad Avenue, branch established on 2007/10/31. Info updated 2011/07/01: Bank assets: $189.9 mil, Deposits: $148.4 mil, local headquarters, positive income, Commercial Lending Specialization, 3 total offices
- Oritani Bank: 350 Broad Ave Branch at 350 Broad Ave, branch established on 1911/01/01. Info updated 2008/09/08: Bank assets: $2,567.1 mil, Deposits: $1,374.4 mil, headquarters in Township Of Washington, NJ, positive income, Commercial Lending Specialization, 25 total offices
- Noah Bank: Palisades Park Branch at 449 Broad Avenue, branch established on 2007/03/01. Info updated 2011/07/01: Bank assets: $165.8 mil, Deposits: $152.4 mil, headquarters in Elkins Park, PA, positive income, Commercial Lending Specialization, 5 total offices
For population 15 years and over in Palisades Park:
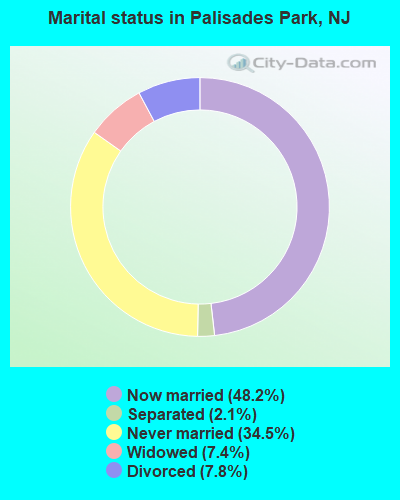
- Never married: 34.5%
- Now married: 48.2%
- Separated: 2.1%
- Widowed: 7.4%
- Divorced: 7.8%
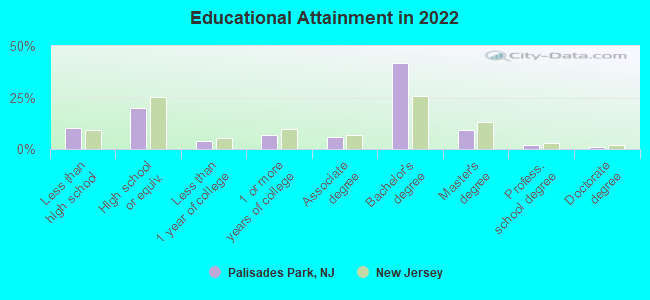
For population 25 years and over in Palisades Park:
- High school or higher: 91.2%
- Bachelor's degree or higher: 54.8%
- Graduate or professional degree: 12.0%
- Unemployed: 4.3%
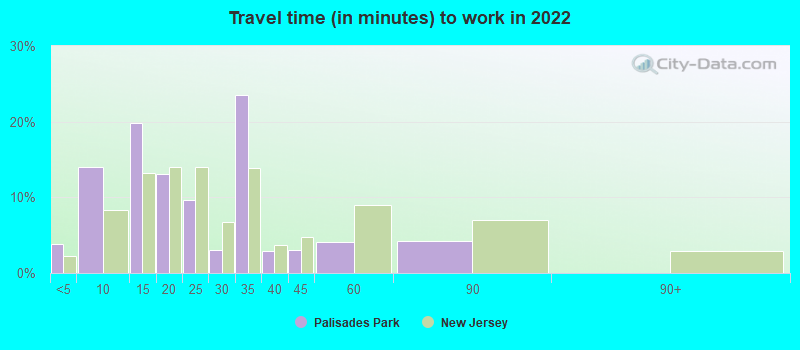
- Mean travel time to work (commute): 27.3 minutes
| Here: | 14.0 |
| New Jersey average: | 12.8 |
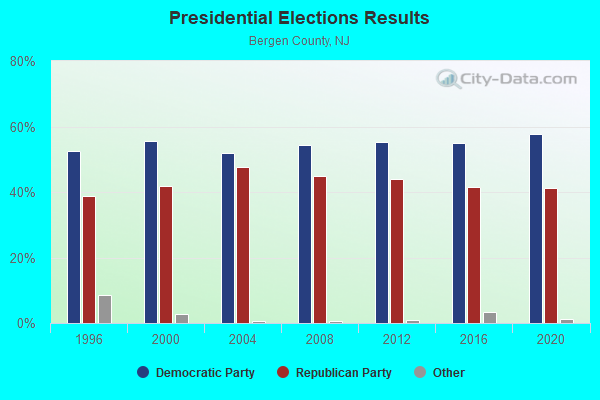
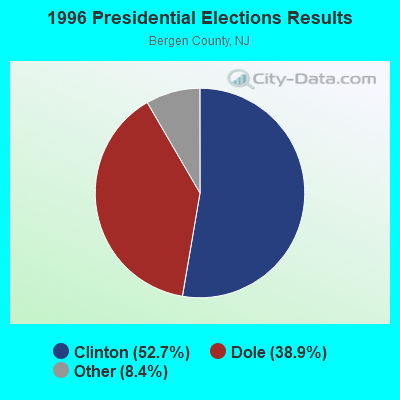
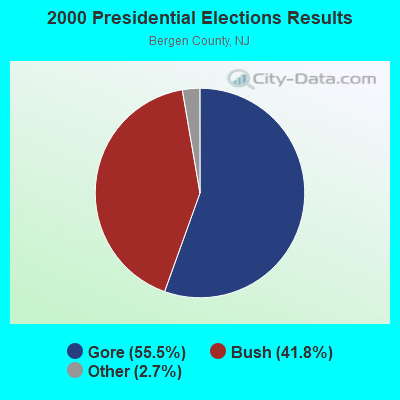
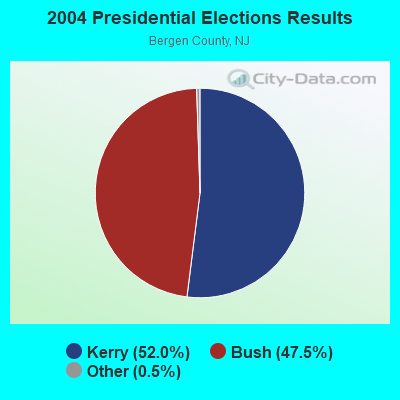
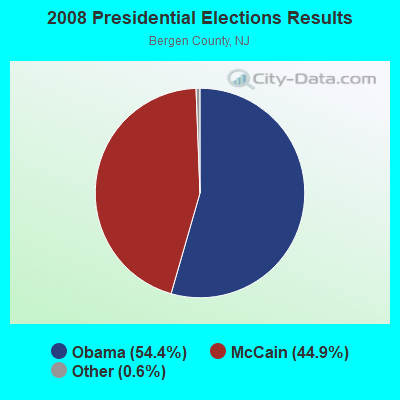


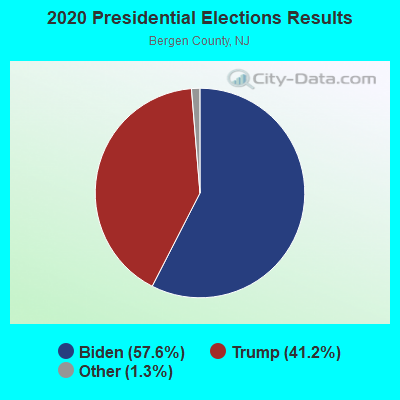
Graphs represent county-level data. Detailed 2008 Election Results
Political contributions by individuals in Palisades Park, NJ
Religion statistics for Palisades Park, NJ (based on Bergen County data)
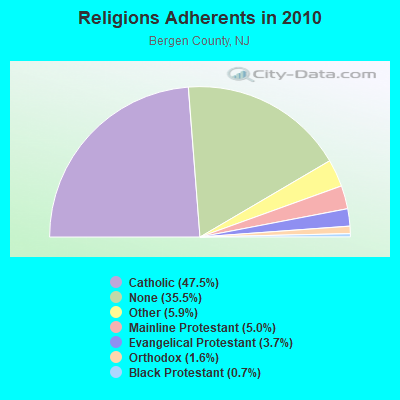
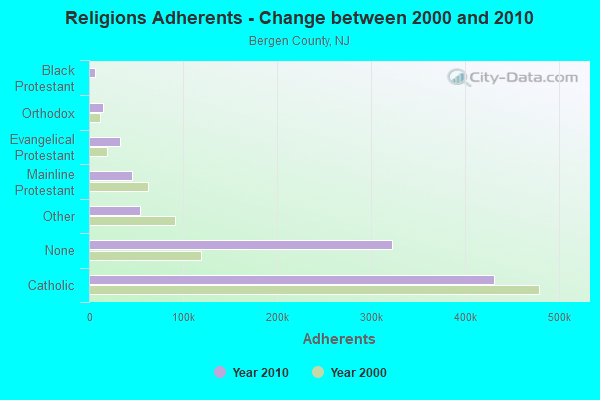
| Religion | Adherents | Congregations |
|---|---|---|
| Catholic | 430,007 | 80 |
| Other | 53,728 | 120 |
| Mainline Protestant | 45,613 | 210 |
| Evangelical Protestant | 33,419 | 234 |
| Orthodox | 14,373 | 20 |
| Black Protestant | 6,286 | 17 |
| None | 321,690 | - |
Food Environment Statistics:
| Here: | 2.90 / 10,000 pop. |
| New Jersey: | 2.90 / 10,000 pop. |
| Here: | 0.06 / 10,000 pop. |
| State: | 0.06 / 10,000 pop. |
| Bergen County: | 1.51 / 10,000 pop. |
| New Jersey: | 1.76 / 10,000 pop. |
| Here: | 1.07 / 10,000 pop. |
| State: | 0.81 / 10,000 pop. |
| Bergen County: | 8.07 / 10,000 pop. |
| State: | 7.15 / 10,000 pop. |
| Here: | 8.0% |
| New Jersey: | 8.3% |
| This county: | 19.6% |
| New Jersey: | 23.3% |
| Bergen County: | 17.9% |
| New Jersey: | 18.0% |
Health and Nutrition:
| Here: | 54.1% |
| New Jersey: | 50.6% |
| This city: | 50.0% |
| New Jersey: | 48.5% |
| This city: | 26.9 |
| State: | 28.5 |
| Palisades Park: | 17.0% |
| New Jersey: | 20.0% |
| Here: | 17.0% |
| New Jersey: | 11.1% |
| Here: | 6.9 |
| New Jersey: | 6.8 |
| Palisades Park: | 26.1% |
| State: | 33.6% |
| Palisades Park: | 58.0% |
| New Jersey: | 56.9% |
| Palisades Park: | 81.8% |
| New Jersey: | 80.0% |
More about Health and Nutrition of Palisades Park, NJ Residents
| Local government employment and payroll (March 2022) | |||||
| Function | Full-time employees | Monthly full-time payroll | Average yearly full-time wage | Part-time employees | Monthly part-time payroll |
|---|---|---|---|---|---|
| Police Protection - Officers | 40 | $390,593 | $117,178 | 0 | $0 |
| Streets and Highways | 14 | $65,368 | $56,030 | 10 | $11,988 |
| Other Government Administration | 11 | $96,769 | $105,566 | 18 | $19,143 |
| Local Libraries | 7 | $28,609 | $49,044 | 9 | $10,232 |
| Financial Administration | 4 | $27,521 | $82,563 | 3 | $9,843 |
| Judicial and Legal | 4 | $21,483 | $64,449 | 6 | $6,807 |
| Health | 3 | $15,766 | $63,064 | 2 | $381 |
| Police - Other | 3 | $16,787 | $67,148 | 13 | $20,670 |
| Firefighters | 0 | $0 | 1 | $324 | |
| Parks and Recreation | 0 | $0 | 7 | $5,317 | |
| Welfare | 0 | $0 | 4 | $7,127 | |
| Sewerage | 0 | $0 | 1 | $494 | |
| Solid Waste Management | 0 | $0 | 2 | $2,174 | |
| Other and Unallocable | 0 | $0 | 3 | $3,950 | |
| Totals for Government | 86 | $662,895 | $92,497 | 79 | $98,449 |
Palisades Park government finances - Expenditure in 2017 (per resident):
- Construction - Local Fire Protection: $804,000 ($39.99)
Regular Highways: $422,000 ($20.99)
Parks and Recreation: $177,000 ($8.80)
General - Other: $124,000 ($6.17)
- Current Operations - General - Other: $5,542,000 ($275.64)
Police Protection: $4,499,000 ($223.76)
Solid Waste Management: $1,484,000 ($73.81)
Regular Highways: $1,380,000 ($68.64)
Libraries: $844,000 ($41.98)
Central Staff Services: $709,000 ($35.26)
Judicial and Legal Services: $611,000 ($30.39)
Local Fire Protection: $543,000 ($27.01)
Protective Inspection and Regulation - Other: $383,000 ($19.05)
Financial Administration: $314,000 ($15.62)
Health - Other: $288,000 ($14.32)
Parks and Recreation: $204,000 ($10.15)
Parking Facilities: $59,000 ($2.93)
General Public Buildings: $59,000 ($2.93)
Sewerage: $29,000 ($1.44)
Housing and Community Development: $28,000 ($1.39)
- General - Interest on Debt: $285,000 ($14.17)
- Intergovernmental to Local - Other - Sewerage: $2,013,000 ($100.12)
- Other Capital Outlay - General - Other: $66,000 ($3.28)
Police Protection: $30,000 ($1.49)
Judicial and Legal Services: $23,000 ($1.14)
- Total Salaries and Wages: $6,265,000 ($311.60)
Palisades Park government finances - Revenue in 2017 (per resident):
- Charges - Parks and Recreation: $520,000 ($25.86)
Parking Facilities: $433,000 ($21.54)
Sewerage: $53,000 ($2.64)
Regular Highways: $21,000 ($1.04)
Other: $7,000 ($0.35)
- Local Intergovernmental - Other: $37,000 ($1.84)
- Miscellaneous - Fines and Forfeits: $1,111,000 ($55.26)
General Revenue - Other: $134,000 ($6.66)
Interest Earnings: $3,000 ($0.15)
- State Intergovernmental - General Local Government Support: $922,000 ($45.86)
Other: $43,000 ($2.14)
Health and Hospitals: $11,000 ($0.55)
- Tax - Property: $18,434,000 ($916.84)
Other License: $666,000 ($33.12)
Public Utilities Sales: $121,000 ($6.02)
Alcoholic Beverage License: $105,000 ($5.22)
Palisades Park government finances - Debt in 2017 (per resident):
- Long Term Debt - Beginning Outstanding - Unspecified Public Purpose: $6,875,000 ($341.94)
Outstanding Unspecified Public Purpose: $6,280,000 ($312.34)
Retired Unspecified Public Purpose: $595,000 ($29.59)
Palisades Park government finances - Cash and Securities in 2017 (per resident):
- Bond Funds - Cash and Securities: $1,494,000 ($74.31)
- Other Funds - Cash and Securities: $4,491,000 ($223.37)
- Sinking Funds - Cash and Securities: $14,000 ($0.70)
6.00% of this county's 2021 resident taxpayers lived in other counties in 2020 ($117,506 average adjusted gross income)
| Here: | 6.00% |
| New Jersey average: | 6.70% |
0.01% of residents moved from foreign countries ($60 average AGI)
Bergen County: 0.01% New Jersey average: 0.01%
Top counties from which taxpayers relocated into this county between 2020 and 2021:
| from Hudson County, NJ | |
| from Passaic County, NJ | |
| from New York County, NY |
6.43% of this county's 2020 resident taxpayers moved to other counties in 2021 ($129,044 average adjusted gross income)
| Here: | 6.43% |
| New Jersey average: | 7.02% |
0.01% of residents moved to foreign countries ($163 average AGI)
Bergen County: 0.01% New Jersey average: 0.02%
Top counties to which taxpayers relocated from this county between 2020 and 2021:
| to Passaic County, NJ | |
| to Hudson County, NJ | |
| to Essex County, NJ |
| Businesses in Palisades Park, NJ | ||||
| Name | Count | Name | Count | |
|---|---|---|---|---|
| AT&T | 1 | Nike | 2 | |
| Dunkin Donuts | 1 | UPS | 5 | |
| FedEx | 4 | Wine & Spirits | 1 | |
Strongest AM radio stations in Palisades Park:
- WBBR (1130 AM; 50 kW; NEW YORK, NY; Owner: BLOOMBERG COMMUNICATIONS INC.)
- WABC (770 AM; 50 kW; NEW YORK, NY; Owner: WABC-AM RADIO, INC.)
- WEPN (1050 AM; 50 kW; NEW YORK, NY; Owner: NEW YORK AM RADIO, LLC)
- WZRC (1480 AM; 5 kW; NEW YORK, NY; Owner: MULTICULTURAL RADIO BRODCASTING, INC)
- WADO (1280 AM; 50 kW; NEW YORK, NY; Owner: WADO-AM LICENSE CORP.)
- WOR (710 AM; 50 kW; NEW YORK, NY; Owner: BUCKLEY BROADCASTING CORPORATION)
- WINS (1010 AM; 50 kW; NEW YORK, NY; Owner: INFINITY BROADCASTING OPERATIONS, INC.)
- WMCA (570 AM; 50 kW; NEW YORK, NY; Owner: SALEM MEDIA OF NEW YORK, LLC)
- WWRL (1600 AM; 25 kW; NEW YORK, NY; Owner: ACCESS.1 COMMUNICATIONS CORP.-NY)
- WFAN (660 AM; 50 kW; NEW YORK, NY; Owner: INFINITY BROADCASTING OPERATIONS, INC.)
- WLIB (1190 AM; 30 kW; NEW YORK, NY; Owner: ICBC BROADCAST HOLDINGS-NY, INC.)
- WCBS (880 AM; 50 kW; NEW YORK, NY; Owner: INFINITY BROADCASTING OPERATIONS, INC.)
- WQEW (1560 AM; 50 kW; NEW YORK, NY; Owner: THE NEW YORK TIMES ELECTRONIC MEDIA COMPANY)
Strongest FM radio stations in Palisades Park:
- W276AQ (103.1 FM; FORT LEE, NJ; Owner: GERARD A. TURRO)
- WKCR-FM (89.9 FM; NEW YORK, NY; Owner: TRUSTEES OF COLUMBIA UNIVERSITY IN NEW YORK)
- WKTU (103.5 FM; LAKE SUCCESS, NY; Owner: AMFM RADIO LICENSES, LLC)
- WAXQ (104.3 FM; NEW YORK, NY; Owner: AMFM NEW YORK LICENSES, LLC)
- WHTZ (100.3 FM; NEWARK, NJ; Owner: AMFM RADIO LICENSES, L.L.C.)
- WWPR-FM (105.1 FM; NEW YORK, NY; Owner: AMFM RADIO LICENSES, L.L.C.)
- WCBS-FM (101.1 FM; NEW YORK, NY; Owner: INFINITY BROADCASTING OPERATIONS, INC.)
- WQCD (101.9 FM; NEW YORK, NY; Owner: EMMIS RADIO LICENSE CORPORATION)
- WNEW (102.7 FM; NEW YORK, NY; Owner: INFINITY BROADCASTING OPERATIONS, INC.)
- WCAA (105.9 FM; NEWARK, NJ; Owner: WADO-AM LICENSE CORP. ("WADO"))
- WBAI (99.5 FM; NEW YORK, NY; Owner: PACIFICA FOUNDATION, INC.)
- WBLS (107.5 FM; NEW YORK, NY; Owner: ICBC BROADCAST HOLDINGS-NY, INC.)
- WLTW (106.7 FM; NEW YORK, NY; Owner: AMFM NEW YORK LICENSES, LLC)
- WQXR-FM (96.3 FM; NEW YORK, NY; Owner: THE NEW YORK TIMES ELECTRONIC MEDIA COMPANY)
- WSKQ-FM (97.9 FM; NEW YORK, NY; Owner: WSKQ LICENSING, INC.)
- WXRK (92.3 FM; NEW YORK, NY; Owner: INFINITY BROADCASTING OPERATIONS, INC.)
- WQHT (97.1 FM; NEW YORK, NY; Owner: EMMIS LICENSE CORPORATION OF NEW YORK)
- WPLJ (95.5 FM; NEW YORK, NY; Owner: WPLJ-FM RADIO, INC.)
- WNYC-FM (93.9 FM; NEW YORK, NY; Owner: WNYC RADIO)
- WPAT-FM (93.1 FM; PATERSON, NJ; Owner: WPAT LICENSING, INC.)
TV broadcast stations around Palisades Park:
- WNYW (Channel 5; NEW YORK, NY; Owner: FOX TELEVISION STATIONS, INC.)
- WNJU (Channel 47; LINDEN, NJ; Owner: WNJU LICENSE CORPORATION)
- WFUT (Channel 68; NEWARK, NJ; Owner: UNIVISION NEW YORK LLC)
- WCBS-TV (Channel 2; NEW YORK, NY; Owner: CBS BROADCASTING INC.)
- WNYE-TV (Channel 25; NEW YORK, NY; Owner: NEW YORK CITY BOARD OF EDUCATION)
- WABC-TV (Channel 7; NEW YORK, NY; Owner: AMERICAN BROADCASTING COMPANIES, INC)
- WPIX (Channel 11; NEW YORK, NY; Owner: WPIX, INC.)
- WWOR-TV (Channel 9; SECAUCUS, NJ; Owner: FOX TELEVISION STATIONS, INC.)
- WXNY-LP (Channel 32; NEW YORK, NY; Owner: ISLAND BROADCASTING COMPANY)
- WKOB-LP (Channel 53; NEW YORK, NY; Owner: WKOB COMMUNICATIONS, INC.)
- WEBR-CA (Channel 17; MANHATTAN, NY; Owner: K LICENSEE INC.)
- WRNN-LP (Channel 57; NYACK, NY; Owner: LP NYACK LIMITED PARTNERSHIP)
- WPXN-TV (Channel 31; NEW YORK, NY; Owner: PAXSON COMMUNICATIONS LICENSE COMPANY, LLC)
- WNBC (Channel 4; NEW YORK, NY; Owner: NATIONAL BROADCASTING COMPANY, INC.)
- WNET (Channel 13; NEWARK, NJ; Owner: EDUCATIONAL BROADCASTING CORPORATION)
- WXTV (Channel 41; PATERSON, NJ; Owner: WXTV LICENSE PARTNERSHIP, G.P.)
- W60AI (Channel 60; NEW YORK, NY; Owner: VENTANA TELEVISION, INC.)
- WNXY-LP (Channel 26; NEW YORK, NY; Owner: ISLAND BROADCASTING COMPANY)
- W33BS (Channel 33; DARIEN, CT; Owner: CT&T BROADCASTING, INC.)
- WNYN-LP (Channel 39; NEW YORK, NY; Owner: ISLAND BROADCASTING COMPANY)
- WNYX-LP (Channel 35; NEW YORK, NY; Owner: ISLAND BROADCASTING COMPANY)
- W68DN (Channel 68; CHERRY HILL, ETC., NJ; Owner: MARCIA COHEN)
- WPXO-LP (Channel 34; EAST ORANGE, NJ; Owner: PAXSON COMMUNICATIONS LPTV, INC.)
- W38CL (Channel 38; BRONX, NY; Owner: RENARD COMMUNICATIONS CORP.)
- WFME-TV (Channel 66; WEST MILFORD, NJ; Owner: FAMILY STATIONS, INC.)
- National Bridge Inventory (NBI) Statistics
- 18Number of bridges
- 62ft / 19.4mTotal length
- $21,769,000Total costs
- 454,065Total average daily traffic
- 17,128Total average daily truck traffic
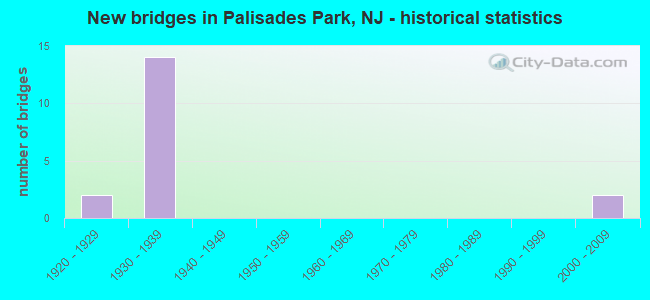
- New bridges - historical statistics
- 21920-1929
- 141930-1939
- 22000-2009
FCC Registered Antenna Towers:
6- MARIN FETTMAN, 530 10th St (Nj05232b) (Lat: 40.847639 Lon: -73.983944), Type: 13.4, Overall height: 13.4 m, Registrant: T-Mobile Northeast LLC, Marin.Fettman@t-Mobile.Com, , Belle-vue, Phone: (425) 383-4000
- Marin Fettman, 530 10th St (Nj05232b) (Lat: 40.847639 Lon: -73.983944), Type: 13.4, Overall height: 13.4 m, Registrant: T-Mobile Northeast LLC, Marin.Fettman@t-Mobile.Com, , Belle-vue, Phone: (425) 383-4000
- Marin Fettman, 530 10th St (Nj05232b) (Lat: 40.847639 Lon: -73.983944), Type: 13.4, Overall height: 13.4 m, Registrant: T-Mobile Northeast LLC, Marin.Fettman@t-Mobile.Com, , Belle-vue, Phone: (425) 383-4000
- Marin Fettman, 530 10th St (Nj05232b) (Lat: 40.847639 Lon: -73.983944), Type: 13.4, Overall height: 13.4 m, Registrant: T-Mobile Northeast LLC, Marin.Fettman@t-Mobile.Com, , Belle-vue, Phone: (425) 383-4000
- Dan Menser, 530 10th St (Nj05232b) (Lat: 40.847639 Lon: -73.983944), Type: 13.4, Overall height: 13.4 m, Registrant: T-Mobile Northeast LLC, Fccasrrequest@t-Mobile.Com, , Belle-vue, Phone: (425) 383-4000
- Shannon Reilly Kraus, 530 10th St (Nj05232b) (Lat: 40.847639 Lon: -73.983944), Type: 13.4, Overall height: 13.4 m, Registrant: T-Mobile Northeast LLC, Fccregulatorycompliancecontact@t-Mobile.Com, , Belle-vue, Phone: (425) 383-8401
FCC Registered Broadcast Land Mobile Towers:
2- 460 Bergen Blvd (Lat: 40.845972 Lon: -73.985278), Type: Bant, Structure height: 12 m, Overall height: 15 m, Call Sign: WPOY784,
Assigned Frequencies: 153.237 MHz, Grant Date: 06/17/2014, Expiration Date: 09/07/2024, Certifier: Matt Halton, Registrant: Wireless Management Corp, Fair Lawn, NJ 07010, Phone: (201) 926-3510, Fax: (201) 796-5805, Email:
- ST. MICHAEL\'S CHURCH, 312 First St (Lat: 40.848056 Lon: -73.996083), Type: Building, Structure height: 9 m, Call Sign: WQZV455,
Assigned Frequencies: 465.000 MHz, 462.900 MHz, Grant Date: 08/14/2017, Expiration Date: 08/14/2027, Certifier: Mark Valvano, Registrant: Visiplex, Inc., 1287 North Barclay Boulevard, Buffalo Grove, IL 60089, Phone: (847) 229-0250, Fax: (847) 229-0259, Email:
FCC Registered Microwave Towers:
3- NJY0366, 40 East Columbia Avenue (Lat: 40.841667 Lon: -74.000000), Type: Bant, Structure height: 28 m, Call Sign: WQHD497, Licensee ID: L01728370,
Assigned Frequencies: 19460.0 MHz, Grant Date: 07/05/2007, Expiration Date: 07/05/2017, Cancellation Date: 09/10/2013, Certifier: Joseph M Sandri Jr., Registrant: Fibertower Network Services, Corp., Debtor-In-Possession, 1875 Eye Street, Nw, 5th Floor, Room 505, Washington, DC 20006, Phone: (202) 223-1028, Email:
- NJ-NNJ5726A, 460 Bergen Blvd. (Lat: 40.845944 Lon: -73.985083), Type: Bant, Structure height: 15.8 m, Overall height: 18.8 m, Call Sign: WQLT674,
Assigned Frequencies: 23325.0 MHz, Grant Date: 07/08/2020, Expiration Date: 04/22/2030, Cancellation Date: 03/12/2021, Certifier: Nadja S Sodos-Wallace, Registrant: Sprint Corporation, 12502 Sunrise Valley Drive, M/S: Varesa0209, Reston, VA 20196, Phone: (800) 572-8256, Fax: (703) 433-4483, Email:
- NY-NYC3712A, 15 Grand Avenue (Lat: 40.844222 Lon: -74.004889), Type: Bant, Structure height: 28 m, Overall height: 30 m, Call Sign: WQLW835,
Assigned Frequencies: 19525.0 MHz, 19625.0 MHz, 19575.0 MHz, 19675.0 MHz, 19375.0 MHz, 19475.0 MHz, Grant Date: 06/23/2020, Expiration Date: 05/13/2030, Cancellation Date: 09/13/2021, Certifier: Nadja S Sodos-Wallace, Registrant: T-Mobile Usa, Inc., 12920 Se 38th Street, Bellevue, WA 98006, Phone: (425) 383-8402, Fax: (425) 383-4840, Email:
FCC Registered Amateur Radio Licenses:
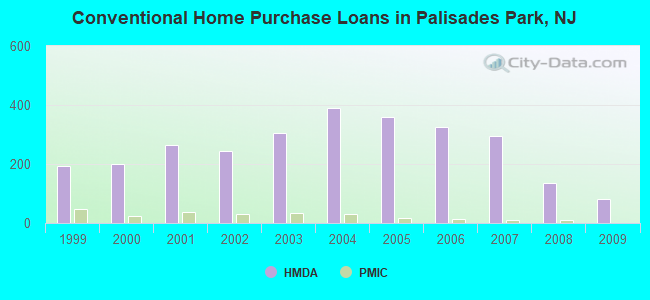
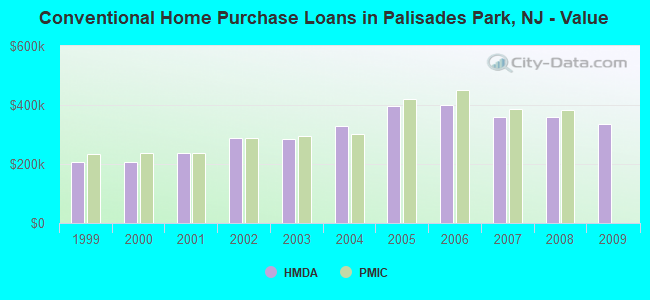
30 (See the full list of FCC Registered Amateur Radio Licenses in Palisades Park)| Home Mortgage Disclosure Act Aggregated Statistics For Year 2009 (Based on 3 full tracts) | ||||||||||||
| A) FHA, FSA/RHS & VA Home Purchase Loans | B) Conventional Home Purchase Loans | C) Refinancings | D) Home Improvement Loans | E) Loans on Dwellings For 5+ Families | F) Non-occupant Loans on < 5 Family Dwellings (A B C & D) | |||||||
|---|---|---|---|---|---|---|---|---|---|---|---|---|
| Number | Average Value | Number | Average Value | Number | Average Value | Number | Average Value | Number | Average Value | Number | Average Value | |
| LOANS ORIGINATED | 7 | $390,429 | 82 | $335,817 | 198 | $323,212 | 10 | $230,700 | 1 | $2,000,000 | 18 | $342,278 |
| APPLICATIONS APPROVED, NOT ACCEPTED | 0 | $0 | 21 | $388,667 | 25 | $322,320 | 0 | $0 | 0 | $0 | 3 | $293,000 |
| APPLICATIONS DENIED | 3 | $400,667 | 36 | $317,111 | 92 | $360,946 | 7 | $169,000 | 0 | $0 | 21 | $297,905 |
| APPLICATIONS WITHDRAWN | 3 | $490,667 | 8 | $309,625 | 55 | $349,745 | 1 | $50,000 | 0 | $0 | 4 | $319,500 |
| FILES CLOSED FOR INCOMPLETENESS | 1 | $304,000 | 3 | $364,667 | 17 | $356,706 | 0 | $0 | 0 | $0 | 3 | $492,333 |
Detailed HMDA statistics for the following Tracts: 0411.00 , 0412.00, 0413.00
| Private Mortgage Insurance Companies Aggregated Statistics For Year 2009 (Based on 3 full tracts) | ||||
| A) Conventional Home Purchase Loans | B) Refinancings | |||
|---|---|---|---|---|
| Number | Average Value | Number | Average Value | |
| LOANS ORIGINATED | 0 | $0 | 0 | $0 |
| APPLICATIONS APPROVED, NOT ACCEPTED | 5 | $396,400 | 2 | $224,500 |
| APPLICATIONS DENIED | 0 | $0 | 1 | $223,000 |
| APPLICATIONS WITHDRAWN | 0 | $0 | 0 | $0 |
| FILES CLOSED FOR INCOMPLETENESS | 0 | $0 | 0 | $0 |
Detailed PMIC statistics for the following Tracts: 0411.00 , 0412.00, 0413.00
2004 - 2018 National Fire Incident Reporting System (NFIRS) incidents
- Fire incident types reported to NFIRS in Palisades Park, NJ
- 56870.3%Structure Fires
- 17721.9%Outside Fires
- 516.3%Mobile Property/Vehicle Fires
- 121.5%Other
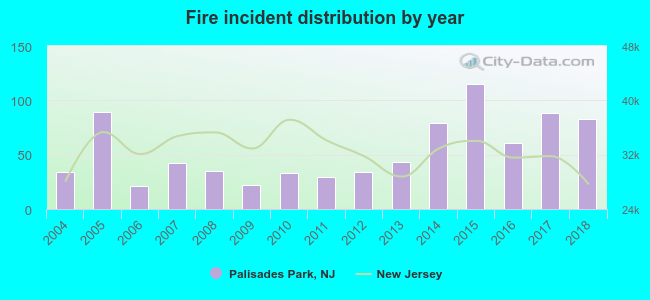 According to the data from the years 2004 - 2018 the average number of fire incidents per year is 54. The highest number of reported fire incidents - 115 took place in 2015, and the least - 21 in 2006. The data has a growing trend.
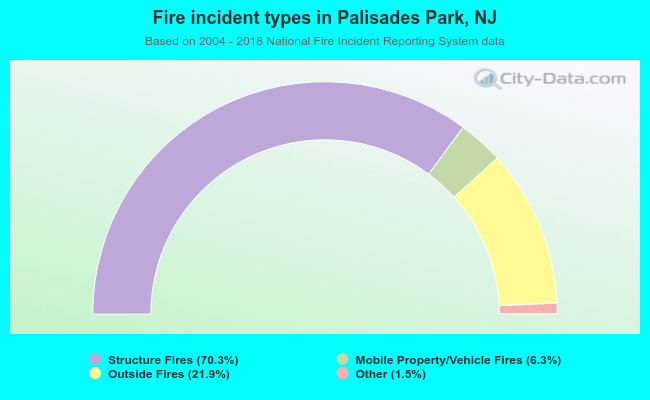 When looking into fire subcategories, the most reports belonged to: Structure Fires (70.3%), and Outside Fires (21.9%).
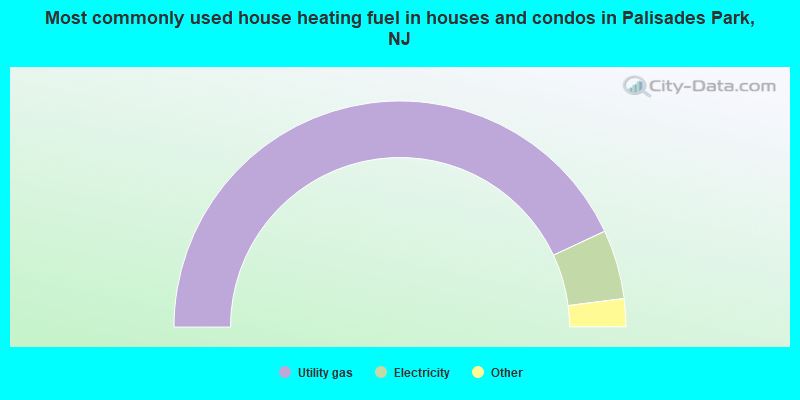
- 86.1%Utility gas
- 9.9%Electricity
- 2.3%Bottled, tank, or LP gas
- 1.7%Fuel oil, kerosene, etc.
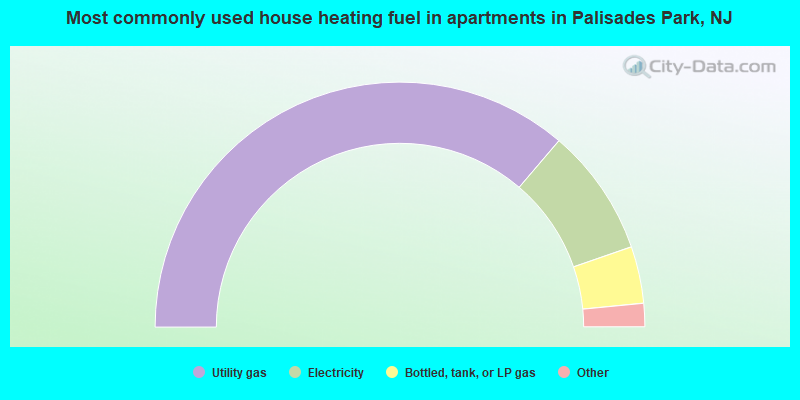
- 72.5%Utility gas
- 16.9%Electricity
- 7.5%Bottled, tank, or LP gas
- 2.3%Fuel oil, kerosene, etc.
- 0.5%No fuel used
- 0.2%Other fuel
Palisades Park compared to New Jersey state average:
- Median house value above state average.
- Unemployed percentage significantly below state average.
- Black race population percentage significantly below state average.
- Median age below state average.
- Foreign-born population percentage significantly above state average.
- Renting percentage above state average.
- Length of stay since moving in below state average.
- Number of rooms per house below state average.
- Percentage of population with a bachelor's degree or higher above state average.
Palisades Park on our top lists:
- #1 on the list of "Top 101 cities with the most residents born in Eastern Asia (population 500+)"
- #1 on the list of "Top 101 cities with the most residents born in Korea (population 500+)"
- #10 on the list of "Top 101 cities with the most residents born in Asia (population 500+)"
- #14 on the list of "Top 101 cities with largest percentage of females in industries: other services, except public administration (population 5,000+)"
- #20 on the list of "Top 100 cities with highest percentage of foreign-born residents"
- #55 on the list of "Top 101 cities with the most residents born in Afghanistan (population 500+)"
- #63 on the list of "Top 101 cities with the most residents born in Guatemala (population 500+)"
- #68 on the list of "Top 101 cities with the highest housing density (population 2,000+)"
- #76 on the list of "Top 101 cities with the most people taking a bus, a trolley bus, a streetcar, or a trolley car to work (population 5,000+)"
- #93 on the list of "Top 101 cities with the most people walking to work (population 5,000+)"
- #95 on the list of "Top 101 cities with the lowest percentage of English-only speaking households, population 5,000+"
- #97 on the list of "Top 101 cities with the most people taking a taxi to work (population 5,000+)"
- #31 (07650) on the list of "Top 101 zip codes with the largest percentage of Greek first ancestries (pop 5,000+)"
- #11 on the list of "Top 101 counties with the largest number of people without health insurance coverage in 2000 (pop. 50,000+)"
- #11 on the list of "Top 101 counties with the most Orthodox adherents"
- #14 on the list of "Top 101 counties with the lowest number of infant deaths per 1000 residents 2007-2013 (pop. 50,000+)"
- #16 on the list of "Top 101 counties with the most Orthodox congregations"
- #19 on the list of "Top 101 counties with the most Mainline Protestant congregations"

|
|
Total of 85 patent applications in 2008-2024.