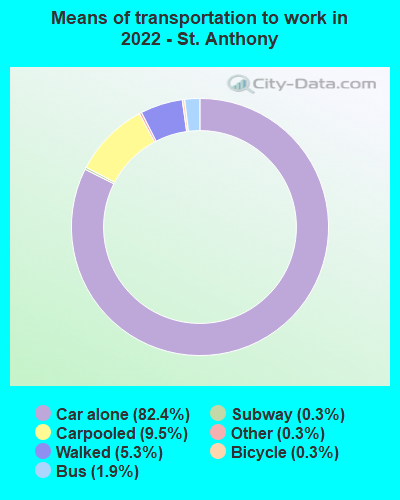
St. Anthony, Minnesota
Submit your own pictures of this city and show them to the world
- OSM Map
- General Map
- Google Map
- MSN Map
Population change since 2000: +26.4%
 |
| Males: 5,291 | |
| Females: 4,833 |
| Median resident age: | 41.6 years |
| Minnesota median age: | 39.0 years |
Zip codes: 56307.
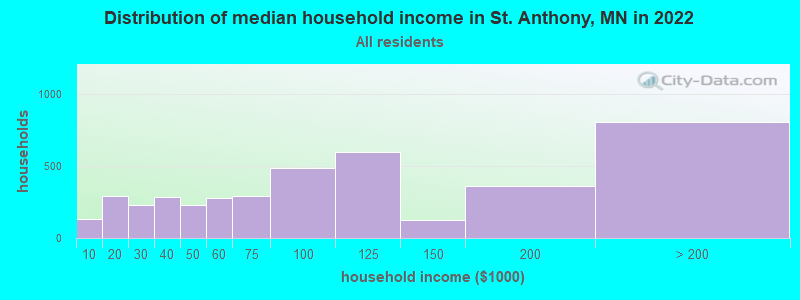
| St. Anthony: | $88,781 |
| MN: | $82,338 |
Estimated per capita income in 2022: $56,989 (it was $26,290 in 2000)
St. Anthony city income, earnings, and wages data
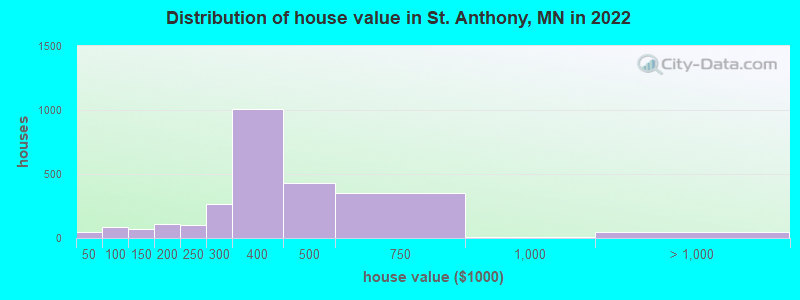
Estimated median house or condo value in 2022: $368,989 (it was $137,500 in 2000)
| St. Anthony: | $368,989 |
| MN: | $314,600 |
Mean prices in 2022: all housing units: $375,730; detached houses: $423,085; townhouses or other attached units: $282,073; in 2-unit structures: $399,307; in 5-or-more-unit structures: $216,687; mobile homes: $17,084
Median gross rent in 2022: $1,298.
(2.8% for White Non-Hispanic residents, 19.4% for American Indian residents)
Detailed information about poverty and poor residents in St. Anthony, MN


Compare current foreclosures near St. Anthony, MN:
| Photo | Address | Area | Beds / Baths | Price | Details |
|---|---|---|---|---|---|

|
#1
26th Ave S
Minneapolis, MN 55406
|
1,232 sq. feet
|
1 baths 2 beds |
$309,900
|
show details |

|
#2
Xebec St NE
Minneapolis, MN 55449
|
1,304 sq. feet
|
2 baths 4 beds |
$299,250
|
show details |

|
#3
Portland Ave # 1412
Minneapolis, MN 55415
|
1,333 sq. feet
|
2 baths 2 beds |
$424,900
|
show details |

|
#4
York Ave S Apt 122
Minneapolis, MN 55435
|
956 sq. feet
|
1 baths 1 beds |
$157,000
|
show details |

|
#5
Oakland Ave
Minneapolis, MN 55407
|
1,170 sq. feet
|
1 baths 2 beds |
$199,500
|
show details |

|
#6
76th Street E. Unit
Inver Grove Heights, MN 55076
|
1,048 sq. feet
|
2 baths 2 beds |
$219,900
|
show details |

|
#7
W 44th St Apt 7
Minneapolis, MN 55410
|
710 sq. feet
|
1 baths 2 beds |
$154,900
|
show details |

|
#8
Parklawn Ave Apt 109
Minneapolis, MN 55435
|
1,121 sq. feet
|
2 baths 2 beds |
$105,000
|
show details |

|
#9
Groveland Ave Apt 1708
Minneapolis, MN 55403
|
739 sq. feet
|
1 baths 1 beds |
$98,000
|
show details |

|
#10
Quebec Ave N
Minneapolis, MN 55428
|
1,226 sq. feet
|
1 baths 2 beds |
$314,900
|
show details |
| Photo | Address | Area | Beds / Baths | Price | Details |
|---|---|---|---|---|---|

|
#11
Granite St
Saint Paul, MN 55117
|
2,136 sq. feet
|
2 baths 4 beds |
$172,000
|
show details |

|
#12
Bedford Ave
Minneapolis, MN 55436
|
1,726 sq. feet
|
1 baths 3 beds |
$299,900
|
show details |

|
#13
1st Ave S
Minneapolis, MN 55408
|
1,932 sq. feet
|
2 baths 3 beds |
$354,900
|
show details |

|
#14
Wacouta St Unit Unit Gl-D
Saint Paul, MN 55101
|
- sq. feet
|
1 baths 1 beds |
$179,900
|
show details |

|
#15
Wheelock Ln
Saint Paul, MN 55117
|
907 sq. feet
|
1 baths 2 beds |
show details | |

|
#16
Oakley Ave
Saint Paul, MN 55104
|
1,924 sq. feet
|
2 baths 4 beds |
show details | |

|
#17
Rice Creek Ter
Saint Paul, MN 55112
|
2,248 sq. feet
|
2 baths 4 beds |
show details | |

|
#18
119th Ln NW
Minneapolis, MN 55448
|
794 sq. feet
|
2 baths 3 beds |
show details | |

|
#19
119th Ln NW
Minneapolis, MN 55448
|
794 sq. feet
|
1 baths 2 beds |
show details | |

|
#20
Argyle St
Saint Paul, MN 55103
|
936 sq. feet
|
1 baths 2 beds |
show details |
| Photo | Address | Area | Beds / Baths | Price | Details |
|---|---|---|---|---|---|

|
#21
Lake St
Saint Paul, MN 55119
|
1,008 sq. feet
|
2 baths 3 beds |
show details | |

|
#22
Jackson Ave S
Hopkins, MN 55343
|
1,104 sq. feet
|
2 baths 4 beds |
show details | |

|
#23
Humboldt Ave N
Minneapolis, MN 55430
|
1,012 sq. feet
|
1 baths 2 beds |
show details | |

|
#24
Logan Ave N
Minneapolis, MN 55411
|
1,708 sq. feet
|
2 baths 4 beds |
show details | |

|
#25
Chicago Ave
Minneapolis, MN 55404
|
2,688 sq. feet
|
2 baths 4 beds |
show details | |

|
#26
Christensen Ave
Saint Paul, MN 55118
|
2,574 sq. feet
|
2 baths 5 beds |
show details | |

|
#27
125th Ln NE
Minneapolis, MN 55434
|
914 sq. feet
|
1 baths 2 beds |
show details | |

|
#28
81st Ave N
Minneapolis, MN 55443
|
1,533 sq. feet
|
3 baths 3 beds |
show details | |

|
#29
Asbury St
Saint Paul, MN 55104
|
1,198 sq. feet
|
1 baths 2 beds |
show details | |

|
#30
64th Ave N
Minneapolis, MN 55429
|
1,130 sq. feet
|
2 baths 3 beds |
show details |
| Photo | Address | Area | Beds / Baths | Price | Details |
|---|---|---|---|---|---|

|
#31
3rd St E
Saint Paul, MN 55106
|
1,016 sq. feet
|
1 baths 3 beds |
show details | |

|
#32
42nd Ave S
Minneapolis, MN 55406
|
936 sq. feet
|
1 baths 2 beds |
show details | |

|
#33
Magnolia St NW
Minneapolis, MN 55448
|
960 sq. feet
|
1 baths 3 beds |
show details | |

|
#34
Brooklyn Blvd
Minneapolis, MN 55429
|
1,232 sq. feet
|
1 baths 4 beds |
show details | |

|
#35
41st Ave S
Minneapolis, MN 55406
|
1,504 sq. feet
|
2 baths 3 beds |
show details | |

|
#36
Woodlake Dr
Minneapolis, MN 55423
|
976 sq. feet
|
1 baths 1 beds |
show details | |

|
#37
64th Ave N
Minneapolis, MN 55429
|
1,131 sq. feet
|
1 baths 3 beds |
show details | |

|
#38
118th Ave NE
Minneapolis, MN 55434
|
846 sq. feet
|
1 baths 3 beds |
show details | |

|
#39
Lake Shore Dr S Apt 1012
Minneapolis, MN 55423
|
1,040 sq. feet
|
1 baths 2 beds |
show details | |

|
#40
Topping St
Saint Paul, MN 55103
|
785 sq. feet
|
1 baths 2 beds |
show details |
| Photo | Address | Area | Beds / Baths | Price | Details |
|---|---|---|---|---|---|

|
#41
Iroquois Ave
Saint Paul, MN 55119
|
1,090 sq. feet
|
1 baths 3 beds |
show details | |

|
#42
Able St NE
Minneapolis, MN 55434
|
1,172 sq. feet
|
1 baths 4 beds |
show details | |

|
#43
2nd Ave N
Minneapolis, MN 55405
|
1,092 sq. feet
|
1 baths 3 beds |
show details | |

|
#44
10th Ave S
Minneapolis, MN 55423
|
928 sq. feet
|
1 baths 3 beds |
show details | |

|
#45
Nokomis Ave
Saint Paul, MN 55119
|
1,152 sq. feet
|
2 baths 3 beds |
show details | |

|
#46
35th Ave S
Minneapolis, MN 55406
|
920 sq. feet
|
2 baths 2 beds |
show details | |

|
#47
Oliver Ave N
Minneapolis, MN 55411
|
1,012 sq. feet
|
1 baths 2 beds |
show details | |

|
#48
Edgewood Dr
Saint Paul, MN 55112
|
1,508 sq. feet
|
2 baths 3 beds |
show details | |

|
#49
James Ave N
Minneapolis, MN 55412
|
918 sq. feet
|
1 baths 3 beds |
show details | |

|
Check over 1 million property listings on Foreclosure.com!
|
browse all offers | |||


- 7,11876.9%White alone
- 8759.5%Black alone
- 5776.2%Asian alone
- 4384.7%Two or more races
- 1351.5%Hispanic
- 400.4%Other race alone
- 240.3%American Indian alone
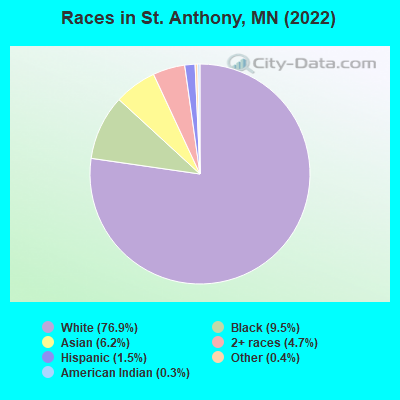
Races in St. Anthony detailed stats: ancestries, foreign born residents, place of birth
Type |
2009 |
2010 |
2011 |
2012 |
2013 |
2014 |
2015 |
2016 |
2017 |
2018 |
2019 |
2020 |
2021 |
2022 |
|---|---|---|---|---|---|---|---|---|---|---|---|---|---|---|
| Murders (per 100,000) | 0 (0.0) | 0 (0.0) | 0 (0.0) | 1 (11.9) | 0 (0.0) | 0 (0.0) | 0 (0.0) | 0 (0.0) | 0 (0.0) | 0 (0.0) | 0 (0.0) | 0 (0.0) | 1 (8.7) | 0 (0.0) |
| Rapes (per 100,000) | 1 (11.8) | 2 (24.3) | 2 (24.1) | 3 (35.8) | 2 (23.7) | 0 (0.0) | 1 (10.9) | 1 (10.9) | 4 (43.7) | 4 (43.5) | 4 (43.6) | 2 (22.0) | 2 (17.4) | 0 (0.0) |
| Robberies (per 100,000) | 5 (59.1) | 3 (36.5) | 5 (60.3) | 2 (23.8) | 5 (59.2) | 7 (80.6) | 2 (21.9) | 2 (21.9) | 8 (87.3) | 7 (76.0) | 2 (21.8) | 10 (110.0) | 16 (139.3) | 9 (77.8) |
| Assaults (per 100,000) | 3 (35.5) | 2 (24.3) | 2 (24.1) | 5 (59.6) | 2 (23.7) | 3 (34.6) | 2 (21.9) | 4 (43.7) | 5 (54.6) | 8 (86.9) | 3 (32.7) | 6 (66.0) | 13 (113.1) | 5 (43.2) |
| Burglaries (per 100,000) | 66 (780.2) | 49 (595.7) | 59 (711.8) | 44 (524.6) | 51 (603.9) | 49 (564.5) | 32 (349.7) | 40 (437.2) | 41 (447.6) | 31 (336.8) | 30 (327.1) | 32 (351.8) | 62 (539.6) | 70 (605.1) |
| Thefts (per 100,000) | 253 (2,991) | 233 (2,832) | 240 (2,895) | 277 (3,302) | 306 (3,623) | 189 (2,177) | 113 (1,235) | 146 (1,596) | 158 (1,725) | 164 (1,782) | 154 (1,679) | 195 (2,144) | 328 (2,855) | 329 (2,844) |
| Auto thefts (per 100,000) | 9 (106.4) | 16 (194.5) | 7 (84.4) | 14 (166.9) | 16 (189.5) | 9 (103.7) | 9 (98.3) | 6 (65.6) | 10 (109.2) | 11 (119.5) | 10 (109.0) | 18 (197.9) | 39 (339.4) | 59 (510.0) |
| Arson (per 100,000) | 1 (11.8) | 2 (24.3) | 0 (0.0) | 0 (0.0) | 1 (11.8) | 0 (0.0) | 0 (0.0) | 0 (0.0) | 0 (0.0) | 1 (10.9) | 1 (10.9) | 0 (0.0) | 1 (8.7) | 1 (8.6) |
| City-Data.com crime index | 217.0 | 205.8 | 214.6 | 253.7 | 243.8 | 166.0 | 101.4 | 123.7 | 181.1 | 179.4 | 146.8 | 190.0 | 274.8 | 228.9 |
The City-Data.com crime index weighs serious crimes and violent crimes more heavily. Higher means more crime, U.S. average is 246.1. It adjusts for the number of visitors and daily workers commuting into cities.
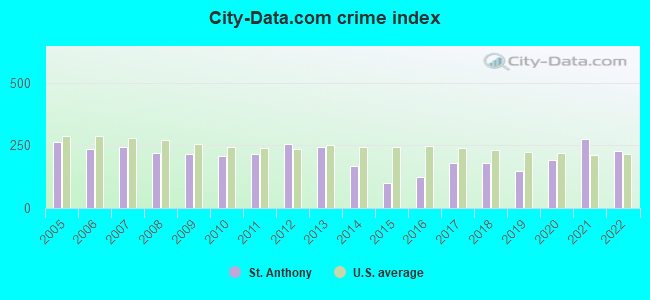
Crime rate in St. Anthony detailed stats: murders, rapes, robberies, assaults, burglaries, thefts, arson
Full-time law enforcement employees in 2021, including police officers: 23 (20 officers - 19 male; 1 female).
| Officers per 1,000 residents here: | 1.74 |
| Minnesota average: | 1.76 |
 Recent articles from our blog. Our writers, many of them Ph.D. graduates or candidates, create easy-to-read articles on a wide variety of topics.

 | Moving to the Twin Cities for a job at UMN - need rental advice (103 replies) |
| Twin Cities Recommendations (15 replies) |
| St. Anthony, MN (7 replies) |
| How’s the neighborhood by the State Fair? (10 replies) |
| Northloop, St Anthony Main or Downtown East? (0 replies) |
| What's the obsession with living in the cities? (40 replies) |
Latest news from St. Anthony, MN collected exclusively by city-data.com from local newspapers, TV, and radio stations
St. Anthony, MN City Guides:
Ancestries: German (12.2%), Kenyan (11.8%), English (7.9%), Norwegian (6.9%), Swedish (6.6%), Irish (4.5%).
Current Local Time: CST time zone
Elevation: 920 feet
Land area: 2.28 square miles.
Population density: 4,440 people per square mile (average).
1,257 residents are foreign born (6.0% Africa, 5.0% Asia).
| This city: | 13.6% |
| Minnesota: | 8.5% |
Median real estate property taxes paid for housing units with mortgages in 2022: $5,376 (1.4%)
Median real estate property taxes paid for housing units with no mortgage in 2022: $5,666 (1.6%)
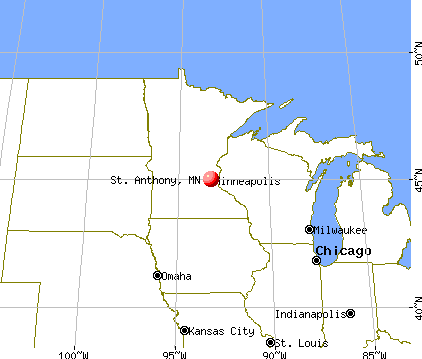
Nearest city with pop. 50,000+: Minneapolis, MN  (5.0 miles , pop. 382,618).
Nearest city with pop. 1,000,000+: Chicago, IL (354.9 miles , pop. 2,896,016).
Nearest cities:
), ), ), Latitude: 45.03 N, Longitude: 93.22 W
Daytime population change due to commuting: -197 (-2.1%)
Workers who live and work in this city: 1,416 (31.4%)
St. Anthony, Minnesota accommodation & food services, waste management - Economy and Business Data
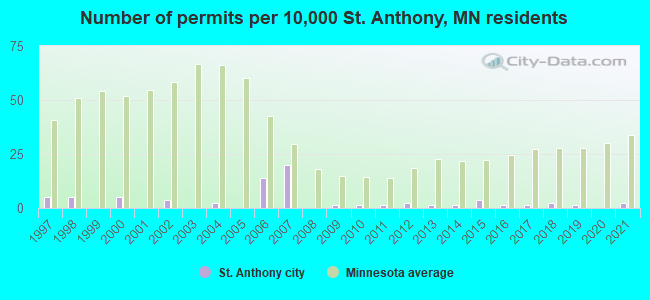
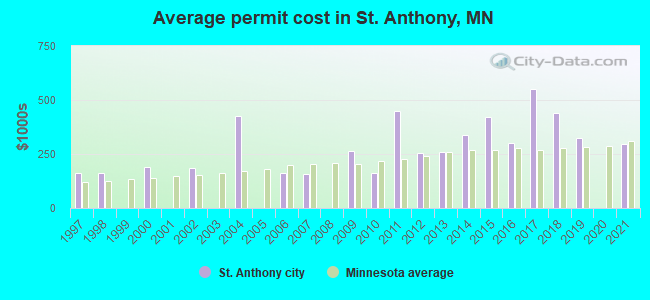
Single-family new house construction building permits:
- 2021: 2 buildings, average cost: $294,900
- 2019: 1 building, cost: $325,000
- 2018: 2 buildings, average cost: $437,500
- 2017: 1 building, cost: $550,000
- 2016: 1 building, cost: $299,900
- 2015: 3 buildings, average cost: $421,700
- 2014: 1 building, cost: $340,000
- 2013: 1 building, cost: $260,000
- 2012: 2 buildings, average cost: $255,000
- 2011: 1 building, cost: $450,000
- 2010: 1 building, cost: $160,000
- 2009: 1 building, cost: $265,000
- 2007: 16 buildings, average cost: $157,500
- 2006: 11 buildings, average cost: $160,000
- 2004: 2 buildings, average cost: $425,000
- 2002: 3 buildings, average cost: $185,700
- 2000: 4 buildings, average cost: $191,500
- 1998: 4 buildings, average cost: $163,000
- 1997: 4 buildings, average cost: $160,000
| Here: | 2.2% |
| Minnesota: | 2.6% |
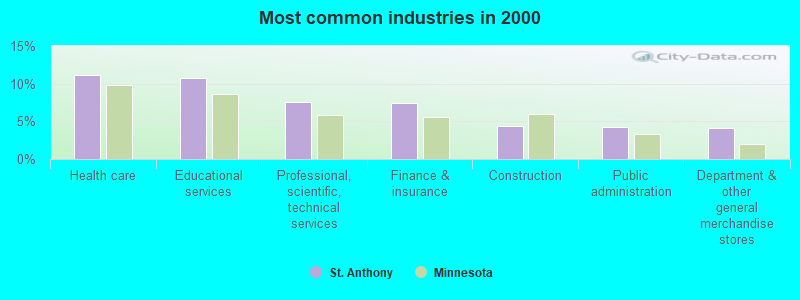
- Health care (11.1%)
- Educational services (10.8%)
- Professional, scientific, technical services (7.6%)
- Finance & insurance (7.5%)
- Construction (4.4%)
- Public administration (4.3%)
- Department & other general merchandise stores (4.2%)
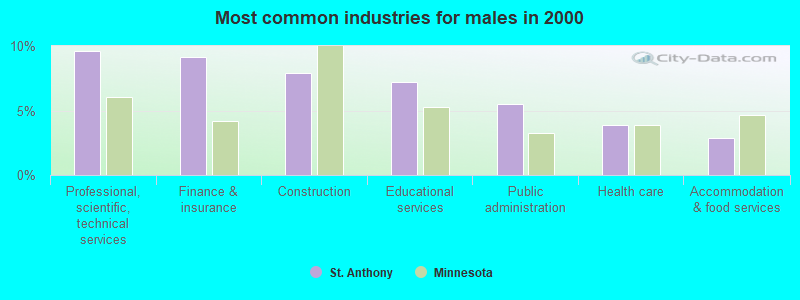
- Professional, scientific, technical services (9.6%)
- Finance & insurance (9.1%)
- Construction (7.9%)
- Educational services (7.2%)
- Public administration (5.5%)
- Health care (3.9%)
- Accommodation & food services (2.9%)
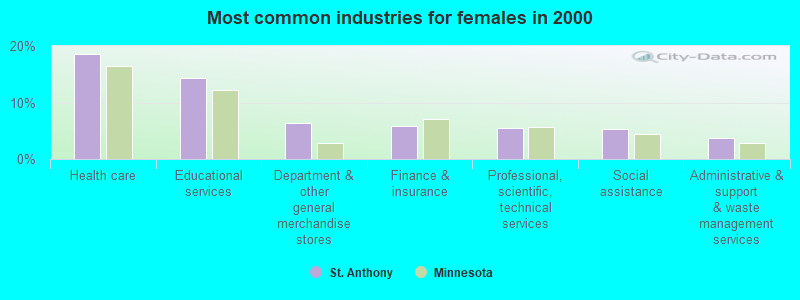
- Health care (18.6%)
- Educational services (14.4%)
- Department & other general merchandise stores (6.4%)
- Finance & insurance (5.8%)
- Professional, scientific, technical services (5.5%)
- Social assistance (5.3%)
- Administrative & support & waste management services (3.7%)

- Computer specialists (5.9%)
- Retail sales workers, except cashiers (4.8%)
- Other office and administrative support workers, including supervisors (4.6%)
- Secretaries and administrative assistants (4.6%)
- Other sales and related occupations, including supervisors (3.7%)
- Other management occupations, except farmers and farm managers (3.5%)
- Preschool, kindergarten, elementary, and middle school teachers (3.4%)

- Computer specialists (9.0%)
- Other management occupations, except farmers and farm managers (4.7%)
- Other sales and related occupations, including supervisors (4.7%)
- Electrical equipment mechanics and other installation, maintenance, and repair workers, including supervisors (4.4%)
- Retail sales workers, except cashiers (4.3%)
- Engineers (3.6%)
- Accountants and auditors (3.6%)

- Secretaries and administrative assistants (9.3%)
- Other office and administrative support workers, including supervisors (7.1%)
- Preschool, kindergarten, elementary, and middle school teachers (5.7%)
- Retail sales workers, except cashiers (5.4%)
- Registered nurses (4.9%)
- Information and record clerks, except customer service representatives (3.5%)
- Bookkeeping, accounting, and auditing clerks (3.4%)
Average climate in St. Anthony, Minnesota
Based on data reported by over 4,000 weather stations


|
|


(lower is better)
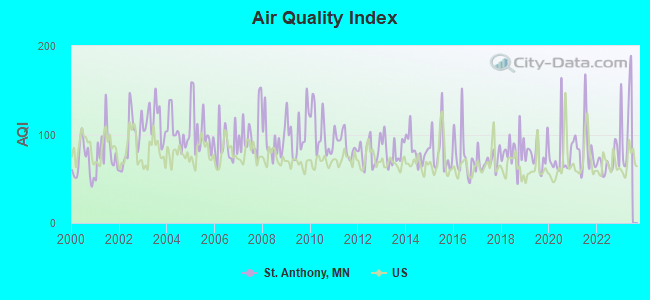
Air Quality Index (AQI) level in 2022 was 68.4. This is about average.
| City: | 68.4 |
| U.S.: | 72.6 |
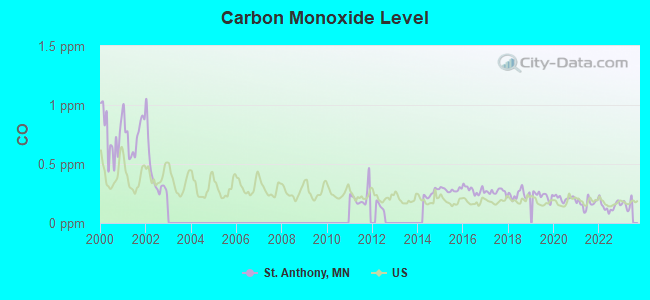
Carbon Monoxide (CO) [ppm] level in 2022 was 0.144. This is significantly better than average. Closest monitor was 2.0 miles away from the city center.
| City: | 0.144 |
| U.S.: | 0.251 |
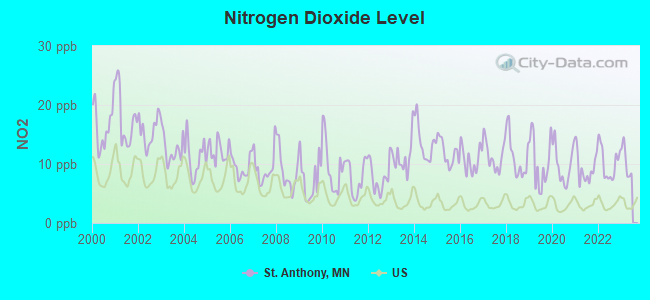
Nitrogen Dioxide (NO2) [ppb] level in 2022 was 10.2. This is significantly worse than average. Closest monitor was 3.0 miles away from the city center.
| City: | 10.2 |
| U.S.: | 5.1 |
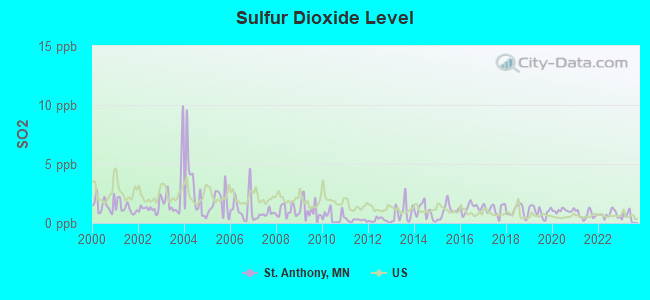
Sulfur Dioxide (SO2) [ppb] level in 2022 was 0.740. This is significantly better than average. Closest monitor was 1.1 miles away from the city center.
| City: | 0.740 |
| U.S.: | 1.515 |
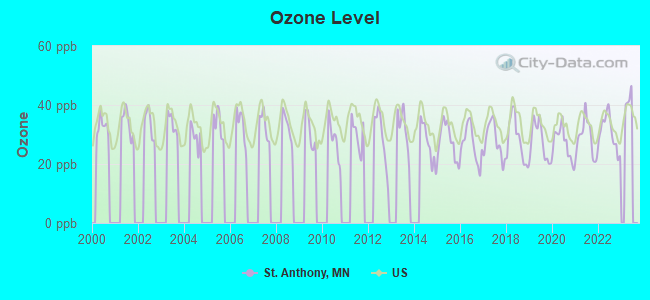
Ozone [ppb] level in 2022 was 30.7. This is about average. Closest monitor was 2.0 miles away from the city center.
| City: | 30.7 |
| U.S.: | 33.3 |
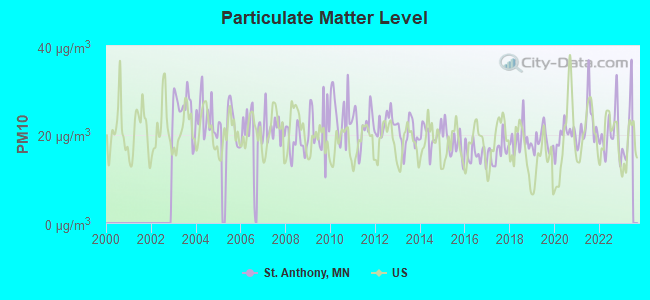
Particulate Matter (PM10) [µg/m3] level in 2022 was 20.1. This is about average. Closest monitor was 2.0 miles away from the city center.
| City: | 20.1 |
| U.S.: | 19.2 |
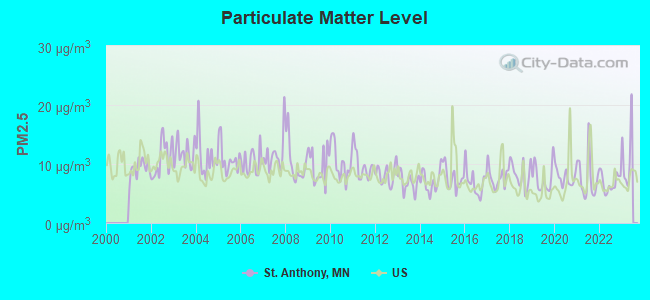
Particulate Matter (PM2.5) [µg/m3] level in 2022 was 6.85. This is about average. Closest monitor was 1.9 miles away from the city center.
| City: | 6.85 |
| U.S.: | 8.11 |
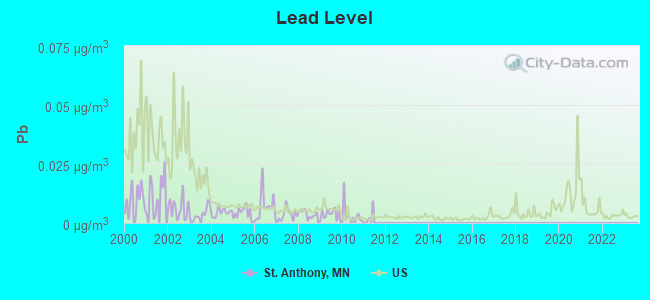
Lead (Pb) [µg/m3] level in 2010 was 0.00294. This is significantly better than average. Closest monitor was 1.1 miles away from the city center.
| City: | 0.00294 |
| U.S.: | 0.00931 |
Tornado activity:
St. Anthony-area historical tornado activity is slightly above Minnesota state average. It is 28% greater than the overall U.S. average.
On 5/6/1965, a category F4 (max. wind speeds 207-260 mph) tornado 2.9 miles away from the St. Anthony city center killed 3 people and injured 175 people and caused between $5,000,000 and $50,000,000 in damages.
On 5/6/1965, a category F4 tornado 8.5 miles away from the city center killed 6 people and injured 158 people and caused between $5,000,000 and $50,000,000 in damages.
Earthquake activity:
St. Anthony-area historical earthquake activity is significantly above Minnesota state average. It is 56% smaller than the overall U.S. average.On 7/9/1975 at 14:54:15, a magnitude 4.6 (4.6 MB, Class: Light, Intensity: IV - V) earthquake occurred 144.1 miles away from the city center
On 6/5/1993 at 01:24:53, a magnitude 4.1 (4.1 LG, Depth: 6.2 mi) earthquake occurred 155.9 miles away from St. Anthony center
On 3/4/1983 at 06:32:18, a magnitude 4.6 (4.4 MB, 4.6 LG, 4.4 ML) earthquake occurred 309.8 miles away from St. Anthony center
On 10/20/1995 at 15:57:18, a magnitude 3.7 (3.7 LG, Depth: 3.1 mi, Class: Light, Intensity: II - III) earthquake occurred 184.6 miles away from St. Anthony center
On 2/9/1994 at 08:45:35, a magnitude 3.1 (3.1 LG, Depth: 3.1 mi) earthquake occurred 87.1 miles away from St. Anthony center
On 11/3/2002 at 20:41:56, a magnitude 4.3 (4.3 MB, Depth: 3.1 mi) earthquake occurred 323.1 miles away from the city center
Magnitude types: regional Lg-wave magnitude (LG), body-wave magnitude (MB), local magnitude (ML)
Natural disasters:
The number of natural disasters in Hennepin County (17) is near the US average (15).Major Disasters (Presidential) Declared: 12
Emergencies Declared: 4
Causes of natural disasters: Floods: 11, Storms: 8, Tornadoes: 4, Winds: 3, Drought: 1, Hurricane: 1, Landslide: 1, Mudslide: 1, Other: 2 (Note: some incidents may be assigned to more than one category).

Hospitals and medical centers near St. Anthony:
- ST ANTHONY HEALTH CENTER (Nursing Home, about 1 miles away; ST ANTHONY, MN)
- ACR HOME ON LYDIA WEST (Hospital, about 1 miles away; ROSEVILLE, MN)
- BYWOOD EAST HEALTH CARE (Nursing Home, about 2 miles away; MINNEAPOLIS, MN)
- BETHANY CARE CENTER (Nursing Home, about 2 miles away; MINNEAPOLIS, MN)
- HEARTLAND HOME HC AND HOSPICE (Home Health Center, about 2 miles away; ROSEVILLE, MN)
- ALL HOMECARING (Home Health Center, about 2 miles away; MINNEAPOLIS, MN)
- NORTHEAST HOUSE INC (Hospital, about 2 miles away; MINNEAPOLIS, MN)
Amtrak station near St. Anthony:
Colleges/universities with over 2000 students nearest to St. Anthony:
- University of Northwestern-St Paul (about 3 miles; Saint Paul, MN; Full-time enrollment: 2,680)
- University of Minnesota-Twin Cities (about 4 miles; Minneapolis, MN; FT enrollment: 43,506)
- Bethel University (about 4 miles; Saint Paul, MN; FT enrollment: 4,061)
- Walden University (about 4 miles; Minneapolis, MN; FT enrollment: 62,473)
- Capella University (about 5 miles; Minneapolis, MN; FT enrollment: 21,718)
- Augsburg College (about 5 miles; Minneapolis, MN; FT enrollment: 2,954)
- Minneapolis Community and Technical College (about 5 miles; Minneapolis, MN; FT enrollment: 6,726)
Public high schools in St. Anthony:
- ST. ANTHONY VILLAGE SENIOR HIGH (Location: 3303 33RD AVE NE, Grades: 9-12)
- ST. ANTHONY VILLAGE ALTERNATIVE (Location: 3303 33RD AVE NE, Grades: 9-12)
Public elementary/middle schools in St. Anthony:
- WILSHIRE PARK ELEMENTARY (Location: 3600 HIGHCREST RD NE, Grades: PK-5)
- ST. ANTHONY MIDDLE (Location: 3303 33RD AVE NE, Grades: 6-8)
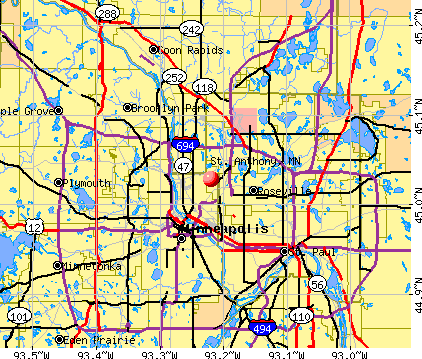
Points of interest:
Notable locations in St. Anthony: Fresh Air Camp (A), Gross Golf Course (B), Saint Anthony Village Fire Department (C), Saint Anthony City Hall (D). Display/hide their locations on the map
Shopping Center: Saint Anthony Shopping Center (1). Display/hide its location on the map
Churches in St. Anthony include: Faith United Methodist Church (A), Elmwood Evangelical Free Church (B), Saint Anthony Church (C). Display/hide their locations on the map
Cemeteries: Saint Marys Cemetery (1), Sunset Memorial Park Cemetery (2). Display/hide their locations on the map
Lake: Silver Lake (A). Display/hide its location on the map
Parks in St. Anthony include: Emerald Park (1), Trillum Park (2), Silver Point Park (3), Central School Park (4). Display/hide their locations on the map
Drinking water stations with addresses in St. Anthony and their reported violations in the past:
CLEARWATER FOREST MOBILE HOME PARK (Population served: 367, Groundwater):Past monitoring violations:
- Follow-up Or Routine LCR Tap M/R - In OCT-01-2012, Contaminant: Lead and Copper Rule. Follow-up actions: St Violation/Reminder Notice (2 times from SEP-11-2012 to SEP-26-2012), St Public Notif requested (NOV-09-2012), St Formal NOV issued (NOV-09-2012), St Violation/Reminder Notice (2 times from DEC-05-2012 to DEC-19-2012), St Public Notif received (DEC-20-2012), St Compliance achieved (JUN-19-2013)
- Monitoring and Reporting (DBP) - Between OCT-2008 and DEC-2008, Contaminant: Chlorine. Follow-up actions: St Formal NOV issued (JAN-13-2009), St Public Notif requested (JAN-13-2009), St Compliance achieved (JAN-21-2009), St Public Notif received (JAN-23-2009)
- Monitoring and Reporting (DBP) - Between JUL-2008 and SEP-2008, Contaminant: Chlorine. Follow-up actions: St Public Notif requested (OCT-16-2008), St Formal NOV issued (OCT-16-2008), St Public Notif received (DEC-31-2008), St Compliance achieved (JAN-21-2009)
- Follow-up Or Routine LCR Tap M/R - In OCT-01-2005, Contaminant: Lead and Copper Rule. Follow-up actions: St Violation/Reminder Notice (2 times from SEP-01-2005 to SEP-20-2005), St Public Notif requested (NOV-01-2005), St Formal NOV issued (NOV-01-2005), St Public Notif received (NOV-28-2005), St Violation/Reminder Notice (NOV-30-2005), St Compliance achieved (JUN-22-2006)
- 5 routine major monitoring violations
| This city: | 2.1 people |
| Minnesota: | 2.5 people |
| This city: | 53.4% |
| Whole state: | 64.6% |
| This city: | 4.7% |
| Whole state: | 6.9% |
Likely homosexual households (counted as self-reported same-sex unmarried-partner households)
- Lesbian couples: 0.3% of all households
- Gay men: 0.1% of all households
15 people in group homes intended for adults in 2010
People in group quarters in St. Anthony in 2000:
- 167 people in nursing homes
- 24 people in homes for the mentally retarded
- 4 people in homes for the mentally ill
Banks with branches in St. Anthony (2011 data):
- TCF National Bank: Apache Branch at 3899 Silver Lake Road, branch established on 1923/01/01; Silver Lake Cub Branch at 3930 Silver Lake Road, branch established on 1997/04/04. Info updated 2009/11/23: Bank assets: $19,007.0 mil, Deposits: $12,377.0 mil, headquarters in Sioux Falls, SD, positive income, Commercial Lending Specialization, 441 total offices, Holding Company: Tcf Financial Corporation
- Bremer Bank, National Association: St. Anthony Branch at 2401 Lowry Avenue, Northeast, branch established on 1957/12/10. Info updated 2006/11/03: Bank assets: $2,725.5 mil, Deposits: $2,268.8 mil, headquarters in South St. Paul, MN, positive income, Commercial Lending Specialization, 29 total offices, Holding Company: Otto Bremer Foundation
For population 15 years and over in St. Anthony:
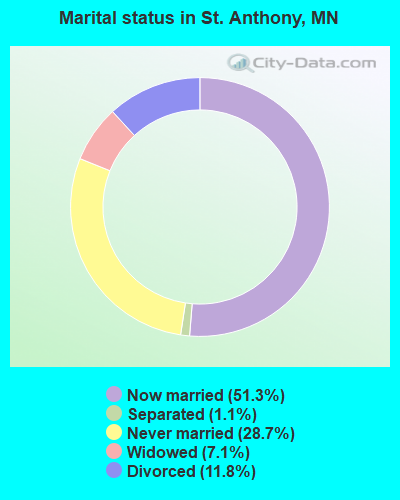
- Never married: 28.7%
- Now married: 51.3%
- Separated: 1.1%
- Widowed: 7.1%
- Divorced: 11.8%
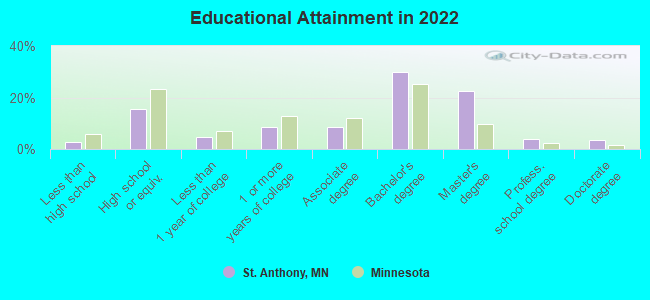
For population 25 years and over in St. Anthony:
- High school or higher: 97.3%
- Bachelor's degree or higher: 59.0%
- Graduate or professional degree: 29.5%
- Unemployed: 2.2%
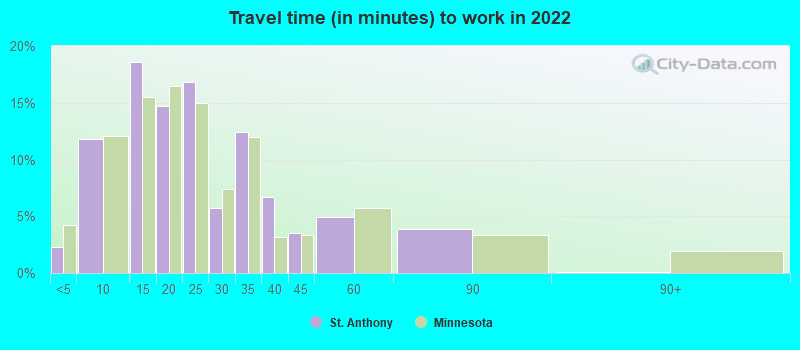
- Mean travel time to work (commute): 14.4 minutes
| Here: | 10.4 |
| Minnesota average: | 10.9 |
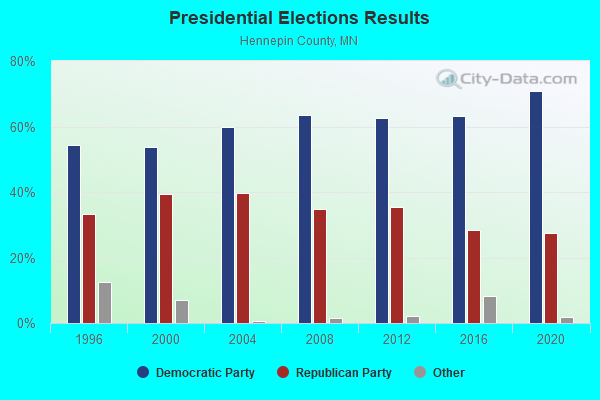
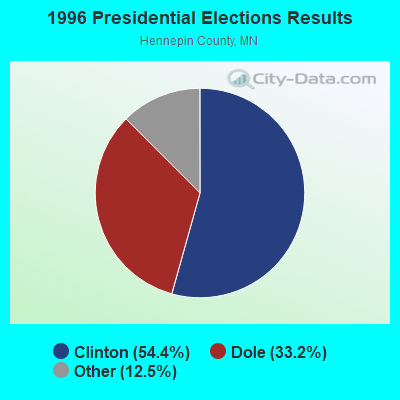
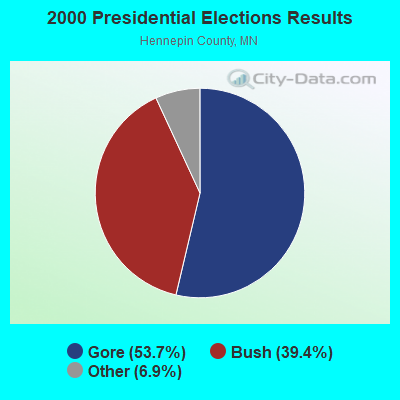
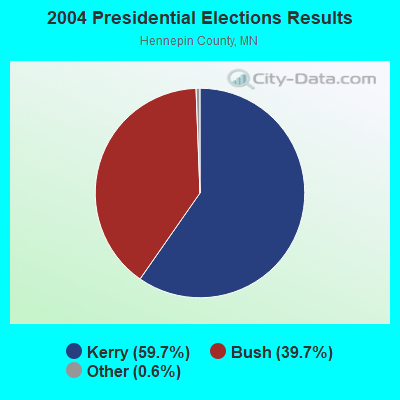
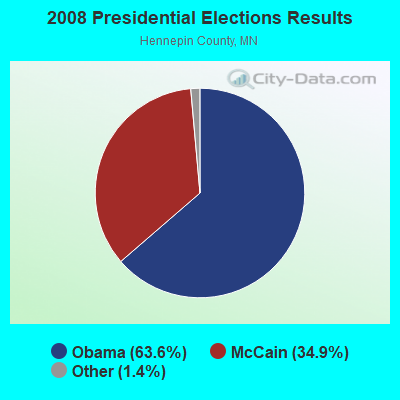
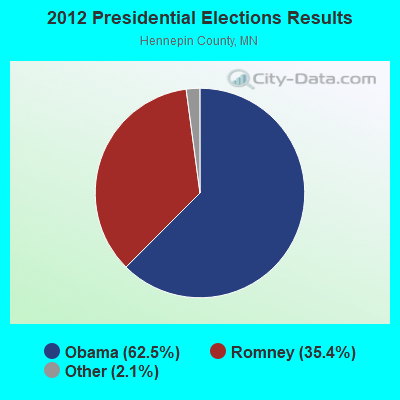
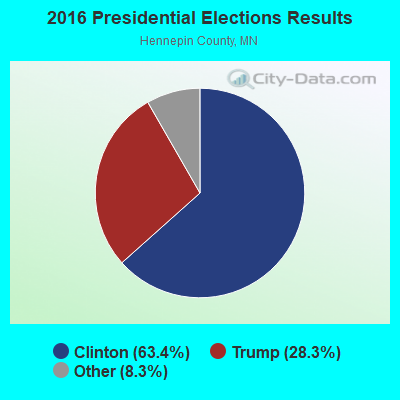
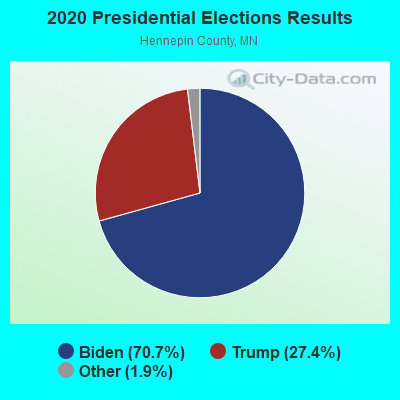
Graphs represent county-level data. Detailed 2008 Election Results
Religion statistics for St. Anthony, MN (based on Hennepin County data)
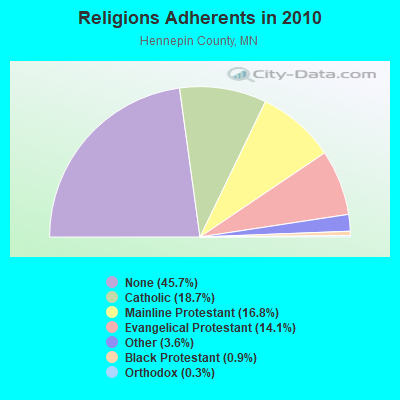
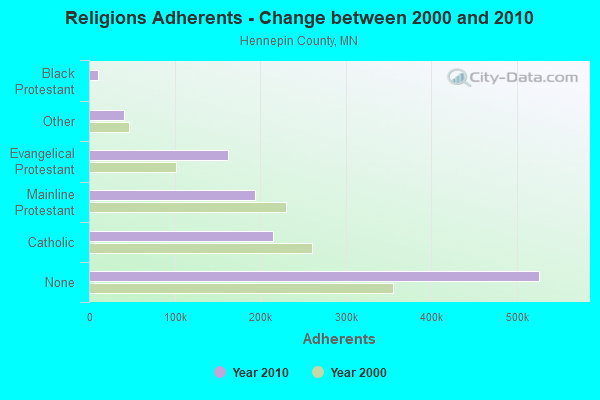
| Religion | Adherents | Congregations |
|---|---|---|
| Catholic | 215,205 | 74 |
| Mainline Protestant | 193,498 | 234 |
| Evangelical Protestant | 162,094 | 393 |
| Other | 41,287 | 110 |
| Black Protestant | 10,812 | 21 |
| Orthodox | 3,337 | 6 |
| None | 526,192 | - |
Food Environment Statistics:
| Hennepin County: | 1.79 / 10,000 pop. |
| Minnesota: | 1.83 / 10,000 pop. |
| Hennepin County: | 0.12 / 10,000 pop. |
| Minnesota: | 0.13 / 10,000 pop. |
| Hennepin County: | 0.69 / 10,000 pop. |
| Minnesota: | 0.49 / 10,000 pop. |
| Here: | 2.50 / 10,000 pop. |
| Minnesota: | 3.90 / 10,000 pop. |
| This county: | 7.13 / 10,000 pop. |
| State: | 6.98 / 10,000 pop. |
| Hennepin County: | 5.8% |
| Minnesota: | 6.5% |
| Hennepin County: | 22.8% |
| Minnesota: | 25.9% |
| This county: | 15.2% |
| Minnesota: | 13.0% |
Health and Nutrition:
| St. Anthony: | 52.2% |
| State: | 50.6% |
| This city: | 48.9% |
| State: | 48.4% |
| St. Anthony: | 28.5 |
| Minnesota: | 28.5 |
| This city: | 20.2% |
| State: | 21.0% |
| This city: | 13.2% |
| Minnesota: | 9.8% |
| Here: | 6.9 |
| Minnesota: | 6.8 |
| Here: | 33.6% |
| State: | 33.5% |
| St. Anthony: | 57.1% |
| State: | 57.7% |
| This city: | 76.7% |
| Minnesota: | 79.3% |
More about Health and Nutrition of St. Anthony, MN Residents
St. Anthony government finances - Expenditure in 2018 (per resident):
- Construction - Regular Highways: $9,752,000 ($963.26)
Water Utilities: $5,635,000 ($556.60)
Housing and Community Development: $650,000 ($64.20)
General Public Buildings: $108,000 ($10.67)
Sewerage: $53,000 ($5.24)
- Current Operations - Liquor Stores: $5,564,000 ($549.59)
Police Protection: $4,254,000 ($420.19)
General - Other: $2,741,000 ($270.74)
Regular Highways: $1,234,000 ($121.89)
Water Utilities: $1,158,000 ($114.38)
Sewerage: $1,134,000 ($112.01)
Local Fire Protection: $1,092,000 ($107.86)
Financial Administration: $468,000 ($46.23)
Parks and Recreation: $452,000 ($44.65)
Protective Inspection and Regulation - Other: $153,000 ($15.11)
Housing and Community Development: $131,000 ($12.94)
General Public Buildings: $115,000 ($11.36)
Judicial and Legal Services: $87,000 ($8.59)
Central Staff Services: $83,000 ($8.20)
Solid Waste Management: $65,000 ($6.42)
- General - Interest on Debt: $972,000 ($96.01)
- Intergovernmental to Local - Other - Sewerage: $643,000 ($63.51)
Other - Police Protection: $66,000 ($6.52)
Other - Financial Administration: $58,000 ($5.73)
Other - Parks and Recreation: $52,000 ($5.14)
Other - Central Staff Services: $49,000 ($4.84)
Other - Local Fire Protection: $26,000 ($2.57)
Other - General - Other: $26,000 ($2.57)
Other - Water Utilities: $21,000 ($2.07)
Other - Housing and Community Development: $10,000 ($0.99)
- Other Capital Outlay - Regular Highways: $917,000 ($90.58)
General - Other: $156,000 ($15.41)
Local Fire Protection: $108,000 ($10.67)
General Public Building: $73,000 ($7.21)
Parks and Recreation: $52,000 ($5.14)
Central Staff Services: $15,000 ($1.48)
Police Protection: $3,000 ($0.30)
- Total Salaries and Wages: $5,008,000 ($494.67)
- Water Utilities - Interest on Debt: $8,000 ($0.79)
St. Anthony government finances - Revenue in 2018 (per resident):
- Charges - Other: $1,601,000 ($158.14)
Sewerage: $1,119,000 ($110.53)
Regular Highways: $153,000 ($15.11)
Parks and Recreation: $128,000 ($12.64)
Solid Waste Management: $4,000 ($0.40)
- Federal Intergovernmental - Highways: $877,000 ($86.63)
Other: $6,000 ($0.59)
- Local Intergovernmental - Highways: $570,000 ($56.30)
Other: $122,000 ($12.05)
Water Utilities: $10,000 ($0.99)
- Miscellaneous - Special Assessments: $589,000 ($58.18)
General Revenue - Other: $510,000 ($50.38)
Interest Earnings: $234,000 ($23.11)
Rents: $187,000 ($18.47)
Donations From Private Sources: $102,000 ($10.08)
Fines and Forfeits: $76,000 ($7.51)
Sale of Property: $28,000 ($2.77)
- Revenue - Liquor Stores: $5,921,000 ($584.85)
Water Utilities: $823,000 ($81.29)
- State Intergovernmental - General Local Government Support: $528,000 ($52.15)
Other: $304,000 ($30.03)
Highways: $89,000 ($8.79)
- Tax - Property: $6,633,000 ($655.18)
Other License: $358,000 ($35.36)
Occupation and Business License - Other: $313,000 ($30.92)
Public Utilities Sales: $115,000 ($11.36)
Alcoholic Beverage License: $32,000 ($3.16)
St. Anthony government finances - Debt in 2018 (per resident):
- Long Term Debt - Beginning Outstanding - Unspecified Public Purpose: $32,255,000 ($3185.99)
Outstanding Unspecified Public Purpose: $31,625,000 ($3123.77)
Beginning Outstanding - Public Debt for Private Purpose: $7,450,000 ($735.88)
Outstanding Nonguaranteed - Industrial Revenue: $7,065,000 ($697.85)
Retired Unspecified Public Purpose: $5,940,000 ($586.72)
Issue, Unspecified Public Purpose: $5,310,000 ($524.50)
Retired Nonguaranteed - Public Debt for Private Purpose: $385,000 ($38.03)
St. Anthony government finances - Cash and Securities in 2018 (per resident):
- Bond Funds - Cash and Securities: $3,934,000 ($388.58)
- Other Funds - Cash and Securities: $3,723,000 ($367.74)
- Sinking Funds - Cash and Securities: $7,065,000 ($697.85)
6.75% of this county's 2021 resident taxpayers lived in other counties in 2020 ($70,758 average adjusted gross income)
| Here: | 6.75% |
| Minnesota average: | 7.43% |
0.00% of residents moved from foreign countries ($39 average AGI)
Hennepin County: 0.00% Minnesota average: 0.00%
Top counties from which taxpayers relocated into this county between 2020 and 2021:
| from Ramsey County, MN | |
| from Anoka County, MN | |
| from Dakota County, MN |
8.44% of this county's 2020 resident taxpayers moved to other counties in 2021 ($85,733 average adjusted gross income)
| Here: | 8.44% |
| Minnesota average: | 7.79% |
0.01% of residents moved to foreign countries ($68 average AGI)
Hennepin County: 0.01% Minnesota average: 0.00%
Top counties to which taxpayers relocated from this county between 2020 and 2021:
| to Ramsey County, MN | |
| to Anoka County, MN | |
| to Dakota County, MN |
Businesses in St. Anthony, MN
- Caribou Coffee: 1
- Cold Stone Creamery: 1
- GNC: 1
Strongest AM radio stations in St. Anthony:
- KUOM (770 AM; daytime; 5 kW; MINNEAPOLIS, MN)
- KSTP (1500 AM; 50 kW; ST. PAUL, MN; Owner: KSTP-AM, LLC (DELAWARE))
- WCCO (830 AM; 50 kW; MINNEAPOLIS, MN; Owner: INFINITY MEDIA CORPORATION)
- KTIS (900 AM; 25 kW; MINNEAPOLIS, MN; Owner: NORTHWESTERN COLLEGE)
- WCTS (1030 AM; 50 kW; MAPLEWOOD, MN; Owner: CNTL. BAPT. THEO/AL SEMI MINNEAPOLIS)
- KDIZ (1440 AM; 5 kW; GOLDEN VALLEY, MN; Owner: KQRS, INC.)
- WWTC (1280 AM; 5 kW; MINNEAPOLIS, MN; Owner: SCA LICENSE CORPORATION)
- KFAN (1130 AM; 50 kW; MINNEAPOLIS, MN; Owner: AMFM RADIO LICENSES, L.L.C.)
- KLBP (1470 AM; 5 kW; BROOKLYN PARK, MN; Owner: 1400, INC.)
- KYCR (1570 AM; 4 kW; GOLDEN VALLEY, MN; Owner: COMMON GROUND BROADCASTING COMPANY,)
- KLBB (1400 AM; 1 kW; ST. PAUL, MN; Owner: 1400, INC.)
- WMNN (1330 AM; 10 kW; MINNEAPOLIS, MN; Owner: MINNESOTA PUBLIC RADIO.)
- KKMS (980 AM; 5 kW; RICHFIELD, MN)
Strongest FM radio stations in St. Anthony:
- KNOW-FM (91.1 FM; MINNEAPOLIS-ST. PAUL, MN; Owner: MINNESOTA PUBLIC RADIO)
- WLTE (102.9 FM; MINNEAPOLIS, MN; Owner: INFINITY MEDIA CORPORATION)
- KSTP-FM (94.5 FM; ST. PAUL, MN; Owner: KSTP-FM, LLC, A DELAWARE LLC)
- KBEM-FM (88.5 FM; MINNEAPOLIS, MN; Owner: BD. OF EDUCATION, S.S.D. NO. 1)
- KEEY-FM (102.1 FM; ST. PAUL, MN; Owner: AMFM RADIO LICENSES, L.L.C.)
- KTIS-FM (98.5 FM; MINNEAPOLIS, MN; Owner: NORTHWESTERN COLLEGE)
- KDWB-FM (101.3 FM; RICHFIELD, MN; Owner: AMFM RADIO LICENSES, L.L.C.)
- KQRS-FM (92.5 FM; GOLDEN VALLEY, MN; Owner: KQRS, Inc.)
- KSJN (99.5 FM; MINNEAPOLIS, MN; Owner: MINNESOTA PUBLIC RADIO)
- KXXR (93.7 FM; MINNEAPOLIS, MN; Owner: KQRS, INC.)
- K214DF (90.7 FM; GOLDEN VALLEY, MN; Owner: EDUCATIONAL MEDIA FOUNDATION)
- KTCZ-FM (97.1 FM; MINNEAPOLIS, MN; Owner: AMFM RADIO LICENSES, L.L.C.)
- KFAI (90.3 FM; MINNEAPOLIS, MN; Owner: FRESH AIR, INC.)
- KQQL (107.9 FM; ANOKA, MN; Owner: AMFM RADIO LICENSES, L.L.C.)
- KNOF (95.3 FM; ST. PAUL, MN; Owner: SELBY GOSPEL BROADCASTING CORPORATION)
- WFMP (107.1 FM; COON RAPIDS, MN; Owner: WFMP-FM, LLC)
- KJZI (100.3 FM; MINNEAPOLIS, MN; Owner: AMFM RADIO LICENSES, L.L.C.)
- WXPT (104.1 FM; ST. LOUIS PARK, MN; Owner: THE AUDIO HOUSE, INC.)
- WMCN (91.7 FM; ST. PAUL, MN; Owner: MACALESTER COLLEGE)
- K294AM (106.7 FM; WEST ST. PAUL, MN; Owner: FRESH AIR, INCORPORATED)
TV broadcast stations around St. Anthony:
- KARE (Channel 11; MINNEAPOLIS, MN; Owner: MULTIMEDIA HOLDINGS CORPORATION)
- KSTP-TV (Channel 5; ST. PAUL, MN; Owner: HUBBARD BROADCASTING, INC.)
- KMSP-TV (Channel 9; MINNEAPOLIS, MN; Owner: FOX TELEVISION STATIONS, INC.)
- KTCA-TV (Channel 2; ST. PAUL, MN; Owner: TWIN CITIES PUBLIC TELEVISION, INC.)
- WCCO-TV (Channel 4; MINNEAPOLIS, MN; Owner: CBS BROADCASTING INC.)
- KSTC-TV (Channel 45; MINNEAPOLIS, MN; Owner: HUBBARD BROADCASTING, INC.)
- KTCI-TV (Channel 17; ST. PAUL, MN; Owner: TWIN CITIES PUBLIC TELEVISION, INC.)
- K07UI (Channel 7; MINNEAPOLIS, ETC., MN; Owner: WORD OF GOD FELLOWSHIP, INC.)
- KMWB (Channel 23; MINNEAPOLIS, MN; Owner: KLGT LICENSEE, LLC)
- WFTC (Channel 29; MINNEAPOLIS, MN; Owner: FOX TELEVISION STATIONS, INC.)
- K58BS (Channel 58; MINNEAPOLIS, MN; Owner: TRINITY BROADCASTING NETWORK)
- K67HG (Channel 67; MINNEAPOLIS, MN; Owner: VENTANA TELEVISION, INC.)
- K19ER (Channel 19; ST. PAUL, MN; Owner: CATHOLIC VIEWS BROADCASTS, INC.)
- W62BD (Channel 62; MINNEAPOLIS, MN; Owner: WORD OF GOD FELLOWSHIP, INC.)
- K14KH (Channel 14; MINNEAPOLIS, MN; Owner: THREE ANGELS BROADCASTING NETWORK)
- WBWX-CA (Channel 13; MINNEAPOLIS, MN; Owner: THE BOX WORLDWIDE LLC)
- KPXM (Channel 41; ST. CLOUD, MN; Owner: PAXSON MINNEAPOLIS LICENSE, INC.)
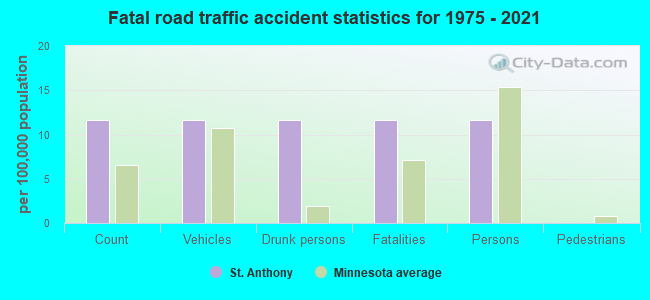
St. Anthony fatal accident list:
- National Bridge Inventory (NBI) Statistics
- 3Number of bridges
- 36ft / 10.9mTotal length
- 29,252Total average daily traffic
- 165Total average daily truck traffic
- 29,500Total future (year 2039) average daily traffic
FCC Registered Antenna Towers:
13 (See the full list of FCC Registered Antenna Towers in St. Anthony)FCC Registered Broadcast Land Mobile Towers:
1- 3704 Silver Lake Road (Lat: 45.020528 Lon: -93.217722), Call Sign: WPVA732,
Assigned Frequencies: 462.262 MHz, 461.312 MHz, 469.262 MHz, 469.862 MHz, Grant Date: 06/07/2002, Expiration Date: 06/07/2012, Cancellation Date: 08/11/2012, Certifier: Rhonda Topp, Registrant: Border Foods Inc., 12800 Industrial Park Blvd Ste 210, Minneapolis, MN 55441, Phone: (763) 489-3004, Fax: (763) 489-3005, Email:
FCC Registered Microwave Towers:
2- MSPXWJ, 3303 - 33rd Ave Ne (Lat: 45.028278 Lon: -93.214583), Type: Building, Structure height: 12.2 m, Call Sign: WQJT423,
Assigned Frequencies: 23410.0 MHz, 23410.0 MHz, Grant Date: 12/23/2008, Expiration Date: 12/23/2018, Cancellation Date: 02/23/2019, Certifier: Kurt Maass, Registrant: Telecom Transport Management, Inc., 146 N. Canal Street, Suite 210, Seattle, WA 98103, Phone: (206) 816-6907, Fax: (206) 545-9585, Email:
- MN-MSP0210A, 3301 Silver Lake Road (Lat: 45.028306 Lon: -93.216000), Type: Tank, Structure height: 24.4 m, Call Sign: WQLZ843,
Assigned Frequencies: 19575.0 MHz, 19675.0 MHz, Grant Date: 07/28/2020, Expiration Date: 06/08/2030, Cancellation Date: 09/13/2021, Certifier: Nadja S Sodos-Wallace, Registrant: T-Mobile Usa, Inc., 12920 Se 38th Street, Bellevue, WA 98006, Phone: (425) 383-8402, Fax: (425) 383-4840, Email:
FCC Registered Amateur Radio Licenses:
4- Call Sign: KC0FTF, Licensee ID: L01493492, Grant Date: 05/01/2019, Expiration Date: 05/10/2029, Certifier: Charles T Schoeneberger, Registrant: Charles T Schoeneberger, 2424 27th Ave Nw, St. Anthony, MN 55418
- Call Sign: KG4OKB, Licensee ID: L00378472, Grant Date: 07/31/2021, Expiration Date: 07/31/2031, Certifier: Peter N Dahlberg, Registrant: Peter N Dahlberg, 3612 Harding St Ne, St. Anthony, MN 55418-2549
- Call Sign: K0ANN, Previous Call Sign: N0LLC, Licensee ID: L00237852, Grant Date: 05/03/2022, Expiration Date: 06/18/2032, Certifier: L.Ann Foster, Registrant: L Ann Foster, 4085 Foss Rd. Ne, St. Anthony, MN 55421
- Call Sign: KD0DQN, Licensee ID: L01388867, Grant Date: 02/08/2018, Expiration Date: 04/10/2028, Certifier: Justin W Cooper, Registrant: Justin W Cooper, 2705 W Armour Ter, St. Anthony, MN 55418
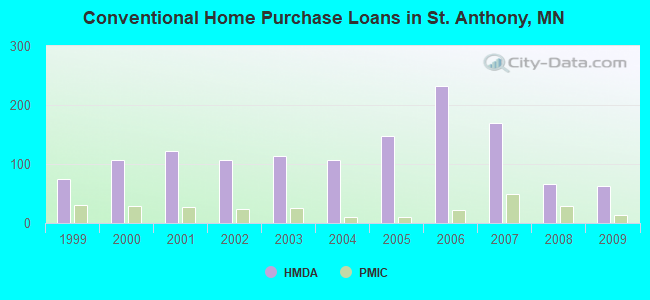
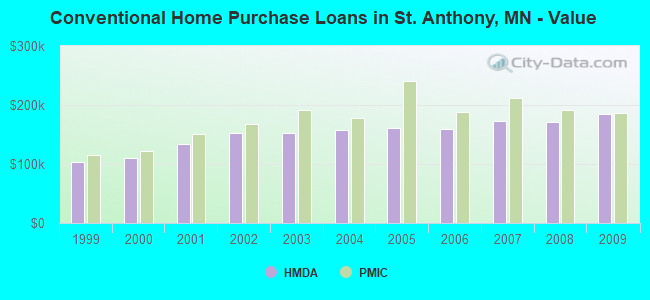
| Home Mortgage Disclosure Act Aggregated Statistics For Year 2009 (Based on 3 full tracts) | ||||||||||||
| A) FHA, FSA/RHS & VA Home Purchase Loans | B) Conventional Home Purchase Loans | C) Refinancings | D) Home Improvement Loans | F) Non-occupant Loans on < 5 Family Dwellings (A B C & D) | G) Loans On Manufactured Home Dwelling (A B C & D) | |||||||
|---|---|---|---|---|---|---|---|---|---|---|---|---|
| Number | Average Value | Number | Average Value | Number | Average Value | Number | Average Value | Number | Average Value | Number | Average Value | |
| LOANS ORIGINATED | 31 | $184,645 | 62 | $184,226 | 226 | $181,482 | 7 | $174,714 | 11 | $180,818 | 1 | $28,000 |
| APPLICATIONS APPROVED, NOT ACCEPTED | 2 | $279,000 | 0 | $0 | 20 | $178,300 | 0 | $0 | 0 | $0 | 1 | $20,000 |
| APPLICATIONS DENIED | 1 | $149,000 | 7 | $158,429 | 60 | $187,200 | 3 | $56,667 | 2 | $122,500 | 2 | $25,500 |
| APPLICATIONS WITHDRAWN | 7 | $133,286 | 5 | $137,200 | 40 | $230,200 | 0 | $0 | 1 | $100,000 | 0 | $0 |
| FILES CLOSED FOR INCOMPLETENESS | 0 | $0 | 0 | $0 | 14 | $200,500 | 0 | $0 | 0 | $0 | 0 | $0 |
Detailed HMDA statistics for the following Tracts: 0201.01 , 0201.02, 0411.03
| Private Mortgage Insurance Companies Aggregated Statistics For Year 2009 (Based on 3 full tracts) | ||||||
| A) Conventional Home Purchase Loans | B) Refinancings | C) Non-occupant Loans on < 5 Family Dwellings (A & B) | ||||
|---|---|---|---|---|---|---|
| Number | Average Value | Number | Average Value | Number | Average Value | |
| LOANS ORIGINATED | 14 | $187,000 | 3 | $213,667 | 1 | $214,000 |
| APPLICATIONS APPROVED, NOT ACCEPTED | 3 | $188,333 | 2 | $151,500 | 0 | $0 |
| APPLICATIONS DENIED | 2 | $191,000 | 0 | $0 | 1 | $214,000 |
| APPLICATIONS WITHDRAWN | 2 | $123,000 | 0 | $0 | 0 | $0 |
| FILES CLOSED FOR INCOMPLETENESS | 0 | $0 | 0 | $0 | 0 | $0 |
Detailed PMIC statistics for the following Tracts: 0201.01 , 0201.02, 0411.03
2002 - 2011 National Fire Incident Reporting System (NFIRS) incidents
- Fire incident types reported to NFIRS in St. Anthony, MN
- 14062.8%Structure Fires
- 4922.0%Outside Fires
- 2913.0%Mobile Property/Vehicle Fires
- 52.2%Other
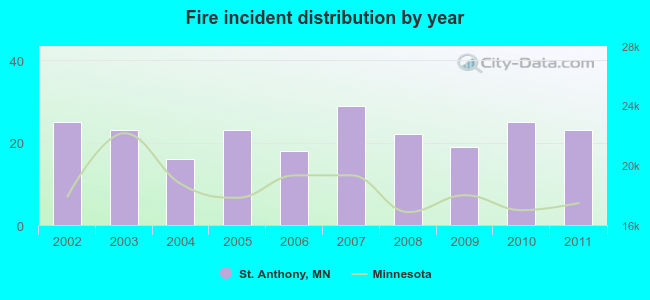 Based on the data from the years 2002 - 2011 the average number of fire incidents per year is 22. The highest number of fires - 29 took place in 2007, and the least - 16 in 2004. The data has a dropping trend.
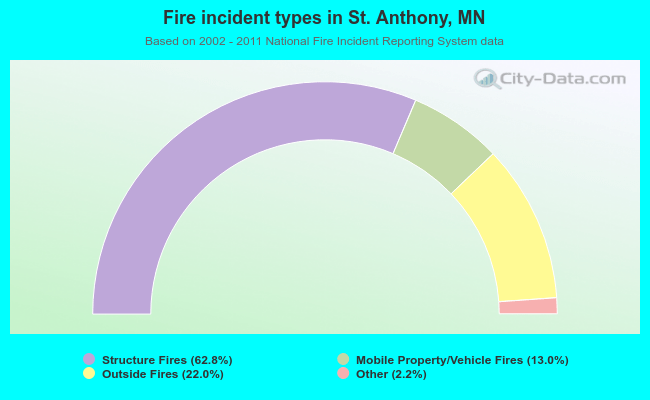 When looking into fire subcategories, the most incidents belonged to: Structure Fires (62.8%), and Outside Fires (22.0%).
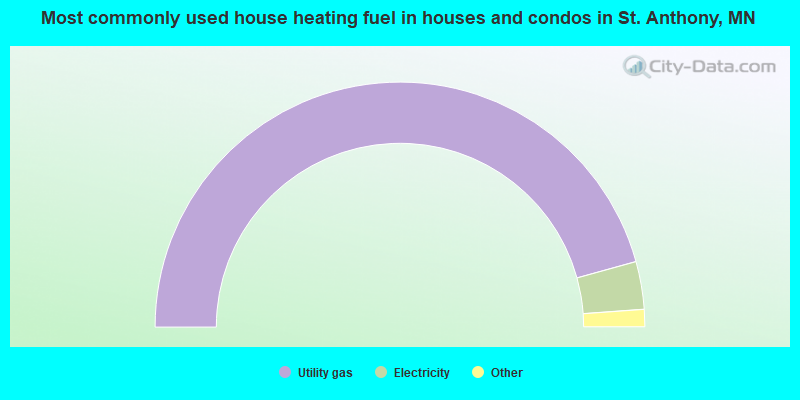
- 91.4%Utility gas
- 6.3%Electricity
- 1.3%Other fuel
- 0.8%No fuel used
- 0.1%Bottled, tank, or LP gas
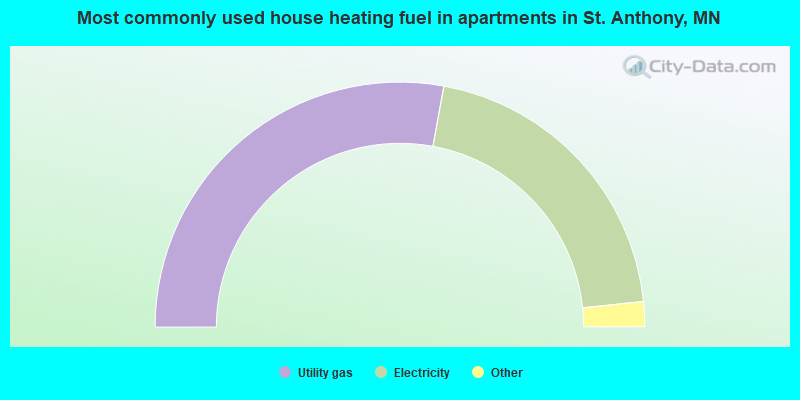
- 55.8%Utility gas
- 41.0%Electricity
- 2.2%Bottled, tank, or LP gas
- 0.7%No fuel used
- 0.2%Other fuel
St. Anthony compared to Minnesota state average:
- Unemployed percentage significantly below state average.
- Hispanic race population percentage significantly below state average.
- Foreign-born population percentage above state average.
- Length of stay since moving in significantly above state average.
- Percentage of population with a bachelor's degree or higher above state average.
St. Anthony on our top lists:
- #49 on the list of "Top 101 cities with the most residents born in Africa, n.e.c. (population 500+)"
- #4 on the list of "Top 101 counties with the most Mainline Protestant adherents"
- #7 on the list of "Top 101 counties with the highest percentage of residents that exercised in the past month"
- #10 on the list of "Top 101 counties with the most Mainline Protestant congregations"
- #15 on the list of "Top 101 counties with the highest percentage of residents that visited a dentist within the past year"
- #28 on the list of "Top 101 counties with the best general health status score of residents (1-5), 3 years of data"

|
|
Total of 191 patent applications in 2008-2024.