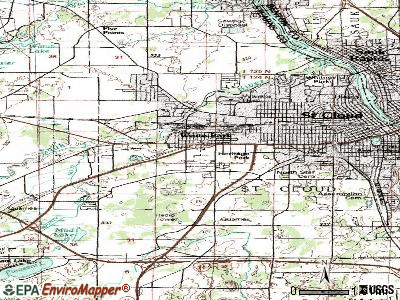
Waite Park, Minnesota
Submit your own pictures of this city and show them to the world
- OSM Map
- General Map
- Google Map
- MSN Map
Population change since 2000: +27.4%
 |
| Males: 4,014 | |
| Females: 4,352 |
| Median resident age: | 41.3 years |
| Minnesota median age: | 39.0 years |
Zip codes: 56387.
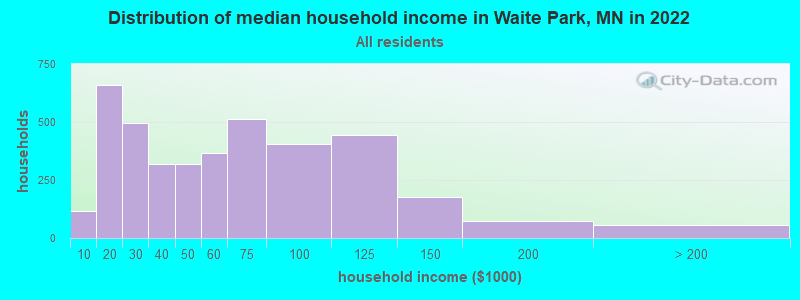
| Waite Park: | $51,513 |
| MN: | $82,338 |
Estimated per capita income in 2022: $27,341 (it was $17,796 in 2000)
Waite Park city income, earnings, and wages data
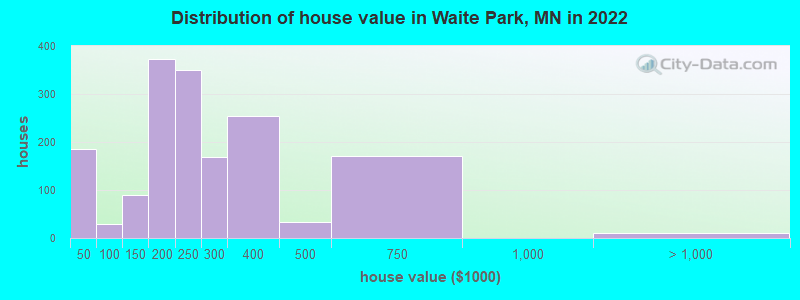
Estimated median house or condo value in 2022: $222,146 (it was $94,200 in 2000)
| Waite Park: | $222,146 |
| MN: | $314,600 |
Mean prices in 2022: all housing units: $210,982; detached houses: $245,798; townhouses or other attached units: $198,706; in 5-or-more-unit structures: $138,908; mobile homes: $13,870
Median gross rent in 2022: $1,020.
(13.1% for White Non-Hispanic residents, 44.2% for Black residents, 32.8% for Hispanic or Latino residents, 32.3% for other race residents, 65.1% for two or more races residents)
Detailed information about poverty and poor residents in Waite Park, MN
Compare current foreclosures near Waite Park, MN:
| Photo | Address | Area | Beds / Baths | Price | Details |
|---|---|---|---|---|---|

|
#1
2nd Ave N
Waite Park, MN 56387
|
1,690 sq. feet
|
1 baths 4 beds |
show details | |

|
#2
7th Ave N
Waite Park, MN 56387
|
1,940 sq. feet
|
2 baths 4 beds |
show details | |

|
#3
Sunwood Park Dr
Waite Park, MN 56387
|
1,706 sq. feet
|
2 baths 4 beds |
show details | |

|
#4
Sunwood Park Ln
Waite Park, MN 56387
|
1,998 sq. feet
|
2 baths 3 beds |
show details | |

|
#5
Sunwood Park Dr
Waite Park, MN 56387
|
1,793 sq. feet
|
2 baths 4 beds |
show details | |

|
#6
11th Ave N
Waite Park, MN 56387
|
1,397 sq. feet
|
2 baths 3 beds |
show details | |

|
#7
7th St S Apt 105c
Waite Park, MN 56387
|
- sq. feet
|
- baths - beds |
show details | |

|
#8
7th St S Apt 208b
Waite Park, MN 56387
|
- sq. feet
|
- baths - beds |
show details | |

|
#9
7th St S Apt B114
Waite Park, MN 56387
|
- sq. feet
|
- baths - beds |
show details | |

|
#10
Frontage Rd N # 104
Waite Park, MN 56387
|
- sq. feet
|
- baths - beds |
show details |
| Photo | Address | Area | Beds / Baths | Price | Details |
|---|---|---|---|---|---|

|
#11
2nd Ave S Apt 103
Waite Park, MN 56387
|
- sq. feet
|
- baths - beds |
show details | |

|
#12
Ben Nevis Ln
Waite Park, MN 56387
|
- sq. feet
|
- baths - beds |
show details | |

|
#13
7th St S Apt B113
Waite Park, MN 56387
|
- sq. feet
|
- baths - beds |
show details | |

|
#14
Saint Andrews Dr Apt 4
Waite Park, MN 56387
|
- sq. feet
|
- baths - beds |
show details | |

|
#15
2nd Ave S Apt 101
Waite Park, MN 56387
|
- sq. feet
|
- baths - beds |
show details | |

|
#16
18th Ave S
Saint Cloud, MN 56301
|
1,854 sq. feet
|
1 baths 2 beds |
$90,900
|
show details |

|
#17
4th St N
Sartell, MN 56377
|
1,616 sq. feet
|
2 baths 4 beds |
show details | |

|
#18
Peach Ct NE
Sauk Rapids, MN 56379
|
2,370 sq. feet
|
4 baths 6 beds |
show details | |

|
#19
Nw18th St
Sauk Rapids, MN 56379
|
1,534 sq. feet
|
2 baths 3 beds |
show details | |

|
#20
16th St S
Saint Cloud, MN 56301
|
1,008 sq. feet
|
2 baths 3 beds |
show details |
| Photo | Address | Area | Beds / Baths | Price | Details |
|---|---|---|---|---|---|

|
#21
County Road 1
Sartell, MN 56377
|
1,615 sq. feet
|
1 baths 2 beds |
show details | |

|
#22
Central Ave S
Saint Stephen, MN 56375
|
1,040 sq. feet
|
1 baths 3 beds |
show details | |

|
#23
Park Dr
Saint Cloud, MN 56303
|
1,280 sq. feet
|
1 baths 2 beds |
show details | |

|
#24
Fremont Ave W
Kimball, MN 55353
|
1,370 sq. feet
|
1 baths 2 beds |
show details | |

|
#25
Alder Rd
South Haven, MN 55382
|
1,056 sq. feet
|
2 baths 2 beds |
show details | |

|
#26
4th Ave N
Sartell, MN 56377
|
1,768 sq. feet
|
2 baths 4 beds |
show details | |

|
#27
24 1/2 Ave NE
Sauk Rapids, MN 56379
|
1,200 sq. feet
|
2 baths 3 beds |
show details | |

|
#28
4th Ave N
Sartell, MN 56377
|
1,405 sq. feet
|
2 baths 3 beds |
show details | |

|
#29
Summit Ave S
Sauk Rapids, MN 56379
|
900 sq. feet
|
1 baths 3 beds |
show details | |

|
#30
69th Ave
Saint Cloud, MN 56301
|
1,747 sq. feet
|
2 baths 3 beds |
show details |
| Photo | Address | Area | Beds / Baths | Price | Details |
|---|---|---|---|---|---|

|
#31
Orchid Dr NE
Sauk Rapids, MN 56379
|
1,472 sq. feet
|
3 baths 3 beds |
show details | |

|
#32
Golden Spike Rd NE
Sauk Rapids, MN 56379
|
1,308 sq. feet
|
2 baths 4 beds |
show details | |

|
#33
12th St N
Sauk Rapids, MN 56379
|
816 sq. feet
|
2 baths 3 beds |
show details | |

|
#34
5th Ave S
Sartell, MN 56377
|
1,421 sq. feet
|
2 baths 3 beds |
show details | |

|
#35
2nd Ave NE
Saint Joseph, MN 56374
|
1,454 sq. feet
|
1 baths 2 beds |
show details | |

|
#36
43rd Ave
Saint Cloud, MN 56301
|
1,867 sq. feet
|
2 baths 4 beds |
show details | |

|
#37
7th Ave N
Sartell, MN 56377
|
1,382 sq. feet
|
2 baths 3 beds |
show details | |

|
#38
16th St N
Sauk Rapids, MN 56379
|
996 sq. feet
|
2 baths 3 beds |
show details | |

|
#39
49th Ave
South Haven, MN 55382
|
806 sq. feet
|
1 baths 3 beds |
show details | |

|
#40
7th Ave SE
Saint Joseph, MN 56374
|
1,373 sq. feet
|
2 baths 3 beds |
show details |
| Photo | Address | Area | Beds / Baths | Price | Details |
|---|---|---|---|---|---|

|
#41
20th Ave N
Sartell, MN 56377
|
2,083 sq. feet
|
2 baths 4 beds |
show details | |

|
#42
65th Ave NE
Sauk Rapids, MN 56379
|
1,831 sq. feet
|
1 baths 1 beds |
show details | |

|
#43
4th St N
Sartell, MN 56377
|
1,778 sq. feet
|
2 baths 4 beds |
show details | |

|
#44
2nd Ave S
Sauk Rapids, MN 56379
|
1,042 sq. feet
|
1 baths 3 beds |
show details | |

|
#45
Broadway Ave S
Sauk Rapids, MN 56379
|
1,652 sq. feet
|
1 baths 3 beds |
show details | |

|
#46
3rd Ave S
Sauk Rapids, MN 56379
|
934 sq. feet
|
1 baths 3 beds |
show details | |

|
#47
W Birch St
Saint Joseph, MN 56374
|
1,123 sq. feet
|
1 baths 2 beds |
show details | |

|
#48
7th Ave N
Sauk Rapids, MN 56379
|
1,120 sq. feet
|
2 baths 3 beds |
show details | |

|
#49
2nd Ave S
Sauk Rapids, MN 56379
|
782 sq. feet
|
1 baths 3 beds |
show details | |

|
Check over 1 million property listings on Foreclosure.com!
|
browse all offers | |||


- 4,62255.1%White alone
- 3,16537.8%Black alone
- 6738.0%Hispanic
- 2102.5%Two or more races
- 1812.2%Asian alone
- 160.2%American Indian alone
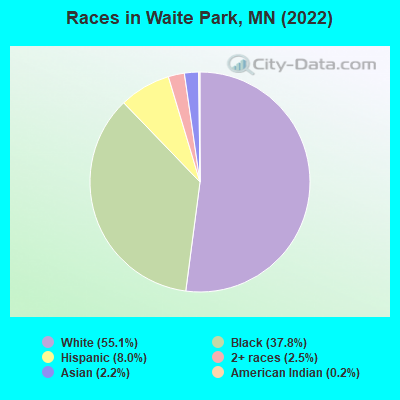
Races in Waite Park detailed stats: ancestries, foreign born residents, place of birth
Type |
2009 |
2010 |
2011 |
2012 |
2013 |
2014 |
2015 |
2016 |
2017 |
2018 |
2019 |
2020 |
2021 |
2022 |
|---|---|---|---|---|---|---|---|---|---|---|---|---|---|---|
| Murders (per 100,000) | 0 (0.0) | 0 (0.0) | 0 (0.0) | 0 (0.0) | 0 (0.0) | 0 (0.0) | 0 (0.0) | 0 (0.0) | 1 (13.4) | 0 (0.0) | 0 (0.0) | 0 (0.0) | 0 (0.0) | 0 (0.0) |
| Rapes (per 100,000) | 10 (146.9) | 5 (74.5) | 6 (88.7) | 13 (191.5) | 6 (89.8) | 5 (75.0) | 10 (133.4) | 7 (92.7) | 2 (26.8) | 2 (26.6) | 1 (12.9) | 6 (76.8) | 8 (102.1) | 6 (71.9) |
| Robberies (per 100,000) | 5 (73.4) | 7 (104.2) | 7 (103.4) | 5 (73.6) | 6 (89.8) | 4 (60.0) | 6 (80.0) | 1 (13.2) | 4 (53.7) | 4 (53.2) | 7 (90.2) | 7 (89.6) | 10 (127.6) | 1 (12.0) |
| Assaults (per 100,000) | 15 (220.3) | 13 (193.6) | 15 (221.7) | 18 (265.1) | 10 (149.6) | 10 (150.0) | 11 (146.7) | 10 (132.4) | 14 (187.8) | 23 (306.2) | 26 (334.9) | 13 (166.4) | 41 (523.0) | 36 (431.2) |
| Burglaries (per 100,000) | 28 (411.2) | 29 (431.9) | 44 (650.2) | 41 (603.8) | 44 (658.4) | 35 (524.9) | 54 (720.1) | 15 (198.6) | 34 (456.1) | 33 (439.3) | 39 (502.3) | 44 (563.2) | 38 (484.8) | 36 (431.2) |
| Thefts (per 100,000) | 525 (7,710) | 648 (9,650) | 727 (10,743) | 604 (8,895) | 666 (9,966) | 638 (9,568) | 642 (8,561) | 619 (8,198) | 543 (7,284) | 682 (9,079) | 579 (7,457) | 720 (9,217) | 659 (8,407) | 563 (6,743) |
| Auto thefts (per 100,000) | 14 (205.6) | 6 (89.4) | 16 (236.4) | 11 (162.0) | 25 (374.1) | 20 (299.9) | 13 (173.4) | 15 (198.6) | 12 (161.0) | 37 (492.5) | 26 (334.9) | 26 (332.8) | 25 (318.9) | 31 (371.3) |
| Arson (per 100,000) | 0 (0.0) | 1 (14.9) | 1 (14.8) | 0 (0.0) | 1 (15.0) | 0 (0.0) | 1 (13.3) | 0 (0.0) | 0 (0.0) | 3 (39.9) | 1 (12.9) | 1 (12.8) | 1 (12.8) | 6 (71.9) |
| City-Data.com crime index | 537.2 | 552.9 | 640.5 | 639.3 | 603.3 | 551.4 | 566.7 | 462.3 | 438.1 | 531.8 | 464.6 | 556.3 | 620.2 | 476.9 |
The City-Data.com crime index weighs serious crimes and violent crimes more heavily. Higher means more crime, U.S. average is 246.1. It adjusts for the number of visitors and daily workers commuting into cities.
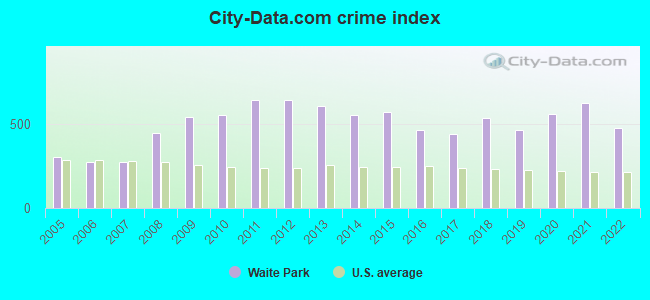
Crime rate in Waite Park detailed stats: murders, rapes, robberies, assaults, burglaries, thefts, arson
Full-time law enforcement employees in 2021, including police officers: 23 (20 officers - 16 male; 4 female).
| Officers per 1,000 residents here: | 2.55 |
| Minnesota average: | 1.76 |
 Recent articles from our blog. Our writers, many of them Ph.D. graduates or candidates, create easy-to-read articles on a wide variety of topics.

 | Columbia Heights MN (6 replies) |
| What’s Saint Cloud like? (37 replies) |
| Knife attacker in ST cloud MN mall (48 replies) |
| Where did all the Embers go? (26 replies) |
| North Minneapolis, Payne-phalen or Daytons bluff (15 replies) |
| Where to live(St Cloud area)? (5 replies) |
Latest news from Waite Park, MN collected exclusively by city-data.com from local newspapers, TV, and radio stations
Ancestries: German (22.0%), African (14.8%), Somali (10.6%), American (7.1%), Ethiopian (4.9%), Irish (4.0%).
Current Local Time: CST time zone
Elevation: 1070 feet
Land area: 7.81 square miles.
Population density: 1,071 people per square mile (low).
2,257 residents are foreign born (21.5% Africa).
| This city: | 26.9% |
| Minnesota: | 8.5% |
Median real estate property taxes paid for housing units with mortgages in 2022: $2,837 (1.3%)
Median real estate property taxes paid for housing units with no mortgage in 2022: $2,192 (1.0%)
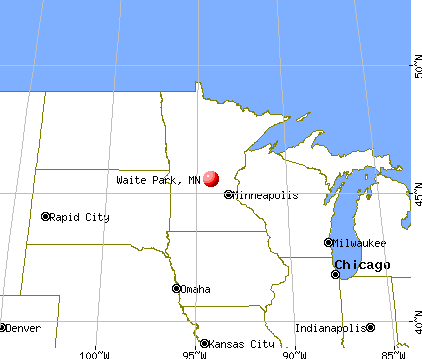
Nearest city with pop. 50,000+: St. Cloud, MN  (2.5 miles , pop. 59,107).
Nearest city with pop. 200,000+: Minneapolis, MN (61.7 miles , pop. 382,618).
Nearest city with pop. 1,000,000+: Chicago, IL (415.7 miles , pop. 2,896,016).
Nearest cities:
), ), ), ), )Latitude: 45.55 N, Longitude: 94.22 W
Daytime population change due to commuting: +4,545 (+54.2%)
Workers who live and work in this city: 790 (19.5%)
Waite Park, Minnesota accommodation & food services, waste management - Economy and Business Data
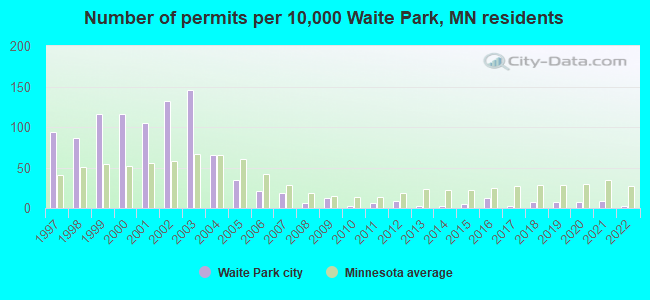
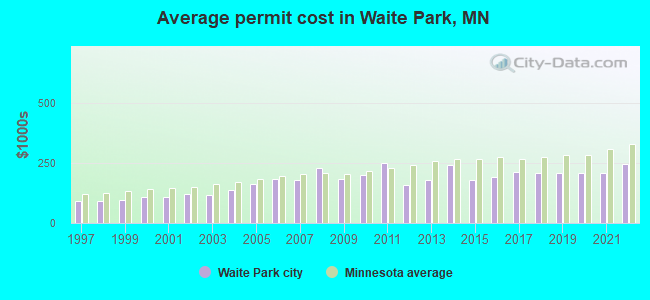
Single-family new house construction building permits:
- 2022: 2 buildings, average cost: $245,000
- 2021: 6 buildings, average cost: $208,000
- 2020: 5 buildings, average cost: $208,000
- 2019: 5 buildings, average cost: $208,000
- 2018: 5 buildings, average cost: $208,000
- 2017: 2 buildings, average cost: $215,000
- 2016: 8 buildings, average cost: $190,600
- 2015: 3 buildings, average cost: $178,300
- 2014: 2 buildings, average cost: $240,500
- 2013: 1 building, cost: $180,000
- 2012: 6 buildings, average cost: $160,000
- 2011: 4 buildings, average cost: $251,300
- 2010: 1 building, cost: $200,000
- 2009: 8 buildings, average cost: $186,100
- 2008: 4 buildings, average cost: $229,500
- 2007: 12 buildings, average cost: $178,900
- 2006: 14 buildings, average cost: $185,600
- 2005: 23 buildings, average cost: $162,700
- 2004: 43 buildings, average cost: $136,000
- 2003: 96 buildings, average cost: $118,600
- 2002: 87 buildings, average cost: $120,700
- 2001: 69 buildings, average cost: $108,200
- 2000: 76 buildings, average cost: $108,100
- 1999: 76 buildings, average cost: $96,700
- 1998: 57 buildings, average cost: $92,900
- 1997: 62 buildings, average cost: $92,600
| Here: | 2.6% |
| Minnesota: | 2.6% |
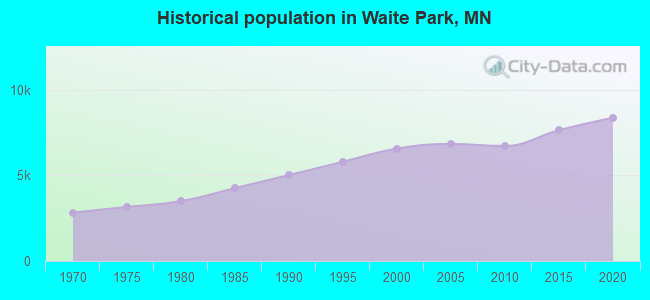
Population change in the 1990s: +1,583 (+31.8%).
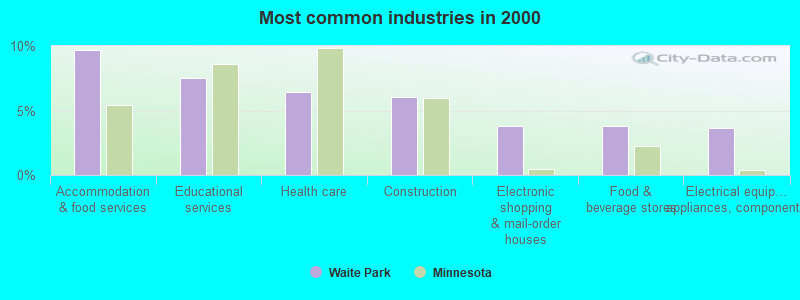
- Accommodation & food services (9.7%)
- Educational services (7.5%)
- Health care (6.4%)
- Construction (6.1%)
- Electronic shopping & mail-order houses (3.8%)
- Food & beverage stores (3.8%)
- Electrical equipment, appliances, components (3.6%)
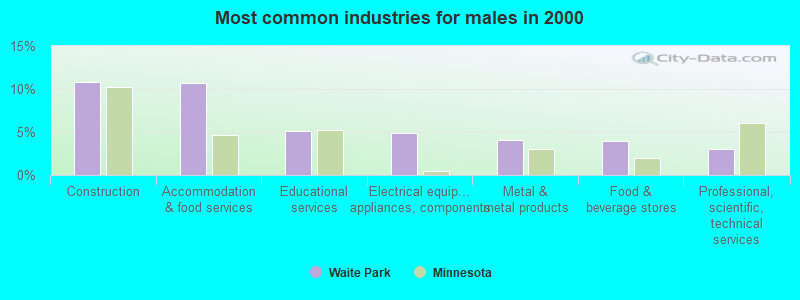
- Construction (10.8%)
- Accommodation & food services (10.7%)
- Educational services (5.1%)
- Electrical equipment, appliances, components (4.9%)
- Metal & metal products (4.1%)
- Food & beverage stores (4.0%)
- Professional, scientific, technical services (3.1%)
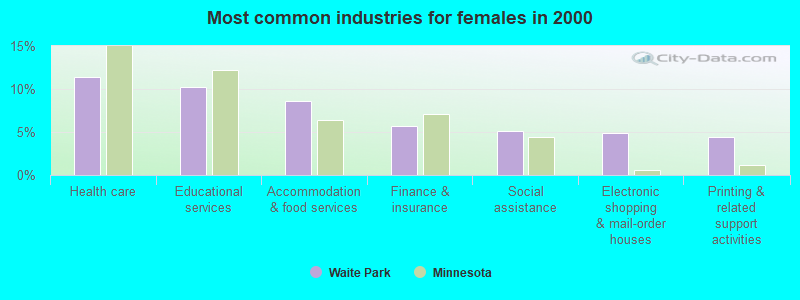
- Health care (11.4%)
- Educational services (10.3%)
- Accommodation & food services (8.6%)
- Finance & insurance (5.7%)
- Social assistance (5.1%)
- Electronic shopping & mail-order houses (4.9%)
- Printing & related support activities (4.4%)
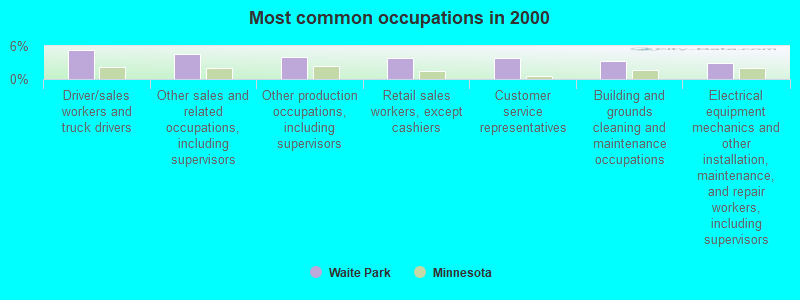
- Driver/sales workers and truck drivers (5.2%)
- Other sales and related occupations, including supervisors (4.6%)
- Other production occupations, including supervisors (4.1%)
- Retail sales workers, except cashiers (3.8%)
- Customer service representatives (3.8%)
- Building and grounds cleaning and maintenance occupations (3.3%)
- Electrical equipment mechanics and other installation, maintenance, and repair workers, including supervisors (2.9%)
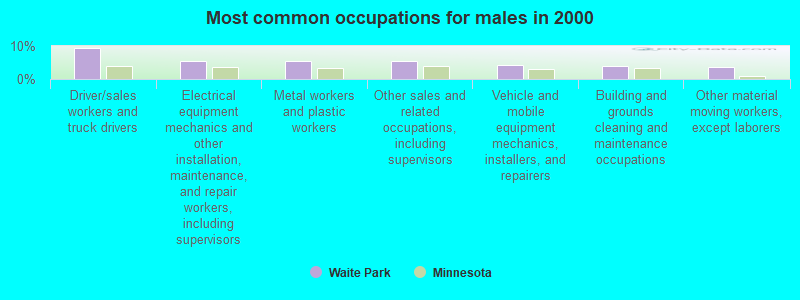
- Driver/sales workers and truck drivers (9.4%)
- Electrical equipment mechanics and other installation, maintenance, and repair workers, including supervisors (5.5%)
- Metal workers and plastic workers (5.4%)
- Other sales and related occupations, including supervisors (5.4%)
- Vehicle and mobile equipment mechanics, installers, and repairers (4.2%)
- Building and grounds cleaning and maintenance occupations (4.0%)
- Other material moving workers, except laborers (3.7%)

- Customer service representatives (5.8%)
- Retail sales workers, except cashiers (5.6%)
- Other production occupations, including supervisors (4.8%)
- Other office and administrative support workers, including supervisors (4.8%)
- Cashiers (4.4%)
- Secretaries and administrative assistants (3.8%)
- Other sales and related occupations, including supervisors (3.7%)
Average climate in Waite Park, Minnesota
Based on data reported by over 4,000 weather stations


|
|

(lower is better)
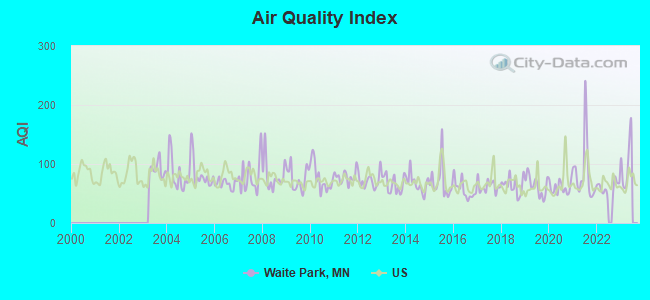
Air Quality Index (AQI) level in 2022 was 60.9. This is about average.
| City: | 60.9 |
| U.S.: | 72.6 |
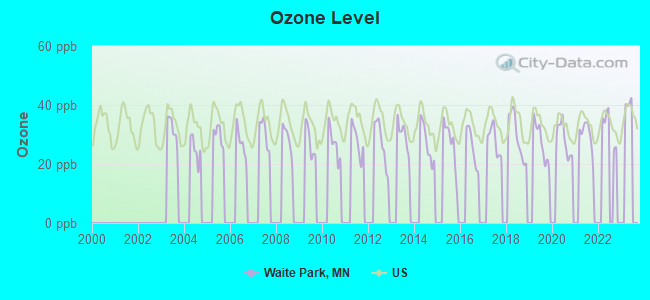
Ozone [ppb] level in 2021 was 30.0. This is about average. Closest monitor was 4.4 miles away from the city center.
| City: | 30.0 |
| U.S.: | 33.3 |
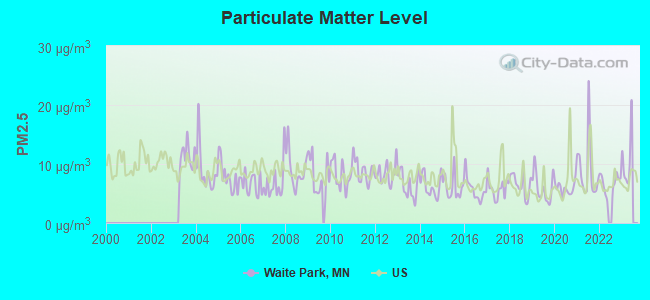
Particulate Matter (PM2.5) [µg/m3] level in 2022 was 6.72. This is better than average. Closest monitor was 4.4 miles away from the city center.
| City: | 6.72 |
| U.S.: | 8.11 |
Tornado activity:
Waite Park-area historical tornado activity is near Minnesota state average. It is 2% greater than the overall U.S. average.
On 9/3/1980, a category F3 (max. wind speeds 158-206 mph) tornado 1.4 miles away from the Waite Park city center killed one person and injured 15 people and caused between $5,000,000 and $50,000,000 in damages.
On 5/5/1964, a category F3 tornado 25.4 miles away from the city center caused between $50,000 and $500,000 in damages.
Earthquake activity:
Waite Park-area historical earthquake activity is significantly above Minnesota state average. It is 46% smaller than the overall U.S. average.On 7/9/1975 at 14:54:15, a magnitude 4.6 (4.6 MB, Class: Light, Intensity: IV - V) earthquake occurred 88.3 miles away from the city center
On 6/5/1993 at 01:24:53, a magnitude 4.1 (4.1 LG, Depth: 6.2 mi) earthquake occurred 100.5 miles away from Waite Park center
On 3/4/1983 at 06:32:18, a magnitude 4.6 (4.4 MB, 4.6 LG, 4.4 ML) earthquake occurred 270.3 miles away from the city center
On 10/20/1995 at 15:57:18, a magnitude 3.7 (3.7 LG, Depth: 3.1 mi, Class: Light, Intensity: II - III) earthquake occurred 128.6 miles away from Waite Park center
On 2/9/1994 at 08:45:35, a magnitude 3.1 (3.1 LG, Depth: 3.1 mi) earthquake occurred 53.6 miles away from the city center
On 11/3/2002 at 20:41:56, a magnitude 4.3 (4.3 MB, Depth: 3.1 mi) earthquake occurred 301.2 miles away from Waite Park center
Magnitude types: regional Lg-wave magnitude (LG), body-wave magnitude (MB), local magnitude (ML)
Natural disasters:
The number of natural disasters in Stearns County (11) is smaller than the US average (15).Major Disasters (Presidential) Declared: 8
Emergencies Declared: 2
Causes of natural disasters: Floods: 7, Storms: 3, Blizzard: 1, Drought: 1, Hurricane: 1, Tornado: 1, Wind: 1, Winter Storm: 1, Other: 1 (Note: some incidents may be assigned to more than one category).
Hospitals and medical centers in Waite Park:
Colleges/Universities in Waite Park:
Colleges/universities with over 2000 students nearest to Waite Park:
- Rasmussen College-Minnesota (about 1 miles; St. Cloud, MN; Full-time enrollment: 4,575)
- St Cloud Technical and Community College (about 4 miles; Saint Cloud, MN; FT enrollment: 3,493)
- Saint Cloud State University (about 4 miles; Saint Cloud, MN; FT enrollment: 12,822)
- College of Saint Benedict (about 5 miles; Saint Joseph, MN; FT enrollment: 2,025)
- Anoka-Ramsey Community College (about 50 miles; Coon Rapids, MN; FT enrollment: 5,918)
- Ridgewater College (about 51 miles; Willmar, MN; FT enrollment: 3,288)
- Hennepin Technical College (about 52 miles; Brooklyn Park, MN; FT enrollment: 4,515)
Public high school in Waite Park:
- ST CLOUD AREA LEARNING CENTER (Location: 216 N 8TH AVE, Grades: 7-12)
Private high school in Waite Park:
- HOLY INNOCENTS SCHOOL (Students: 24, Location: 1705 COUNTY ROAD 137, Grades: UG-12)
Public elementary/middle schools in Waite Park:
- SAINT CLOUD MATH AND SCIENCE ACADEM (Location: 136 DIVISION STREET, Grades: KG-4, Charter school)
- DISCOVERY COMMUNITY ELEMENTARY (Location: 700 S 7TH ST, Grades: KG-5)
Private elementary/middle school in Waite Park:
- ST JOSEPH SCHOOL (Students: 97, Location: 108 6TH AVE N, Grades: PK-6)
User-submitted facts and corrections:
- McKinley School was closed in 2003 due to lack of funding. Discovery School in Waite Park now has K-6 grades.
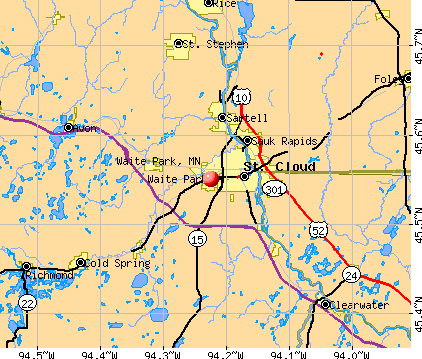
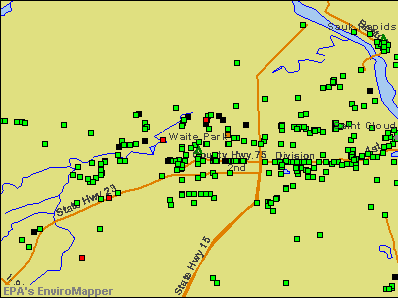
Points of interest:
Notable locations in Waite Park: Angushire Golf Course (A), Waite Park Police Department (B), Waite Park City Hall (C), Waite Park Fire Department (D), Waite Park Public Library (E). Display/hide their locations on the map
Shopping Centers: Riverwood Mall (1), Marketplace Shopping Center (2). Display/hide their locations on the map
Churches in Waite Park include: United Pentecostal Church (A), Saint Joseph's Church (B), Saint Cloud Church of God (C), Bethlehem Lutheran Church (D). Display/hide their locations on the map
Cemetery: Saint Joseph Cemetery (1). Display/hide its location on the map
Parks in Waite Park include: Quarry Park and Nature Preserve (1), Lion's Park (2), Jiagello Park (3), Bartz Park (4), Community Park (5), Rivers Edge Park (6), Moose Park (7), Saint Cloud Municipal Park (8). Display/hide their locations on the map
Hotel: Motel 6 (815 1st Street South).
Drinking water stations with addresses in Waite Park that have no violations reported:
- TELLURIDE LODGE (Serves ND, Population served: 86, Primary Water Source Type: Groundwater)
| This city: | 2.1 people |
| Minnesota: | 2.5 people |
| This city: | 49.2% |
| Whole state: | 64.6% |
| This city: | 9.1% |
| Whole state: | 6.9% |
Likely homosexual households (counted as self-reported same-sex unmarried-partner households)
- Lesbian couples: 0.2% of all households
- Gay men: 0.1% of all households
People in group quarters in Waite Park in 2010:
- 52 people in nursing facilities/skilled-nursing facilities
- 27 people in group homes intended for adults
- 3 people in other noninstitutional facilities
People in group quarters in Waite Park in 2000:
- 59 people in other noninstitutional group quarters
- 18 people in homes for the mentally ill
- 4 people in homes for the mentally retarded
Banks with branches in Waite Park (2011 data):
- Plaza Park State Bank: at 131 6th Avenue S, Suite 100, branch established on 1910/11/26. Info updated 2006/07/25: Bank assets: $166.7 mil, Deposits: $149.7 mil, local headquarters, positive income, Commercial Lending Specialization, 2 total offices, Holding Company: Plaza Agency, Inc.
- Liberty Savings Bank fsb: Waite Park Branch at 818 2nd Street South, Suite 120, branch established on 2003/12/01. Info updated 2011/07/21: Bank assets: $163.7 mil, Deposits: $139.1 mil, headquarters in Saint Cloud, MN, positive income, Mortgage Lending Specialization, 5 total offices
- MidCountry Bank: Waite Park Branch at 113 Waite Avenue South, branch established on 1996/06/30. Info updated 2011/07/21: Bank assets: $674.7 mil, Deposits: $534.7 mil, headquarters in Marion, IL, positive income, Commercial Lending Specialization, 23 total offices
For population 15 years and over in Waite Park:
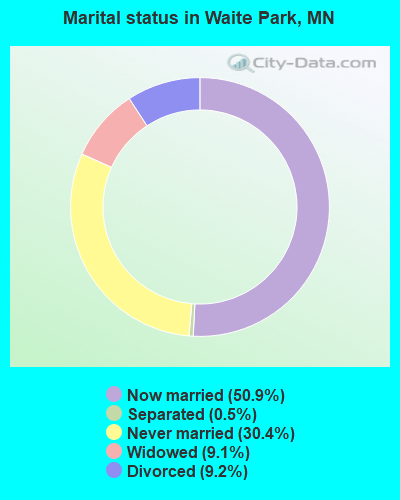
- Never married: 30.4%
- Now married: 50.9%
- Separated: 0.5%
- Widowed: 9.1%
- Divorced: 9.2%
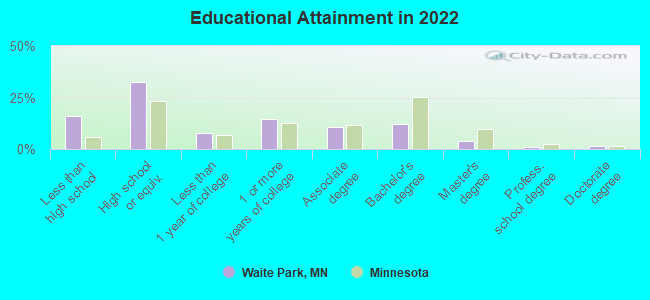
For population 25 years and over in Waite Park:
- High school or higher: 85.1%
- Bachelor's degree or higher: 17.4%
- Graduate or professional degree: 6.0%
- Unemployed: 5.2%
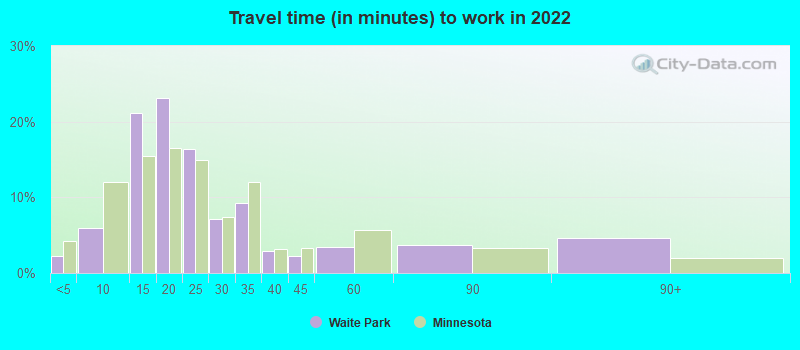
- Mean travel time to work (commute): 16.6 minutes
| Here: | 17.9 |
| Minnesota average: | 10.9 |
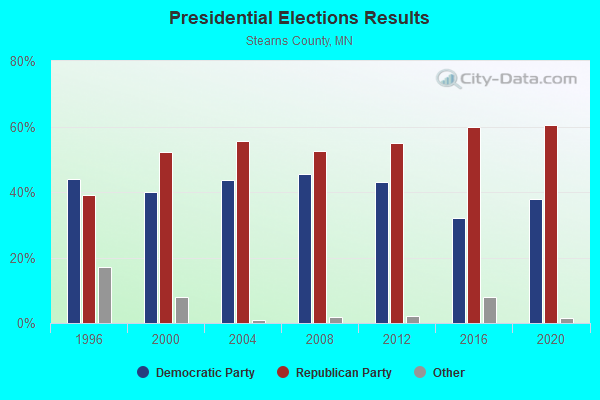
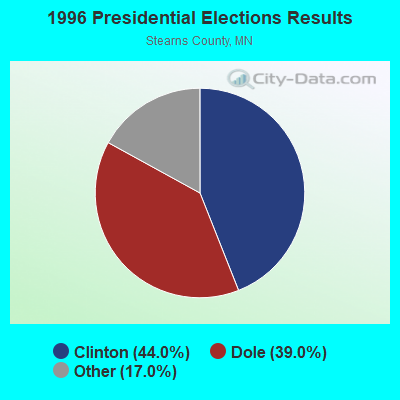
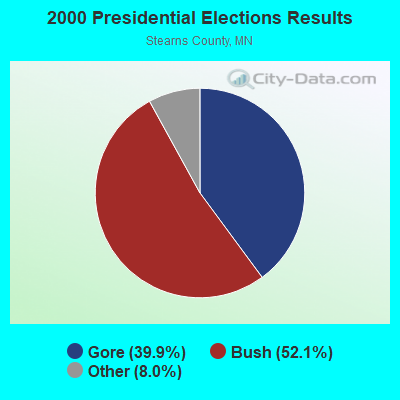
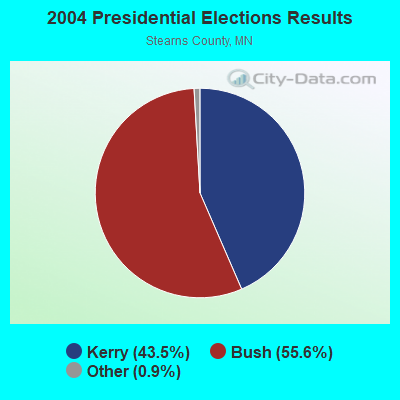
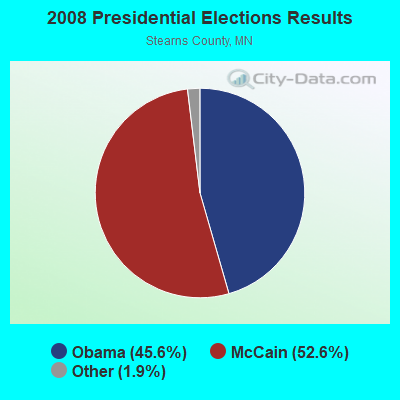
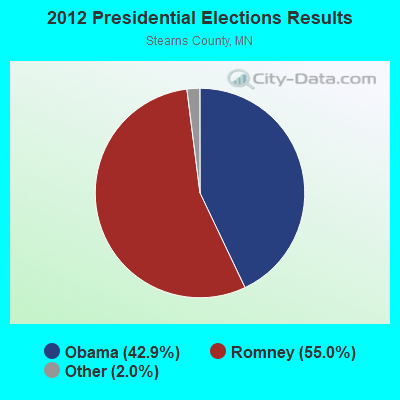
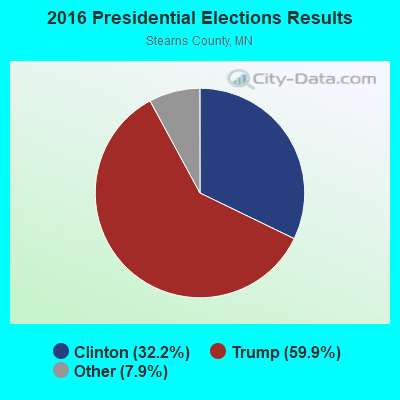
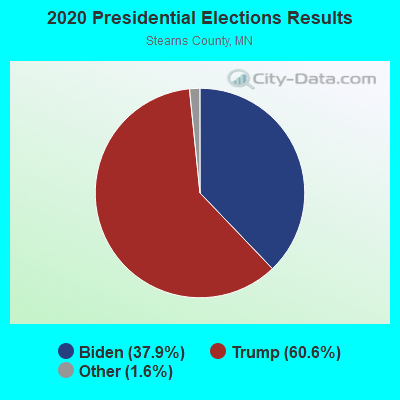
Graphs represent county-level data. Detailed 2008 Election Results
Religion statistics for Waite Park, MN (based on Stearns County data)
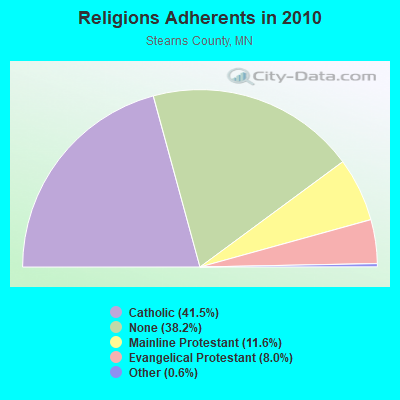
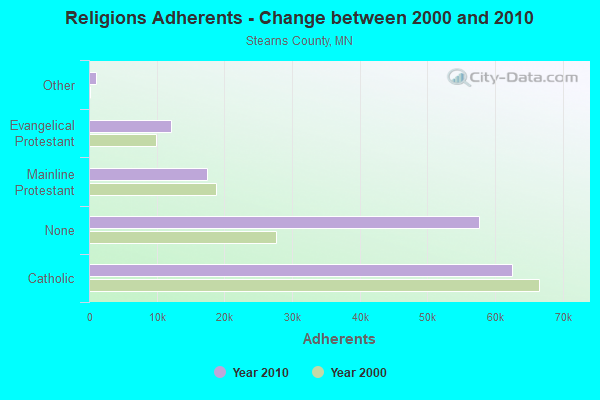
| Religion | Adherents | Congregations |
|---|---|---|
| Catholic | 62,565 | 48 |
| Mainline Protestant | 17,438 | 28 |
| Evangelical Protestant | 12,071 | 47 |
| Other | 969 | 7 |
| Orthodox | 21 | 1 |
| None | 57,578 | - |
Food Environment Statistics:
| Stearns County: | 1.99 / 10,000 pop. |
| State: | 1.83 / 10,000 pop. |
| Stearns County: | 0.07 / 10,000 pop. |
| Minnesota: | 0.13 / 10,000 pop. |
| Here: | 0.27 / 10,000 pop. |
| Minnesota: | 0.49 / 10,000 pop. |
| Stearns County: | 3.35 / 10,000 pop. |
| Minnesota: | 3.90 / 10,000 pop. |
| Stearns County: | 8.22 / 10,000 pop. |
| Minnesota: | 6.98 / 10,000 pop. |
| Stearns County: | 6.2% |
| Minnesota: | 6.5% |
| Stearns County: | 27.2% |
| Minnesota: | 25.9% |
| This county: | 9.6% |
| Minnesota: | 13.0% |
Health and Nutrition:
| Waite Park: | 47.3% |
| State: | 50.6% |
| Waite Park: | 43.1% |
| Minnesota: | 48.4% |
| Waite Park: | 27.7 |
| Minnesota: | 28.5 |
| Here: | 20.8% |
| State: | 21.0% |
| Waite Park: | 11.8% |
| Minnesota: | 9.8% |
| Waite Park: | 6.9 |
| Minnesota: | 6.8 |
| Waite Park: | 27.7% |
| State: | 33.5% |
| This city: | 55.6% |
| Minnesota: | 57.7% |
| This city: | 79.2% |
| State: | 79.3% |
More about Health and Nutrition of Waite Park, MN Residents
| Local government employment and payroll (March 2022) | |||||
| Function | Full-time employees | Monthly full-time payroll | Average yearly full-time wage | Part-time employees | Monthly part-time payroll |
|---|---|---|---|---|---|
| Police Protection - Officers | 20 | $123,132 | $73,879 | 0 | $0 |
| Financial Administration | 9 | $59,481 | $79,308 | 0 | $0 |
| Streets and Highways | 9 | $50,584 | $67,445 | 1 | $1,151 |
| Water Supply | 4 | $23,921 | $71,763 | 0 | $0 |
| Police - Other | 3 | $18,600 | $74,400 | 4 | $5,417 |
| Other Government Administration | 1 | $5,390 | $64,680 | 5 | $2,400 |
| Other and Unallocable | 0 | $0 | 2 | $2,067 | |
| Fire - Other | 0 | $0 | 24 | $31,185 | |
| Totals for Government | 46 | $281,107 | $73,332 | 36 | $42,220 |
Waite Park government finances - Expenditure in 2017 (per resident):
- Construction - Regular Highways: $2,147,000 ($256.63)
- Current Operations - Police Protection: $2,434,000 ($290.94)
Water Utilities: $2,062,000 ($246.47)
Sewerage: $1,719,000 ($205.47)
General - Other: $1,135,000 ($135.67)
Regular Highways: $939,000 ($112.24)
Financial Administration: $574,000 ($68.61)
Solid Waste Management: $374,000 ($44.70)
Parks and Recreation: $316,000 ($37.77)
Protective Inspection and Regulation - Other: $257,000 ($30.72)
Local Fire Protection: $213,000 ($25.46)
Central Staff Services: $57,000 ($6.81)
Libraries: $26,000 ($3.11)
- General - Interest on Debt: $539,000 ($64.43)
- Other Capital Outlay - Regular Highways: $2,905,000 ($347.24)
Local Fire Protection: $745,000 ($89.05)
Parks and Recreation: $403,000 ($48.17)
Police Protection: $124,000 ($14.82)
General - Other: $93,000 ($11.12)
Libraries: $8,000 ($0.96)
Protective Inspection and Regulation - Other: $2,000 ($0.24)
- Water Utilities - Interest on Debt: $86,000 ($10.28)
Waite Park government finances - Revenue in 2017 (per resident):
- Charges - Sewerage: $1,720,000 ($205.59)
Other: $461,000 ($55.10)
Regular Highways: $49,000 ($5.86)
Parks and Recreation: $6,000 ($0.72)
- Federal Intergovernmental - Other: $30,000 ($3.59)
- Local Intergovernmental - Highways: $30,000 ($3.59)
- Miscellaneous - General Revenue - Other: $987,000 ($117.98)
Special Assessments: $614,000 ($73.39)
Fines and Forfeits: $89,000 ($10.64)
Interest Earnings: $63,000 ($7.53)
- Revenue - Water Utilities: $1,977,000 ($236.31)
- State Intergovernmental - Other: $165,000 ($19.72)
General Local Government Support: $12,000 ($1.43)
- Tax - Property: $6,867,000 ($820.82)
General Sales and Gross Receipts: $1,301,000 ($155.51)
Severance: $149,000 ($17.81)
Public Utilities Sales: $101,000 ($12.07)
Other License: $78,000 ($9.32)
Waite Park government finances - Debt in 2017 (per resident):
- Long Term Debt - Outstanding Unspecified Public Purpose: $23,180,000 ($2770.74)
Beginning Outstanding - Unspecified Public Purpose: $13,555,000 ($1620.25)
Outstanding Nonguaranteed - Industrial Revenue: $12,790,000 ($1528.81)
Beginning Outstanding - Public Debt for Private Purpose: $12,790,000 ($1528.81)
Issue, Unspecified Public Purpose: $11,780,000 ($1408.08)
Retired Unspecified Public Purpose: $2,155,000 ($257.59)
Waite Park government finances - Cash and Securities in 2017 (per resident):
- Bond Funds - Cash and Securities: $3,198,000 ($382.26)
- Other Funds - Cash and Securities: $2,363,000 ($282.45)
- Sinking Funds - Cash and Securities: $12,790,000 ($1528.81)
| Businesses in Waite Park, MN | ||||
| Name | Count | Name | Count | |
|---|---|---|---|---|
| ALDI | 1 | Menards | 1 | |
| AT&T | 1 | New Balance | 1 | |
| Discount Tire | 1 | Nike | 2 | |
| Domino's Pizza | 1 | Olive Garden | 1 | |
| FedEx | 1 | Penske | 1 | |
| Home Depot | 1 | PetSmart | 1 | |
| IHOP | 1 | Slumberland | 1 | |
| KFC | 1 | Sprint Nextel | 1 | |
| Kincaid | 1 | Starbucks | 1 | |
| Kmart | 1 | Subway | 3 | |
| Kohl's | 1 | Toyota | 1 | |
| La-Z-Boy | 2 | UPS | 1 | |
| Lane Furniture | 3 | Vans | 1 | |
| MasterBrand Cabinets | 1 | Walgreens | 1 | |
| McDonald's | 2 | Wendy's | 1 | |
Strongest AM radio stations in Waite Park:
- KXSS (1390 AM; 2 kW; WAITE PARK, MN; Owner: REPCOM, INC.)
- WBHR (660 AM; 10 kW; SAUK RAPIDS, MN; Owner: HERBERT M. HOPPE)
- WVAL (800 AM; 3 kW; SAUK RAPIDS, MN; Owner: TRI-COUNTY BROADCASTING, INC)
- KNSI (1450 AM; 1 kW; ST. CLOUD, MN; Owner: LEIGHTON ENTERPRISES, INC.)
- WJON (1240 AM; 1 kW; ST. CLOUD, MN; Owner: REGENT LICENSEE OF ST. CLOUD, INC.)
- WCCO (830 AM; 50 kW; MINNEAPOLIS, MN; Owner: INFINITY MEDIA CORPORATION)
- KFAN (1130 AM; 50 kW; MINNEAPOLIS, MN; Owner: AMFM RADIO LICENSES, L.L.C.)
- WCTS (1030 AM; 50 kW; MAPLEWOOD, MN; Owner: CNTL. BAPT. THEO/AL SEMI MINNEAPOLIS)
- KSTP (1500 AM; 50 kW; ST. PAUL, MN; Owner: KSTP-AM, LLC (DELAWARE))
- KTIS (900 AM; 25 kW; MINNEAPOLIS, MN; Owner: NORTHWESTERN COLLEGE)
- KLTF (960 AM; 5 kW; LITTLE FALLS, MN; Owner: KLTF/KFML, INC.)
- KASM (1150 AM; 2 kW; ALBANY, MN; Owner: STARCOM, LLC)
- WEBC (560 AM; 50 kW; DULUTH, MN)
Strongest FM radio stations in Waite Park:
- KVSC (88.1 FM; ST. CLOUD, MN; Owner: ST. CLOUD STATE UNIVERSITY)
- KCML (99.9 FM; ST. JOSEPH, MN; Owner: LEIGHTON ENTERPRISES INC)
- WHMH-FM (101.7 FM; SAUK RAPIDS, MN; Owner: TRI-COUNTY BROADCASTING INC.)
- KCFB (91.5 FM; ST. CLOUD, MN; Owner: MINNESOTA CHRISTIAN B/CASTERS, INC)
- KKSR (96.7 FM; SARTELL, MN; Owner: SARTELL FM, INC.)
- KLZZ (103.7 FM; WAITE PARK, MN; Owner: REPCOM, INC.)
- KKJM (92.9 FM; ST. JOSEPH, MN; Owner: GABRIEL COMMUNICATIONS COMPANY, ST. CLOUD)
- KCLD-FM (104.7 FM; ST. CLOUD, MN; Owner: LEIGHTON ENTERPRISES, INC.)
- KSJR-FM (90.1 FM; COLLEGEVILLE, MN; Owner: MINNESOTA PUBLIC RADIO)
- KNSR (88.9 FM; COLLEGEVILLE, MN; Owner: MINNESOTA PUBLIC RADIO)
- WWJO (98.1 FM; ST. CLOUD, MN; Owner: REGENT LICENSEE OF ST. CLOUD, INC.)
- KMXK (94.9 FM; COLD SPRING, MN; Owner: REGENT LICENSEE OF ST. CLOUD, INC.)
- KZPK (98.9 FM; PAYNESVILLE, MN; Owner: LEIGHTON ENTERPRISES, INC.)
- K208DV (90.1 FM; ST. CLOUD, MN; Owner: EDUCATIONAL MEDIA FOUNDATION)
- KLCI (106.1 FM; ELK RIVER, MN; Owner: MILESTONE RADIO LLC)
- KJZI (100.3 FM; MINNEAPOLIS, MN; Owner: AMFM RADIO LICENSES, L.L.C.)
- KQQL (107.9 FM; ANOKA, MN; Owner: AMFM RADIO LICENSES, L.L.C.)
- KDDG (105.5 FM; ALBANY, MN; Owner: STARCOM, LLC)
TV broadcast stations around Waite Park:
- K19BG (Channel 19; ST. CLOUD, MN; Owner: TRINITY BROADCASTING NETWORK)
- WCMN-LP (Channel 13; ST. CLOUD-SARTELL, MN; Owner: STARCOM, LLC)
- KPXM (Channel 41; ST. CLOUD, MN; Owner: PAXSON MINNEAPOLIS LICENSE, INC.)
- KCCO-TV (Channel 7; ALEXANDRIA, MN; Owner: CBS BROADCASTING INC.)
- KSAX (Channel 42; ALEXANDRIA, MN; Owner: KSAX-TV, INC.)
- National Bridge Inventory (NBI) Statistics
- 5Number of bridges
- 39ft / 11.9mTotal length
- 60,072Total average daily traffic
- 3,163Total average daily truck traffic
- 60,528Total future (year 2029) average daily traffic
FCC Registered Antenna Towers:
20 (See the full list of FCC Registered Antenna Towers in Waite Park)FCC Registered Private Land Mobile Towers:
2 (See the full list of FCC Registered Private Land Mobile Towers in Waite Park, MN)FCC Registered Broadcast Land Mobile Towers:
11 (See the full list of FCC Registered Broadcast Land Mobile Towers)FCC Registered Microwave Towers:
10 (See the full list of FCC Registered Microwave Towers in this town)FCC Registered Paging Towers:
1 (See the full list of FCC Registered Paging Towers)FCC Registered Amateur Radio Licenses:
31 (See the full list of FCC Registered Amateur Radio Licenses in Waite Park)FAA Registered Aircraft:
2- Aircraft: CZECH SPORT AIRCRAFT A S SPORTCRUISER (Category: Land, Seats: 2, Weight: Up to 12,499 Pounds), Engine: ROTAX 912ULS SERIES (100 HP) (4 Cycle)
N-Number: 475SC, N475SC, N-475SC, Serial Number: C0501, Year manufactured: 2014, Airworthiness Date: 02/07/2014, Certificate Issue Date: 05/08/2019
Registrant (Individual): David Patrick Swantek, 220 3rd St N, Waite Park, MN 56387 - Aircraft: PIPER PA-28-140 (Category: Land, Seats: 4, Weight: Up to 12,499 Pounds, Speed: 107 mph), Engine: LYCOMING 0-320 SERIES (180 HP) (Reciprocating)
N-Number: 933BK, N933BK, N-933BK, Serial Number: 28-7225113, Year manufactured: 1971, Airworthiness Date: 11/23/1971, Certificate Issue Date: 12/20/1997
Registrant (Individual): William R Kreul, 1151 Willow Pond Dr, Waite Park, MN 56387
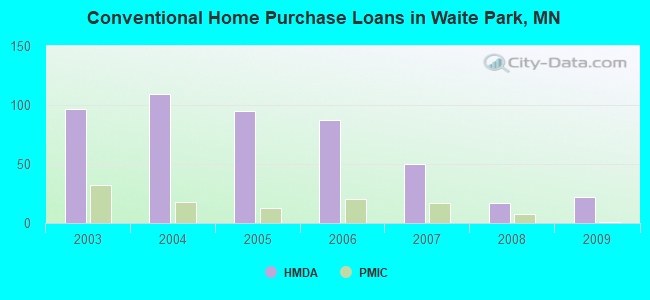
| Home Mortgage Disclosure Act Aggregated Statistics For Year 2009 (Based on 1 partial tract) | ||||||||||||||
| A) FHA, FSA/RHS & VA Home Purchase Loans | B) Conventional Home Purchase Loans | C) Refinancings | D) Home Improvement Loans | E) Loans on Dwellings For 5+ Families | F) Non-occupant Loans on < 5 Family Dwellings (A B C & D) | G) Loans On Manufactured Home Dwelling (A B C & D) | ||||||||
|---|---|---|---|---|---|---|---|---|---|---|---|---|---|---|
| Number | Average Value | Number | Average Value | Number | Average Value | Number | Average Value | Number | Average Value | Number | Average Value | Number | Average Value | |
| LOANS ORIGINATED | 27 | $106,541 | 22 | $84,665 | 100 | $115,293 | 6 | $50,395 | 0 | $0 | 8 | $93,634 | 0 | $0 |
| APPLICATIONS APPROVED, NOT ACCEPTED | 0 | $0 | 1 | $115,100 | 4 | $70,110 | 0 | $0 | 0 | $0 | 1 | $115,100 | 0 | $0 |
| APPLICATIONS DENIED | 1 | $67,600 | 3 | $115,407 | 29 | $150,980 | 1 | $2,740 | 1 | $13,700 | 3 | $257,910 | 1 | $593,770 |
| APPLICATIONS WITHDRAWN | 1 | $79,470 | 1 | $140,680 | 24 | $124,693 | 0 | $0 | 0 | $0 | 1 | $92,260 | 0 | $0 |
| FILES CLOSED FOR INCOMPLETENESS | 0 | $0 | 1 | $52,980 | 4 | $51,155 | 0 | $0 | 0 | $0 | 0 | $0 | 0 | $0 |
Detailed HMDA statistics for the following Tracts: 0005.00
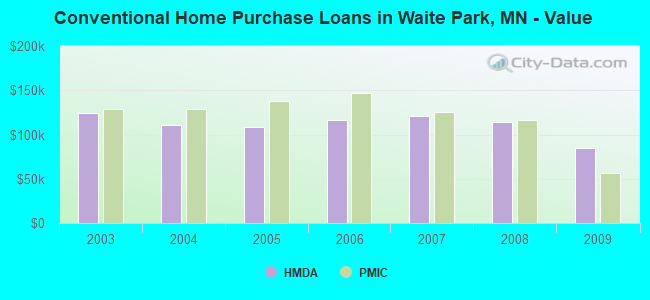
| Private Mortgage Insurance Companies Aggregated Statistics For Year 2009 (Based on 1 partial tract) | ||||
| A) Conventional Home Purchase Loans | B) Refinancings | |||
|---|---|---|---|---|
| Number | Average Value | Number | Average Value | |
| LOANS ORIGINATED | 1 | $56,640 | 3 | $146,770 |
| APPLICATIONS APPROVED, NOT ACCEPTED | 1 | $52,980 | 5 | $135,198 |
| APPLICATIONS DENIED | 2 | $56,635 | 0 | $0 |
| APPLICATIONS WITHDRAWN | 1 | $52,980 | 2 | $132,460 |
| FILES CLOSED FOR INCOMPLETENESS | 1 | $52,980 | 0 | $0 |
Detailed PMIC statistics for the following Tracts: 0005.00
2002 - 2018 National Fire Incident Reporting System (NFIRS) incidents
- Fire incident types reported to NFIRS in Waite Park, MN
- 31560.8%Structure Fires
- 9718.7%Outside Fires
- 7614.7%Mobile Property/Vehicle Fires
- 305.8%Other
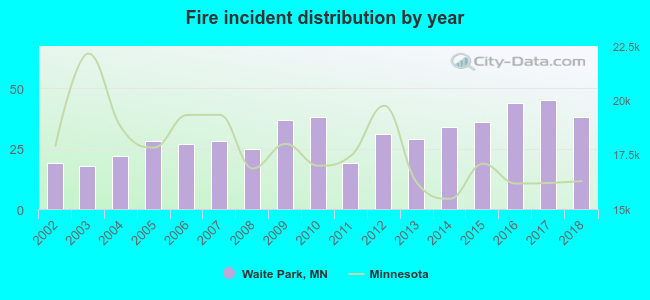 Based on the data from the years 2002 - 2018 the average number of fire incidents per year is 30. The highest number of reported fire incidents - 45 took place in 2017, and the least - 18 in 2003. The data has a rising trend.
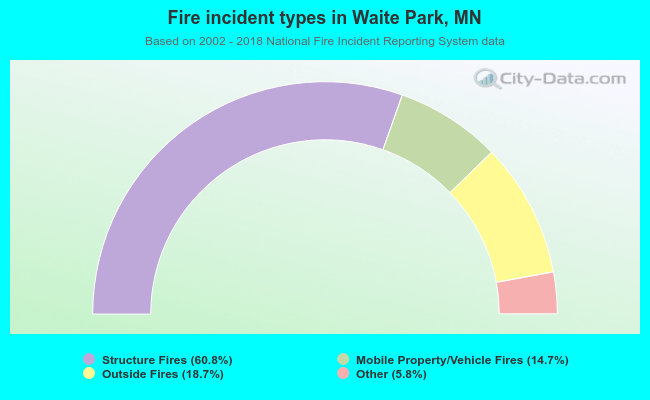 When looking into fire subcategories, the most incidents belonged to: Structure Fires (60.8%), and Outside Fires (18.7%).
| Most common first names in Waite Park, MN among deceased individuals | ||
| Name | Count | Lived (average) |
|---|---|---|
| John | 28 | 80.4 years |
| Mary | 26 | 80.4 years |
| Margaret | 15 | 86.5 years |
| William | 15 | 77.5 years |
| George | 14 | 70.7 years |
| Robert | 14 | 69.1 years |
| Harold | 12 | 77.9 years |
| Joseph | 11 | 84.1 years |
| Dorothy | 11 | 79.3 years |
| Clara | 10 | 84.8 years |
| Most common last names in Waite Park, MN among deceased individuals | ||
| Last name | Count | Lived (average) |
|---|---|---|
| Johnson | 10 | 80.3 years |
| Meyer | 10 | 64.6 years |
| Anderson | 6 | 81.8 years |
| Olson | 5 | 68.4 years |
| Zenner | 5 | 74.0 years |
| Schmitt | 5 | 78.4 years |
| Brannan | 4 | 74.5 years |
| Bauer | 4 | 90.3 years |
| Carlson | 4 | 74.2 years |
| Gohman | 4 | 76.7 years |
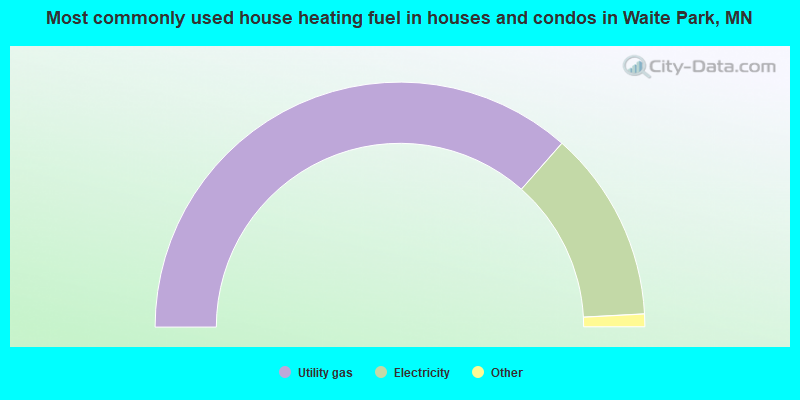
- 73.0%Utility gas
- 25.3%Electricity
- 1.0%Wood
- 0.7%Fuel oil, kerosene, etc.
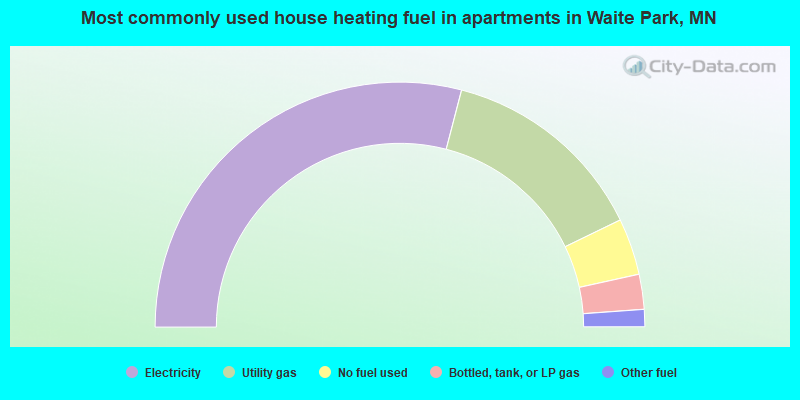
- 58.1%Electricity
- 27.5%Utility gas
- 7.5%No fuel used
- 4.6%Bottled, tank, or LP gas
- 2.3%Other fuel
Waite Park compared to Minnesota state average:
- Median household income below state average.
- Unemployed percentage below state average.
- Black race population percentage significantly above state average.
- Hispanic race population percentage above state average.
- Median age significantly below state average.
- Foreign-born population percentage significantly above state average.
- Renting percentage above state average.
- Length of stay since moving in above state average.
- Number of rooms per house below state average.
- House age below state average.
- Percentage of population with a bachelor's degree or higher below state average.
Waite Park on our top lists:
- #16 on the list of "Top 101 cities with the most residents born in Other Eastern Africa (population 500+)"
- #18 on the list of "Top 101 cities with the highest number of thefts per 100,000 residents, excludes tourist destinations and others with a lot of outsiders visiting based on city industries data (population 5,000+)"
- #23 on the list of "Top 101 cities with largest percentage of males in industries: transportation and warehousing (population 5,000+)"
- #48 on the list of "Top 101 cities with the most residents born in Eastern Africa (population 500+)"
- #96 on the list of "Top 101 cities with largest percentage of females in industries: retail trade (population 5,000+)"
- #63 on the list of "Top 101 counties with the largest increase in the number of births per 1000 residents 2000-2006 to 2007-2013 (pop 50,000+)"
- #74 on the list of "Top 101 counties with the most Catholic congregations"
- #86 on the list of "Top 101 counties with the lowest number of deaths per 1000 residents 2007-2013 (pop. 50,000+)"

|
Total of 2 patent applications in 2008-2024.