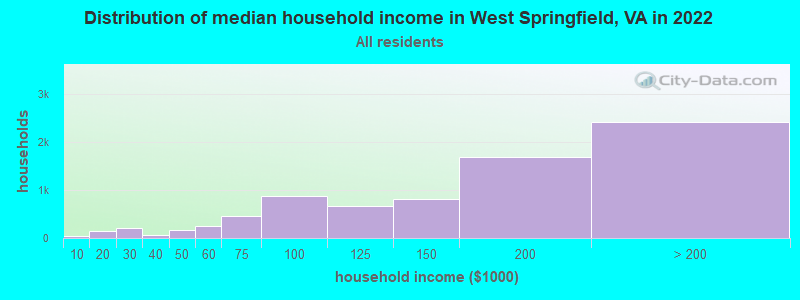
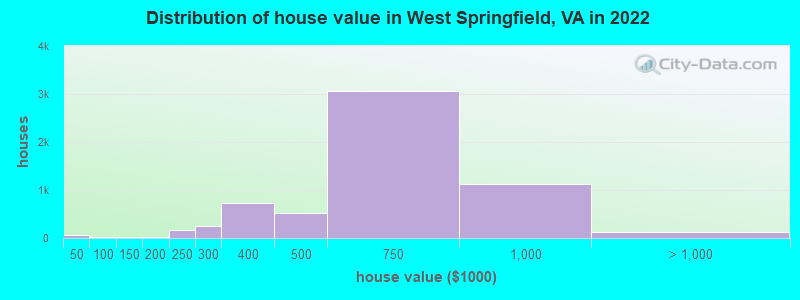
Estimated median house or condo value in 2022: $617,554 (it was $202,900 in 2000)
West Springfield:
$617,554
VA:
$365,700
Mean prices in 2022:all housing units: $654,069; detached houses: $821,108; townhouses or other attached units: $512,544; in 3-to-4-unit structures: $264,964; in 5-or-more-unit structures: $307,494
Median gross rent in 2022: $2,406.
March 2022 cost of living index in West Springfield: 165.9 (very high, U.S. average is 100)
Percentage of residents living in poverty in 2022: 3.7%
(1.8% for White Non-Hispanic residents, 5.9% for Black residents, 5.3% for Hispanic or Latino residents, 7.3% for other race residents, 1.2% for two or more races residents)
According to our research of Virginia and other state lists, there were 3 registered sex offenders living in West Springfield, Virginia as of May 19, 2024. The ratio of all residents to sex offenders in West Springfield is 7,715 to 1. The ratio of registered sex offenders to all residents in this city is much lower than the state average.
Recent articles from our blog. Our writers, many of them Ph.D. graduates or candidates, create easy-to-read articles on a wide variety of topics.
Latest news from West Springfield, VA collected exclusively by city-data.com from local newspapers, TV, and radio stations
Ancestries: Irish (5.1%), English (5.0%), American (4.9%), Ethiopian (4.0%), German (3.4%), Italian (3.0%).
Current Local Time: EST time zone
Elevation: 280 feet
Land area: 6.82 square miles.
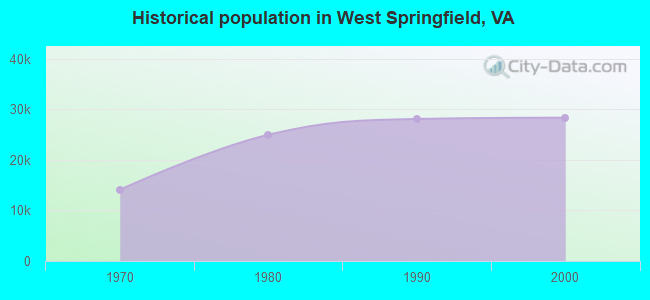
Population density: 3,291 people per square mile (average).
5,933 residents are foreign born (11.6% Asia, 8.0% Latin America, 3.2% Africa).
This place:
25.5%
Virginia:
12.6%
Median real estate property taxes paid for housing units with mortgages in 2022: $5,961 (1.0%) Median real estate property taxes paid for housing units with no mortgage in 2022: $5,783 (1.0%)
Nearest city with pop. 50,000+: Burke, VA (2.1 miles , pop. 57,737).
Nearest city with pop. 200,000+: Washington, DC (14.7 miles , pop. 572,059).
Nearest city with pop. 1,000,000+: Philadelphia, PA (139.5 miles , pop. 1,517,550).
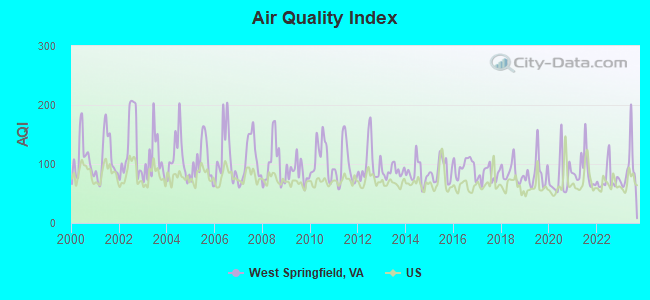
Air Quality Index (AQI) level in 2023 was 85.5. This is about average.
City:
85.5
U.S.:
72.6
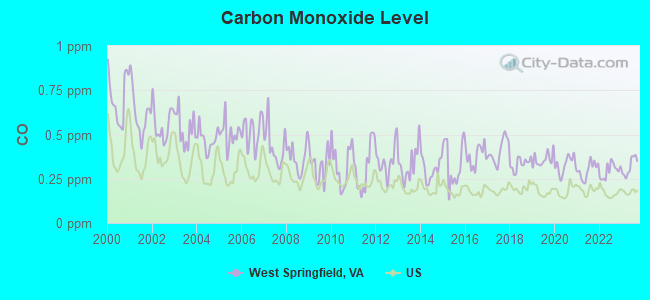
Carbon Monoxide (CO) [ppm] level in 2023 was 0.319. This is worse than average.Closest monitor was 3.0 miles away from the city center.
City:
0.319
U.S.:
0.251
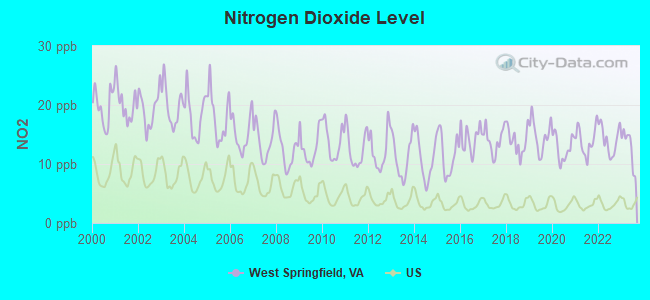
Nitrogen Dioxide (NO2) [ppb] level in 2023 was 12.9. This is significantly worse than average.Closest monitor was 1.9 miles away from the city center.
City:
12.9
U.S.:
5.1
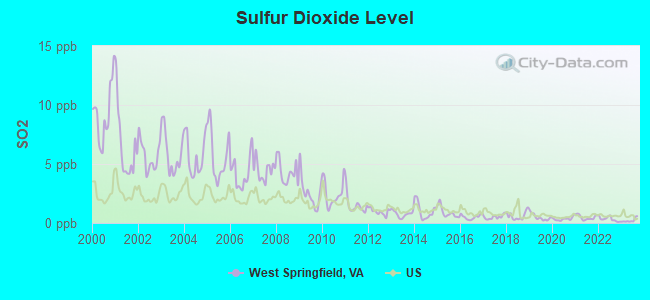
Sulfur Dioxide (SO2) [ppb] level in 2023 was 0.221. This is significantly better than average.Closest monitor was 1.9 miles away from the city center.
City:
0.221
U.S.:
1.515
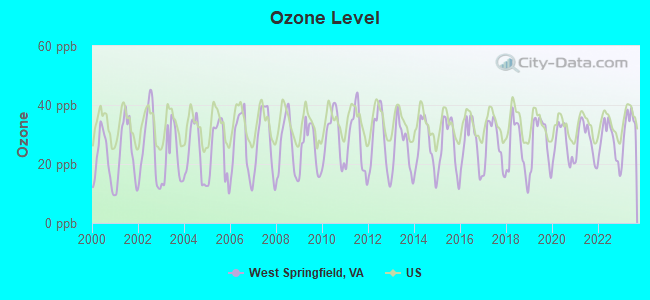
Ozone [ppb] level in 2023 was 32.8. This is about average.Closest monitor was 5.0 miles away from the city center.
City:
32.8
U.S.:
33.3
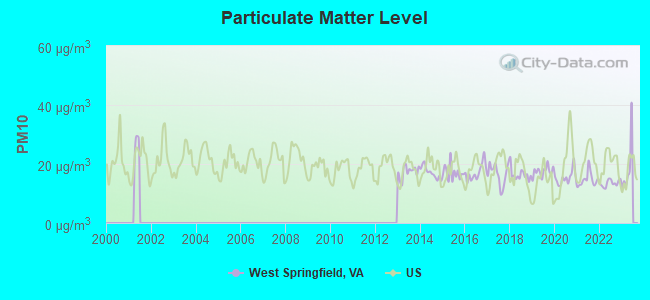
Particulate Matter (PM10) [µg/m3] level in 2022 was 13.5. This is significantly better than average.Closest monitor was 2.7 miles away from the city center.
City:
13.5
U.S.:
19.2
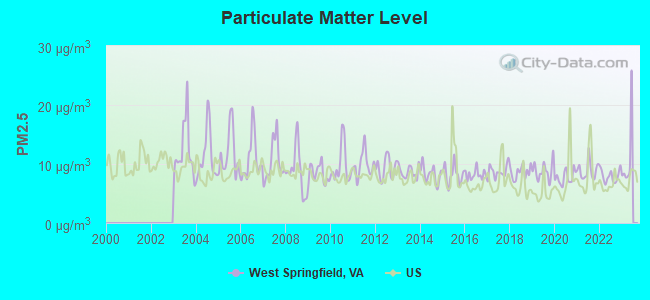
Particulate Matter (PM2.5) [µg/m3] level in 2022 was 7.99. This is about average.Closest monitor was 3.0 miles away from the city center.
City:
7.99
U.S.:
8.11
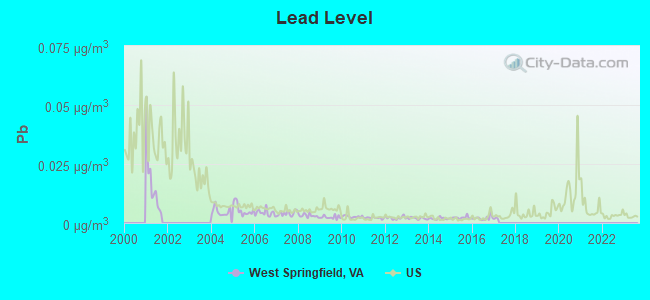
Lead (Pb) [µg/m3] level in 2016 was 0.00212. This is significantly better than average.Closest monitor was 2.7 miles away from the city center.
City:
0.00212
U.S.:
0.00931
Tornado activity:
West Springfield-area historical tornado activity is above Virginia state average. It is 8% greater than the overall U.S. average.
On 4/28/2002, a category F4 (max. wind speeds 207-260 mph) tornado 16.7 miles away from the West Springfield place center killed 3 peopleand injured 122 peopleand caused $124 million in damages.
On 4/1/1973, a category F3 (max. wind speeds 158-206 mph) tornado 5.3 miles away from the place center injured 37 peopleand causedbetween $5,000,000 and $50,000,000 in damages.
Earthquake activity:
West Springfield-area historical earthquake activity is significantly above Virginia state average. It is 56% smaller than the overall U.S. average.
On 8/23/2011 at 17:51:04, a magnitude 5.8 (5.8 MW, Depth: 3.7 mi, Class: Moderate, Intensity: VI - VII) earthquake occurred 71.8 miles away from the city center On 8/25/2011 at 05:07:52, a magnitude 4.5 (4.5 ML, Depth: 4.2 mi, Class: Light, Intensity: IV - V) earthquake occurred 70.5 miles away from the city center On 12/9/2003 at 20:59:18, a magnitude 4.5 (4.5 ML, Depth: 6.2 mi) earthquake occurred 84.5 miles away from West Springfield center On 12/9/2003 at 20:59:14, a magnitude 4.5 (4.5 MB, 4.5 LG) earthquake occurred 90.7 miles away from West Springfield center On 1/16/1994 at 01:49:16, a magnitude 4.6 (4.6 MB, 4.6 LG, Depth: 3.1 mi) earthquake occurred 124.2 miles away from the city center On 9/25/1998 at 19:52:52, a magnitude 5.2 (4.8 MB, 4.3 MS, 5.2 LG, 4.5 MW, Depth: 3.1 mi) earthquake occurred 250.8 miles away from West Springfield center Magnitude types: regional Lg-wave magnitude (LG), body-wave magnitude (MB), local magnitude (ML), surface-wave magnitude (MS), moment magnitude (MW)
Natural disasters:
The number of natural disasters in Fairfax County (15) is near the US average (15). Major Disasters (Presidential) Declared: 12 Emergencies Declared: 3
Causes of natural disasters: Winter Storms: 5, Hurricanes: 4, Snowstorms: 3, Storms: 2, Tropical Storms: 2, Blizzard: 1, Flood: 1, Tornado: 1, Wind: 1, Other: 1 (Note: some incidents may be assigned to more than one category).
Hospitals and medical centers near West Springfield:
CRI QUEEN ELIZABETH ICF (Hospital, about 3 miles away; ANNANDALE, VA)
GREENSPRING VILLAGE HOME SUPPORT SERVICES (Home Health Center, about 3 miles away; SPRINGFIELD, VA)
GREENSPRING HOSPICE (Hospital, about 3 miles away; SPRINGFIELD, VA)
GREENSPRING VILLAGE (Nursing Home, about 3 miles away; SPRINGFIELD, VA)
BURKE HEALTH AND REHABILITATION CENTER (Nursing Home, about 3 miles away; BURKE, VA)
AMEDISYS HOME HEALTH OF ANNANDALE (Home Health Center, about 3 miles away; ANNANDALE, VA)
LEEWOOD HEALTHCARE CENTER (Nursing Home, about 3 miles away; ANNANDALE, VA)
Notable locations in West Springfield: Springfield Country Club (A), Fairfax County Fire and Rescue Department Station 27 West Springfield (B), Fairfax County Police Station Number 7 (C). Display/hide their locations on the map
Shopping Centers: Olde Keene Mill Shopping Center (1), Cardinal Forest Plaza Shopping Center (2), Kings Park Shopping Center (3). Display/hide their locations on the map
Churches in West Springfield include: Fellowship Baptist Church of West Springfield (A), Grace Ethiopian Church (B), Parkwood Baptist Church (C), Messiah Methodist Church (D), Kirkwood Presbyterian Church (E), Prince of Peace Church (F), Westwood Baptist Church (G), Holy Spirit Church (H). Display/hide their locations on the map
Parks in West Springfield include: Hunter Village Park (1), Royal Ridge Park (2), Rolling Forest Park (3), Hidden Pond Park (4), Cardinal Forest Park (5), West Springfield Park (6), West Springfield Village Park (7), Carrleigh Parkway Park (8), Kings Park (9). Display/hide their locations on the map
Birthplace of: Bryn Renner - College football player, Jason Wight - AMerican beach volleyball player.
Fairfax County has a predicted average indoor radon screening level greater than 4 pCi/L (pico curies per liter) - Highest Potential
Average household size:
This place:
2.7 people
Virginia:
2.5 people
Percentage of family households:
This place:
73.1%
Whole state:
67.0%
Percentage of households with unmarried partners:
This place:
3.1%
Whole state:
5.7%
Likely homosexual households (counted as self-reported same-sex unmarried-partner households)
Lesbian couples: 0.4% of all households
Gay men: 0.3% of all households
8 people in group homes intended for adults in 2010
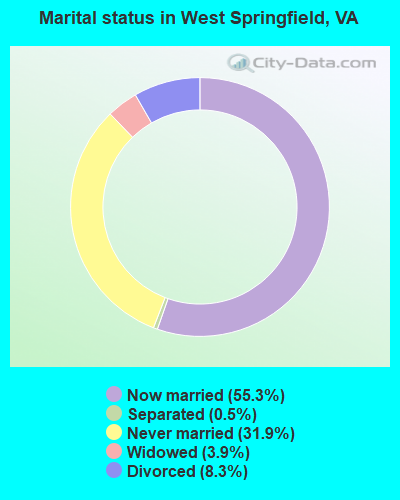
For population 15 years and over in West Springfield:
Never married: 31.9%
Now married: 55.3%
Separated: 0.5%
Widowed: 3.9%
Divorced: 8.3%
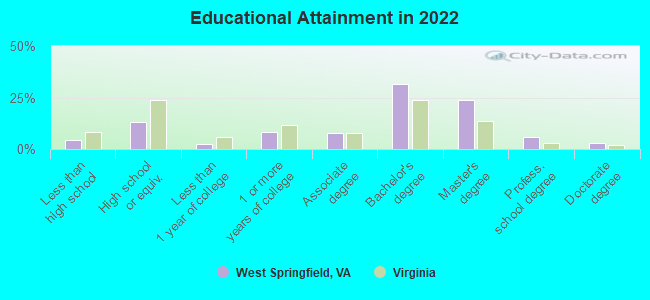
For population 25 years and over in West Springfield:
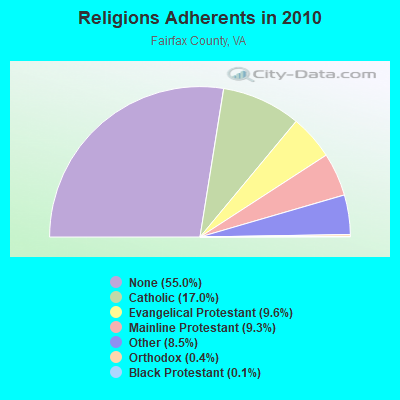
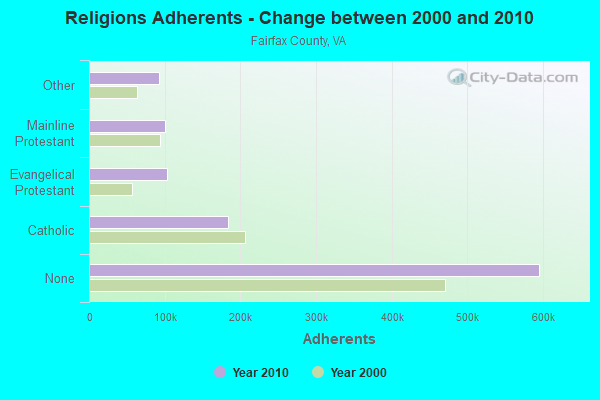
Religion statistics for West Springfield, VA (based on Fairfax County data)
Religion
Adherents
Congregations
Catholic
184,183
29
Evangelical Protestant
103,522
316
Mainline Protestant
100,525
146
Other
91,925
119
Orthodox
4,694
8
Black Protestant
1,509
9
None
595,368
-
Source: Clifford Grammich, Kirk Hadaway, Richard Houseal, Dale E.Jones, Alexei Krindatch, Richie Stanley and Richard H.Taylor. 2012. 2010 U.S.Religion Census: Religious Congregations & Membership Study. Association of Statisticians of American Religious Bodies. Jones, Dale E., et al. 2002. Congregations and Membership in the United States 2000. Nashville, TN: Glenmary Research Center. Graphs represent county-level data
Mikhail Raznobriadsev, Gerry Connolly Cross County Trail (Lat: 38.758722 Lon: -77.223028), Type: 13.4, Structure height: 51059 m, Overall height: 12.1 m, Registrant: Mobilitie, LLC, Mraznobriadsev@mobilitie.Com, , Atlan-ta, Phone: (404) 978-2457
FCC Registered Microwave Towers:
1
RAVENSWORTH, Rolling Rd-Sr638 To Local Service Road (Lat: 38.796667 Lon: -77.240194), Type: Pole, Structure height: 36.9 m, Call Sign: WQMK408, Assigned Frequencies: 10795.0 MHz, 11075.0 MHz, 10795.0 MHz, 11075.0 MHz, 11075.0 MHz, 10795.0 MHz, 11075.0 MHz, 10795.0 MHz, 11075.0 MHz, 10795.0 MHz... (+10 more), Grant Date: 06/23/2020, Expiration Date: 09/01/2030, Certifier: Orlando Spencer, Registrant: Washington Gas Light Company, 6801 Industrial Road, Springfield, VA 22151, Phone: (703) 750-4575, Fax: (703) 750-7788, Email:
FCC Registered Amateur Radio Licenses:
5
Call Sign: KA4UUY, Licensee ID: L00394183, Grant Date: 10/09/2001, Expiration Date: 12/24/2011, Cancellation Date: 12/25/2013, Registrant: Henry A Brown, 7727 Middle Valley Dr, West Springfield, VA 22153
Call Sign: KC2KGX, Licensee ID: L00575072, Grant Date: 10/14/2022, Expiration Date: 10/14/2032, Certifier: Murad Raheem, Registrant: Murad Raheem, 8336 Wickham Rd, West Springfield, VA 22152
Call Sign: KD8QVZ, Licensee ID: L01659220, Grant Date: 11/30/2021, Expiration Date: 11/30/2031, Certifier: Jack R Furbee, Registrant: Jack R Furbee, 7384 Stream Way, West Springfield, VA 22152
Call Sign: KK4EAW, Licensee ID: L01658315, Grant Date: 09/12/2011, Expiration Date: 09/12/2021, Cancellation Date: 02/01/2013, Certifier: Joseph P Joyce-Mcmahon, Registrant: Joseph P Joyce-Mcmahon, 8645 Reseca Ln, West Springfield, VA 22152
Call Sign: KM4WVP, Licensee ID: L02052880, Grant Date: 09/22/2016, Expiration Date: 09/22/2026, Certifier: Steve S Migel, Registrant: Steve S Migel, 5803 Rexford, West Springfield, VA 22152
Home Mortgage Disclosure Act Aggregated Statistics For Year 2009 (Based on 3 full and 3 partial tracts)
A) FHA, FSA/RHS & VA Home Purchase Loans
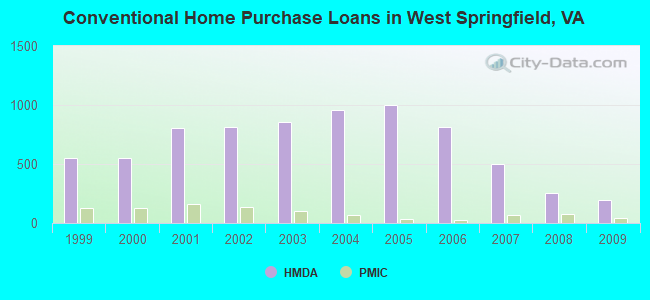
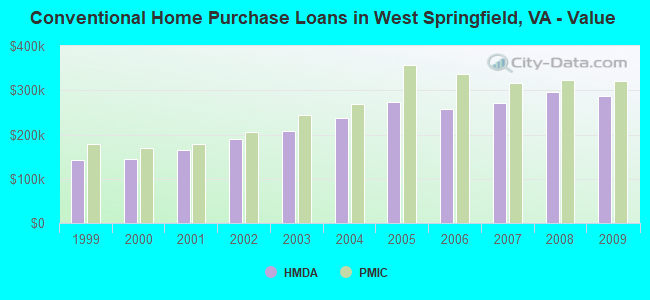
B) Conventional Home Purchase Loans
C) Refinancings
D) Home Improvement Loans
F) Non-occupant Loans on < 5 Family Dwellings (A B C & D)
Number
Average Value
Number
Average Value
Number
Average Value
Number
Average Value
Number
Average Value
LOANS ORIGINATED
218
$327,442
191
$286,455
928
$282,582
33
$143,795
58
$216,523
APPLICATIONS APPROVED, NOT ACCEPTED
10
$313,686
4
$293,905
54
$281,179
2
$87,360
2
$134,950
APPLICATIONS DENIED
12
$308,618
17
$274,602
230
$291,964
17
$76,260
15
$211,160
APPLICATIONS WITHDRAWN
35
$306,203
25
$284,036
185
$297,557
10
$117,028
8
$127,865
FILES CLOSED FOR INCOMPLETENESS
5
$385,668
3
$228,730
46
$274,286
5
$84,322
4
$340,075
Aggregated Statistics For Year 2008 (Based on 3 full and 3 partial tracts)
A) FHA, FSA/RHS & VA Home Purchase Loans
B) Conventional Home Purchase Loans
C) Refinancings
D) Home Improvement Loans
F) Non-occupant Loans on < 5 Family Dwellings (A B C & D)
G) Loans On Manufactured Home Dwelling (A B C & D)
Number
Average Value
Number
Average Value
Number
Average Value
Number
Average Value
Number
Average Value
Number
Average Value
LOANS ORIGINATED
137
$341,066
254
$296,266
366
$257,035
52
$96,266
44
$207,760
0
$0
APPLICATIONS APPROVED, NOT ACCEPTED
5
$360,410
28
$280,653
73
$286,533
9
$77,356
10
$239,325
0
$0
APPLICATIONS DENIED
8
$330,665
39
$291,534
175
$309,950
19
$50,346
10
$176,853
0
$0
APPLICATIONS WITHDRAWN
15
$309,413
32
$261,117
133
$302,980
7
$133,523
11
$241,570
1
$81,070
FILES CLOSED FOR INCOMPLETENESS
1
$411,330
5
$374,048
26
$332,874
5
$133,200
3
$151,667
0
$0
Aggregated Statistics For Year 2007 (Based on 3 full and 3 partial tracts)
A) FHA, FSA/RHS & VA Home Purchase Loans
B) Conventional Home Purchase Loans
C) Refinancings
D) Home Improvement Loans
F) Non-occupant Loans on < 5 Family Dwellings (A B C & D)
Number
Average Value
Number
Average Value
Number
Average Value
Number
Average Value
Number
Average Value
LOANS ORIGINATED
10
$295,657
501
$270,224
590
$263,584
94
$114,070
45
$219,673
APPLICATIONS APPROVED, NOT ACCEPTED
1
$350,000
53
$275,915
132
$255,585
33
$71,713
10
$232,924
APPLICATIONS DENIED
2
$218,500
70
$325,703
280
$298,648
40
$93,713
20
$253,957
APPLICATIONS WITHDRAWN
2
$251,880
58
$245,679
165
$279,929
11
$78,835
12
$214,751
FILES CLOSED FOR INCOMPLETENESS
1
$347,000
13
$298,352
55
$316,541
5
$215,848
3
$150,083
Aggregated Statistics For Year 2006 (Based on 3 full and 3 partial tracts)
A) FHA, FSA/RHS & VA Home Purchase Loans
B) Conventional Home Purchase Loans
C) Refinancings
D) Home Improvement Loans
F) Non-occupant Loans on < 5 Family Dwellings (A B C & D)
G) Loans On Manufactured Home Dwelling (A B C & D)
Number
Average Value
Number
Average Value
Number
Average Value
Number
Average Value
Number
Average Value
Number
Average Value
LOANS ORIGINATED
9
$311,550
816
$257,920
753
$265,188
111
$123,694
60
$223,518
1
$427,000
APPLICATIONS APPROVED, NOT ACCEPTED
0
$0
62
$292,188
135
$253,655
25
$93,236
8
$156,768
0
$0
APPLICATIONS DENIED
1
$252,000
118
$246,211
273
$266,133
51
$129,082
18
$217,871
1
$19,570
APPLICATIONS WITHDRAWN
1
$276,000
67
$271,286
238
$289,029
16
$170,691
8
$377,626
0
$0
FILES CLOSED FOR INCOMPLETENESS
0
$0
17
$296,284
53
$286,484
5
$172,372
4
$290,750
0
$0
Aggregated Statistics For Year 2005 (Based on 3 full and 3 partial tracts)
A) FHA, FSA/RHS & VA Home Purchase Loans
B) Conventional Home Purchase Loans
C) Refinancings
D) Home Improvement Loans
F) Non-occupant Loans on < 5 Family Dwellings (A B C & D)
G) Loans On Manufactured Home Dwelling (A B C & D)
Number
Average Value
Number
Average Value
Number
Average Value
Number
Average Value
Number
Average Value
Number
Average Value
LOANS ORIGINATED
5
$248,000
998
$273,578
1,170
$260,425
151
$151,819
127
$222,788
0
$0
APPLICATIONS APPROVED, NOT ACCEPTED
0
$0
87
$288,121
138
$231,504
17
$125,790
14
$180,907
0
$0
APPLICATIONS DENIED
0
$0
126
$245,379
238
$266,926
45
$103,032
25
$215,112
2
$33,975
APPLICATIONS WITHDRAWN
0
$0
75
$282,831
209
$245,574
40
$203,582
14
$221,776
0
$0
FILES CLOSED FOR INCOMPLETENESS
0
$0
23
$256,443
44
$288,186
6
$115,083
3
$219,600
0
$0
Aggregated Statistics For Year 2004 (Based on 3 full and 3 partial tracts)
A) FHA, FSA/RHS & VA Home Purchase Loans
B) Conventional Home Purchase Loans
C) Refinancings
D) Home Improvement Loans
E) Loans on Dwellings For 5+ Families
F) Non-occupant Loans on < 5 Family Dwellings (A B C & D)
G) Loans On Manufactured Home Dwelling (A B C & D)
Number
Average Value
Number
Average Value
Number
Average Value
Number
Average Value
Number
Average Value
Number
Average Value
Number
Average Value
LOANS ORIGINATED
20
$189,892
958
$237,723
1,340
$222,955
116
$112,160
0
$0
113
$190,231
1
$34,000
APPLICATIONS APPROVED, NOT ACCEPTED
5
$158,248
47
$218,050
168
$202,419
26
$113,358
0
$0
13
$175,780
1
$10,700
APPLICATIONS DENIED
1
$173,440
110
$238,052
267
$216,157
57
$71,424
0
$0
29
$228,140
3
$48,807
APPLICATIONS WITHDRAWN
3
$242,220
88
$239,852
228
$216,272
29
$116,872
1
$15,000
12
$173,967
2
$70,000
FILES CLOSED FOR INCOMPLETENESS
1
$184,000
20
$272,966
68
$227,317
4
$105,212
0
$0
4
$204,682
0
$0
Aggregated Statistics For Year 2003 (Based on 3 full and 3 partial tracts)
A) FHA, FSA/RHS & VA Home Purchase Loans
B) Conventional Home Purchase Loans
C) Refinancings
D) Home Improvement Loans
F) Non-occupant Loans on < 5 Family Dwellings (A B C & D)
Number
Average Value
Number
Average Value
Number
Average Value
Number
Average Value
Number
Average Value
LOANS ORIGINATED
76
$183,510
852
$208,107
3,272
$185,630
66
$49,918
182
$147,159
APPLICATIONS APPROVED, NOT ACCEPTED
2
$156,500
55
$205,557
315
$189,771
24
$48,357
15
$126,381
APPLICATIONS DENIED
2
$148,690
55
$190,432
297
$188,087
38
$46,354
22
$134,354
APPLICATIONS WITHDRAWN
4
$199,025
63
$190,204
284
$183,295
14
$67,299
21
$133,942
FILES CLOSED FOR INCOMPLETENESS
2
$128,000
16
$254,897
85
$203,477
3
$29,147
12
$162,906
Aggregated Statistics For Year 2002 (Based on 3 full and 3 partial tracts)
A) FHA, FSA/RHS & VA Home Purchase Loans
B) Conventional Home Purchase Loans
C) Refinancings
D) Home Improvement Loans
F) Non-occupant Loans on < 5 Family Dwellings (A B C & D)
Number
Average Value
Number
Average Value
Number
Average Value
Number
Average Value
Number
Average Value
LOANS ORIGINATED
99
$160,086
812
$190,927
2,112
$177,416
77
$44,996
135
$127,614
APPLICATIONS APPROVED, NOT ACCEPTED
3
$177,453
53
$164,428
165
$164,797
32
$36,513
6
$154,120
APPLICATIONS DENIED
6
$129,865
57
$185,551
260
$149,053
34
$31,666
20
$136,747
APPLICATIONS WITHDRAWN
3
$178,330
56
$161,999
249
$153,148
15
$69,549
11
$147,073
FILES CLOSED FOR INCOMPLETENESS
1
$168,690
10
$142,481
55
$162,568
2
$30,160
0
$0
Aggregated Statistics For Year 2001 (Based on 3 full and 3 partial tracts)
A) FHA, FSA/RHS & VA Home Purchase Loans
B) Conventional Home Purchase Loans
C) Refinancings
D) Home Improvement Loans
F) Non-occupant Loans on < 5 Family Dwellings (A B C & D)
Number
Average Value
Number
Average Value
Number
Average Value
Number
Average Value
Number
Average Value
LOANS ORIGINATED
152
$142,352
801
$164,597
1,332
$157,356
77
$46,204
74
$121,895
APPLICATIONS APPROVED, NOT ACCEPTED
3
$204,960
28
$158,058
108
$122,789
26
$39,551
8
$59,970
APPLICATIONS DENIED
8
$137,329
45
$173,561
182
$115,621
37
$29,312
8
$87,245
APPLICATIONS WITHDRAWN
7
$129,147
52
$172,138
199
$132,465
21
$47,332
11
$128,462
FILES CLOSED FOR INCOMPLETENESS
2
$134,375
8
$198,558
45
$143,216
8
$44,005
1
$87,030
Aggregated Statistics For Year 2000 (Based on 3 full and 3 partial tracts)
A) FHA, FSA/RHS & VA Home Purchase Loans
B) Conventional Home Purchase Loans
C) Refinancings
D) Home Improvement Loans
F) Non-occupant Loans on < 5 Family Dwellings (A B C & D)
Number
Average Value
Number
Average Value
Number
Average Value
Number
Average Value
Number
Average Value
LOANS ORIGINATED
163
$140,703
555
$145,038
209
$115,771
102
$30,884
27
$84,150
APPLICATIONS APPROVED, NOT ACCEPTED
2
$150,725
37
$89,504
33
$100,418
30
$38,953
4
$87,295
APPLICATIONS DENIED
7
$133,730
36
$140,626
122
$80,366
43
$27,693
9
$74,956
APPLICATIONS WITHDRAWN
14
$137,189
32
$130,660
60
$94,447
17
$35,545
2
$107,075
FILES CLOSED FOR INCOMPLETENESS
0
$0
4
$132,135
12
$97,112
7
$30,604
0
$0
Aggregated Statistics For Year 1999 (Based on 2 full and 4 partial tracts)
A) FHA, FSA/RHS & VA Home Purchase Loans
B) Conventional Home Purchase Loans
C) Refinancings
D) Home Improvement Loans
E) Loans on Dwellings For 5+ Families
F) Non-occupant Loans on < 5 Family Dwellings (A B C & D)


 Recent articles from our blog. Our writers, many of them Ph.D. graduates or candidates, create easy-to-read articles on a wide variety of topics.

 (2.1 miles