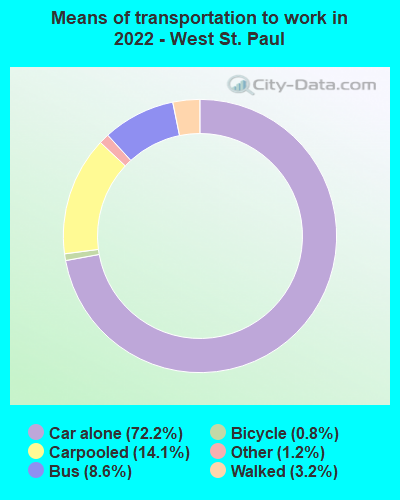
West St. Paul, Minnesota
Submit your own pictures of this city and show them to the world
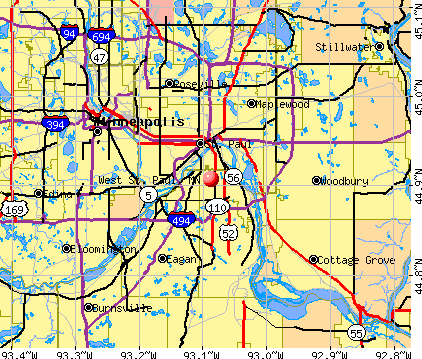
- OSM Map
- General Map
- Google Map
- MSN Map
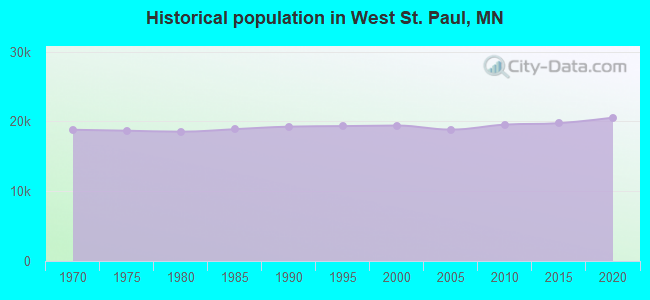
Population change since 2000: +12.3%
 |
| Males: 10,035 | |
| Females: 11,759 |
| Median resident age: | 39.5 years |
| Minnesota median age: | 39.0 years |
Zip codes: 55118.
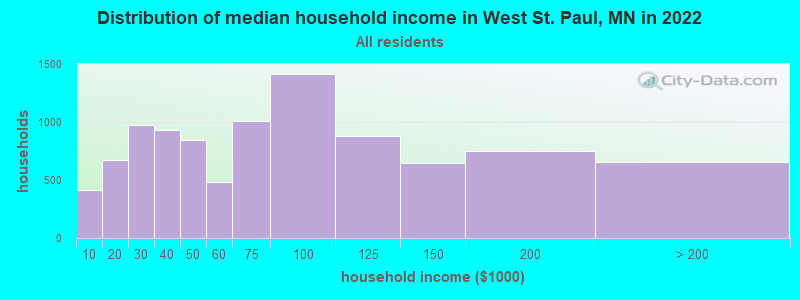
| West St. Paul: | $65,756 |
| MN: | $82,338 |
Estimated per capita income in 2022: $40,332 (it was $23,558 in 2000)
West St. Paul city income, earnings, and wages data
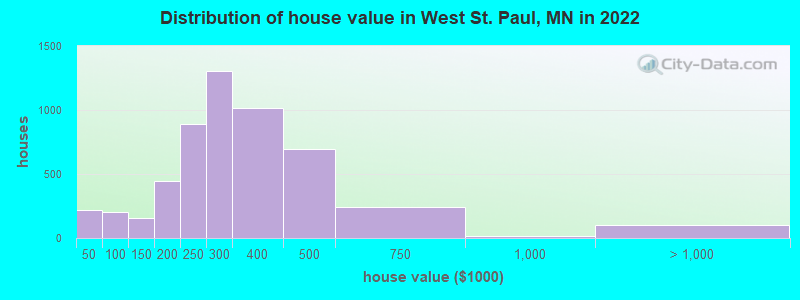
Estimated median house or condo value in 2022: $288,220 (it was $122,900 in 2000)
| West St. Paul: | $288,220 |
| MN: | $314,600 |
Mean prices in 2022: all housing units: $309,549; detached houses: $324,910; townhouses or other attached units: $233,882; in 2-unit structures: $526,612; in 3-to-4-unit structures: $168,392; in 5-or-more-unit structures: $204,403
Median gross rent in 2022: $1,244.
(6.7% for White Non-Hispanic residents, 19.8% for Black residents, 17.7% for Hispanic or Latino residents, 0.8% for American Indian residents, 15.1% for other race residents, 5.8% for two or more races residents)
Detailed information about poverty and poor residents in West St. Paul, MN


Compare current foreclosures near West St. Paul, MN:
| Photo | Address | Area | Beds / Baths | Price | Details |
|---|---|---|---|---|---|

|
#1
76th Street E. Unit
Inver Grove Heights, MN 55076
|
1,048 sq. feet
|
2 baths 2 beds |
$219,900
|
show details |

|
#2
W 44th St Apt 7
Minneapolis, MN 55410
|
710 sq. feet
|
1 baths 2 beds |
$154,900
|
show details |

|
#3
York Ave S Apt 122
Minneapolis, MN 55435
|
956 sq. feet
|
1 baths 1 beds |
$157,000
|
show details |

|
#4
Groveland Ave Apt 1708
Minneapolis, MN 55403
|
739 sq. feet
|
1 baths 1 beds |
$98,000
|
show details |

|
#5
26th Ave S
Minneapolis, MN 55406
|
1,232 sq. feet
|
1 baths 2 beds |
$309,900
|
show details |

|
#6
Maple Island Rd
Burnsville, MN 55306
|
1,302 sq. feet
|
2 baths 2 beds |
$309,900
|
show details |

|
#7
English Ave
Farmington, MN 55024
|
1,440 sq. feet
|
3 baths 2 beds |
$254,900
|
show details |

|
#8
Parklawn Ave Apt 109
Minneapolis, MN 55435
|
1,121 sq. feet
|
2 baths 2 beds |
$105,000
|
show details |

|
#9
Portland Ave # 1412
Minneapolis, MN 55415
|
1,333 sq. feet
|
2 baths 2 beds |
$424,900
|
show details |

|
#10
1st Ave S
Minneapolis, MN 55408
|
1,932 sq. feet
|
2 baths 3 beds |
$354,900
|
show details |
| Photo | Address | Area | Beds / Baths | Price | Details |
|---|---|---|---|---|---|

|
#11
Granite St
Saint Paul, MN 55117
|
2,136 sq. feet
|
2 baths 4 beds |
$172,000
|
show details |

|
#12
Oakland Ave
Minneapolis, MN 55407
|
1,170 sq. feet
|
1 baths 2 beds |
$199,500
|
show details |

|
#13
Bedford Ave
Minneapolis, MN 55436
|
1,726 sq. feet
|
1 baths 3 beds |
$299,900
|
show details |

|
#14
Wacouta St Unit Unit Gl-D
Saint Paul, MN 55101
|
- sq. feet
|
1 baths 1 beds |
$179,900
|
show details |

|
#15
Duvane Way
Lakeville, MN 55044
|
1,718 sq. feet
|
3 baths 4 beds |
show details | |

|
#16
Oakley Ave
Saint Paul, MN 55104
|
1,924 sq. feet
|
2 baths 4 beds |
show details | |

|
#17
Wheelock Ln
Saint Paul, MN 55117
|
907 sq. feet
|
1 baths 2 beds |
show details | |

|
#18
Rice Creek Ter
Saint Paul, MN 55112
|
2,248 sq. feet
|
2 baths 4 beds |
show details | |

|
#19
Garrett Ave
Saint Paul, MN 55124
|
960 sq. feet
|
2 baths 2 beds |
show details | |

|
#20
Wedgewood Dr
Saint Paul, MN 55115
|
1,256 sq. feet
|
2 baths 4 beds |
show details |
| Photo | Address | Area | Beds / Baths | Price | Details |
|---|---|---|---|---|---|

|
#21
Bedford St
Saint Paul, MN 55130
|
- sq. feet
|
1 baths 3 beds |
show details | |

|
#22
Brooklyn Blvd
Minneapolis, MN 55429
|
1,232 sq. feet
|
1 baths 4 beds |
show details | |

|
#23
W Diamond Lake Rd
Minneapolis, MN 55419
|
1,288 sq. feet
|
2 baths 2 beds |
show details | |

|
#24
39th Ave N
Minneapolis, MN 55427
|
1,272 sq. feet
|
2 baths 4 beds |
show details | |

|
#25
Penn Ave N
Minneapolis, MN 55411
|
1,089 sq. feet
|
1 baths 3 beds |
show details | |

|
#26
Bedford St
Saint Paul, MN 55130
|
1,694 sq. feet
|
2 baths 4 beds |
show details | |

|
#27
53 1/2 Avenue NE
Minneapolis, MN 55421
|
1,041 sq. feet
|
2 baths 3 beds |
show details | |

|
#28
172nd St W
Farmington, MN 55024
|
1,084 sq. feet
|
2 baths 3 beds |
show details | |

|
#29
W 104th St
Minneapolis, MN 55438
|
1,402 sq. feet
|
2 baths 3 beds |
show details | |

|
#30
Margaret St
Saint Paul, MN 55106
|
1,602 sq. feet
|
2 baths 3 beds |
show details |
| Photo | Address | Area | Beds / Baths | Price | Details |
|---|---|---|---|---|---|

|
#31
Gladiola Ct
Saint Paul, MN 55124
|
1,680 sq. feet
|
2 baths 4 beds |
show details | |

|
#32
Newbury Rd
Saint Paul, MN 55125
|
1,597 sq. feet
|
2 baths 2 beds |
show details | |

|
#33
Jocelyn Ave S
Cottage Grove, MN 55016
|
1,121 sq. feet
|
2 baths 3 beds |
show details | |

|
#34
Snowshoe Ln E
Saint Paul, MN 55119
|
1,595 sq. feet
|
2 baths 3 beds |
show details | |

|
#35
Lake St
Saint Paul, MN 55119
|
1,008 sq. feet
|
2 baths 3 beds |
show details | |

|
#36
17th Ave S
Minneapolis, MN 55423
|
1,191 sq. feet
|
1 baths 3 beds |
show details | |

|
#37
Walden St
Burnsville, MN 55337
|
1,680 sq. feet
|
3 baths 3 beds |
show details | |

|
#38
Jackson Ave S
Hopkins, MN 55343
|
1,104 sq. feet
|
2 baths 4 beds |
show details | |

|
#39
Walden St
Burnsville, MN 55337
|
1,704 sq. feet
|
2 baths 3 beds |
show details | |

|
#40
James Ave N
Minneapolis, MN 55412
|
1,440 sq. feet
|
1 baths 2 beds |
show details |
| Photo | Address | Area | Beds / Baths | Price | Details |
|---|---|---|---|---|---|

|
#41
Ash St
Saint Paul, MN 55126
|
1,353 sq. feet
|
1 baths 3 beds |
show details | |

|
#42
Aldrich Ave N
Minneapolis, MN 55412
|
1,338 sq. feet
|
1 baths 3 beds |
show details | |

|
#43
18th Ave S
Minneapolis, MN 55407
|
- sq. feet
|
3 baths 4 beds |
show details | |

|
#44
Bryant Ave N
Minneapolis, MN 55430
|
1,180 sq. feet
|
1 baths 3 beds |
show details | |

|
#45
Girard Ave N
Minneapolis, MN 55411
|
768 sq. feet
|
1 baths 2 beds |
show details | |

|
#46
Overton Dr NE
Minneapolis, MN 55432
|
1,286 sq. feet
|
2 baths 3 beds |
show details | |

|
#47
Edmund Ave
Saint Paul, MN 55104
|
1,882 sq. feet
|
2 baths 4 beds |
show details | |

|
#48
Wilson Ave
Saint Paul, MN 55106
|
833 sq. feet
|
2 baths 2 beds |
show details | |

|
#49
Lake Shore Dr S Apt 1012
Minneapolis, MN 55423
|
1,040 sq. feet
|
1 baths 2 beds |
show details | |

|
Check over 1 million property listings on Foreclosure.com!
|
browse all offers | |||


- 13,61964.8%White alone
- 4,45621.2%Hispanic
- 1,4426.9%Black alone
- 9064.3%Two or more races
- 4582.2%Asian alone
- 2041.0%Other race alone
- 720.3%American Indian alone
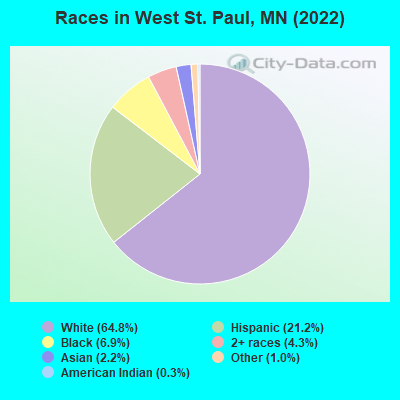
Races in West St. Paul detailed stats: ancestries, foreign born residents, place of birth
According to our research of Minnesota and other state lists, there was 1 registered sex offender living in West St. Paul, Minnesota as of May 19, 2024.
The ratio of all residents to sex offenders in West St. Paul is 20,071 to 1.
The ratio of registered sex offenders to all residents in this city is much lower than the state average.
Type |
2009 |
2010 |
2011 |
2012 |
2013 |
2014 |
2015 |
2016 |
2017 |
2018 |
2019 |
2020 |
2021 |
2022 |
|---|---|---|---|---|---|---|---|---|---|---|---|---|---|---|
| Murders (per 100,000) | 0 (0.0) | 0 (0.0) | 0 (0.0) | 0 (0.0) | 1 (5.1) | 2 (10.1) | 1 (5.0) | 0 (0.0) | 1 (5.1) | 0 (0.0) | 1 (5.1) | 2 (10.0) | 1 (5.0) | 0 (0.0) |
| Rapes (per 100,000) | 9 (47.7) | 5 (25.6) | 10 (50.8) | 13 (65.5) | 11 (55.7) | 8 (40.4) | 13 (65.4) | 9 (45.5) | 11 (55.6) | 18 (90.9) | 8 (40.6) | 15 (75.0) | 18 (90.7) | 14 (66.3) |
| Robberies (per 100,000) | 26 (137.8) | 20 (102.4) | 17 (86.3) | 17 (85.7) | 16 (81.0) | 18 (90.9) | 19 (95.6) | 20 (101.2) | 26 (131.5) | 15 (75.8) | 28 (142.2) | 25 (125.0) | 21 (105.8) | 17 (80.5) |
| Assaults (per 100,000) | 20 (106.0) | 19 (97.2) | 34 (172.7) | 35 (176.5) | 56 (283.4) | 42 (212.0) | 54 (271.8) | 44 (222.6) | 51 (257.9) | 41 (207.1) | 45 (228.5) | 43 (214.9) | 67 (337.7) | 47 (222.6) |
| Burglaries (per 100,000) | 107 (567.0) | 110 (562.9) | 76 (386.0) | 103 (519.3) | 63 (318.8) | 123 (621.0) | 141 (709.6) | 116 (587.0) | 117 (591.6) | 102 (515.2) | 101 (512.8) | 89 (444.8) | 90 (453.6) | 68 (322.1) |
| Thefts (per 100,000) | 1,048 (5,553) | 773 (3,956) | 515 (2,615) | 737 (3,716) | 856 (4,332) | 853 (4,306) | 963 (4,846) | 821 (4,154) | 797 (4,030) | 791 (3,995) | 1,184 (6,012) | 1,358 (6,788) | 1,198 (6,038) | 678 (3,211) |
| Auto thefts (per 100,000) | 55 (291.5) | 45 (230.3) | 60 (304.7) | 91 (458.8) | 43 (217.6) | 67 (338.2) | 79 (397.6) | 65 (328.9) | 57 (288.2) | 67 (338.4) | 88 (446.8) | 113 (564.8) | 102 (514.1) | 131 (620.5) |
| Arson (per 100,000) | 1 (5.3) | 0 (0.0) | 1 (5.1) | 1 (5.0) | 3 (15.2) | 5 (25.2) | 4 (20.1) | 3 (15.2) | 4 (20.2) | 0 (0.0) | 4 (20.3) | 0 (0.0) | 3 (15.1) | 4 (18.9) |
| City-Data.com crime index | 385.8 | 286.7 | 257.1 | 335.1 | 348.6 | 365.0 | 420.8 | 344.9 | 371.3 | 359.8 | 443.1 | 508.3 | 496.4 | 322.4 |
The City-Data.com crime index weighs serious crimes and violent crimes more heavily. Higher means more crime, U.S. average is 246.1. It adjusts for the number of visitors and daily workers commuting into cities.
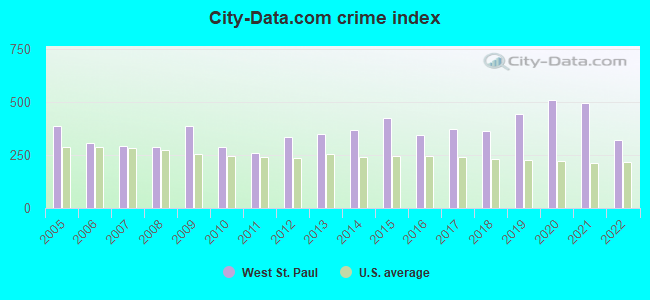
Crime rate in West St. Paul detailed stats: murders, rapes, robberies, assaults, burglaries, thefts, arson
Full-time law enforcement employees in 2021, including police officers: 38 (34 officers - 30 male; 4 female).
| Officers per 1,000 residents here: | 1.71 |
| Minnesota average: | 1.76 |
 Recent articles from our blog. Our writers, many of them Ph.D. graduates or candidates, create easy-to-read articles on a wide variety of topics.

 | Cottage Grove , MN 2022 (5 replies) |
| Is St. Paul a better place to live than Minneapolis now? (29 replies) |
| Is Dunkin Donuts coming? (119 replies) |
| Walkable and outdoorsy neighborhoods full of families with kids? (11 replies) |
| The best burrito in the Twin Cities (33 replies) |
| REAL Commute time West St. Paul to W Cty Rd E2/35W (2 replies) |
Latest news from West St. Paul, MN collected exclusively by city-data.com from local newspapers, TV, and radio stations
West St. Paul, MN City Guides:
Ancestries: German (18.8%), Irish (6.8%), Norwegian (5.0%), European (3.4%), American (3.2%), Swedish (2.6%).
Current Local Time: CST time zone
Incorporated in 1889
Elevation: 1020 feet
Land area: 5.01 square miles.
Population density: 4,351 people per square mile (average).
1,842 residents are foreign born (4.6% Latin America, 1.4% Europe, 1.3% Asia, 1.2% Africa).
| This city: | 8.8% |
| Minnesota: | 8.5% |
Median real estate property taxes paid for housing units with mortgages in 2022: $2,655 (0.9%)
Median real estate property taxes paid for housing units with no mortgage in 2022: $3,296 (1.1%)
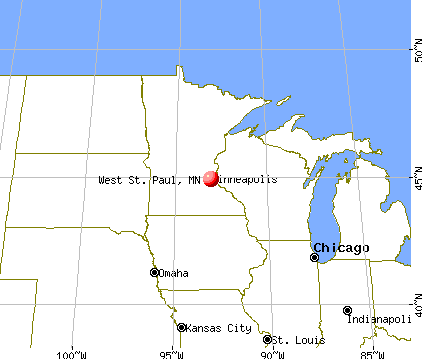
Nearest city with pop. 50,000+: St. Paul, MN  (3.5 miles , pop. 287,151).
Nearest city with pop. 1,000,000+: Chicago, IL (344.7 miles , pop. 2,896,016).
Nearest cities:
), ), ), Latitude: 44.91 N, Longitude: 93.09 W
Daytime population change due to commuting: -1,419 (-6.8%)
Workers who live and work in this city: 3,233 (29.9%)
West St. Paul, Minnesota accommodation & food services, waste management - Economy and Business Data
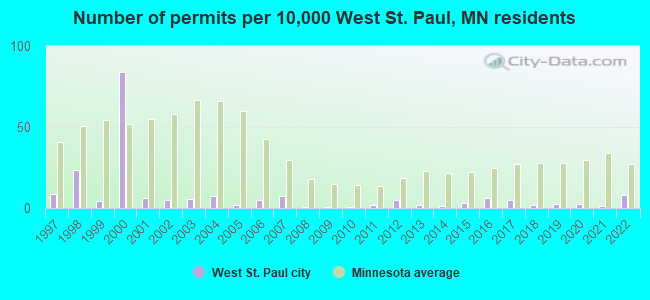
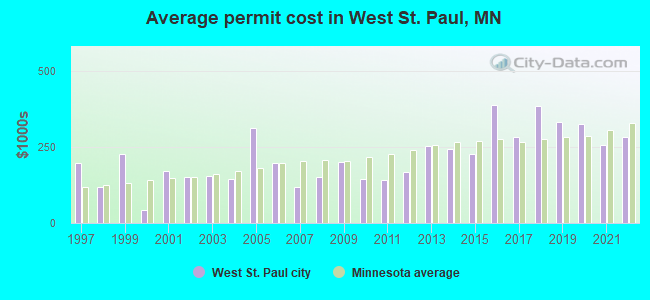
Single-family new house construction building permits:
- 2022: 15 buildings, average cost: $283,300
- 2021: 2 buildings, average cost: $257,800
- 2020: 5 buildings, average cost: $327,800
- 2019: 5 buildings, average cost: $333,300
- 2018: 4 buildings, average cost: $385,600
- 2017: 10 buildings, average cost: $283,500
- 2016: 12 buildings, average cost: $389,800
- 2015: 6 buildings, average cost: $228,100
- 2014: 2 buildings, average cost: $245,000
- 2013: 4 buildings, average cost: $254,700
- 2012: 9 buildings, average cost: $167,800
- 2011: 4 buildings, average cost: $143,300
- 2010: 1 building, cost: $145,000
- 2009: 1 building, cost: $200,000
- 2008: 1 building, cost: $150,000
- 2007: 14 buildings, average cost: $119,600
- 2006: 10 buildings, average cost: $198,100
- 2005: 3 buildings, average cost: $313,300
- 2004: 14 buildings, average cost: $145,900
- 2003: 11 buildings, average cost: $155,600
- 2002: 10 buildings, average cost: $151,000
- 2001: 12 buildings, average cost: $171,700
- 2000: 163 buildings, average cost: $42,800
- 1999: 8 buildings, average cost: $228,300
- 1998: 45 buildings, average cost: $119,200
- 1997: 17 buildings, average cost: $198,600
| Here: | 2.2% |
| Minnesota: | 2.6% |
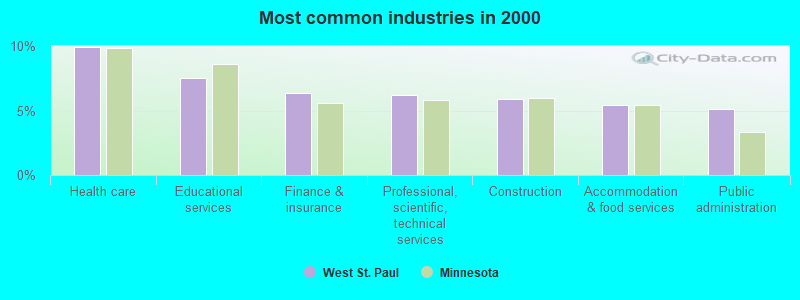
- Health care (9.9%)
- Educational services (7.5%)
- Finance & insurance (6.4%)
- Professional, scientific, technical services (6.2%)
- Construction (5.9%)
- Accommodation & food services (5.4%)
- Public administration (5.1%)
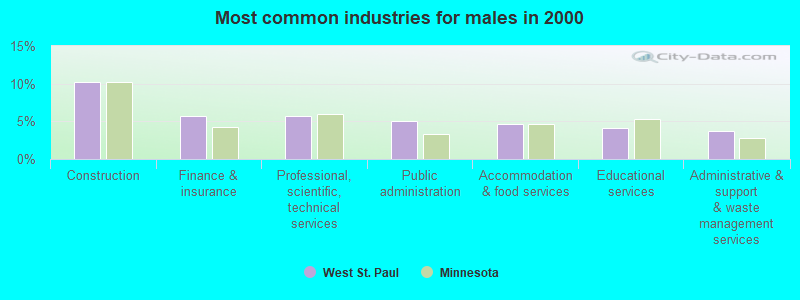
- Construction (10.2%)
- Finance & insurance (5.8%)
- Professional, scientific, technical services (5.7%)
- Public administration (5.0%)
- Accommodation & food services (4.7%)
- Educational services (4.1%)
- Administrative & support & waste management services (3.7%)
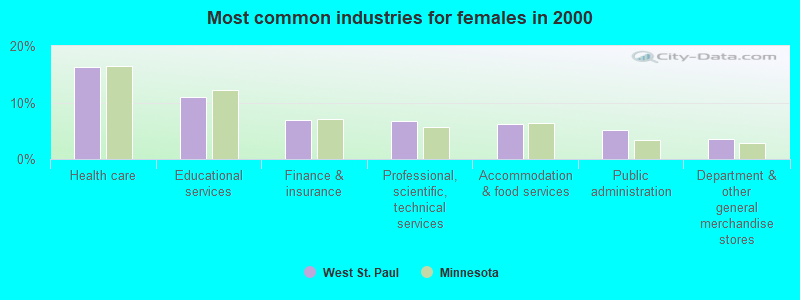
- Health care (16.3%)
- Educational services (10.9%)
- Finance & insurance (7.0%)
- Professional, scientific, technical services (6.7%)
- Accommodation & food services (6.2%)
- Public administration (5.1%)
- Department & other general merchandise stores (3.6%)
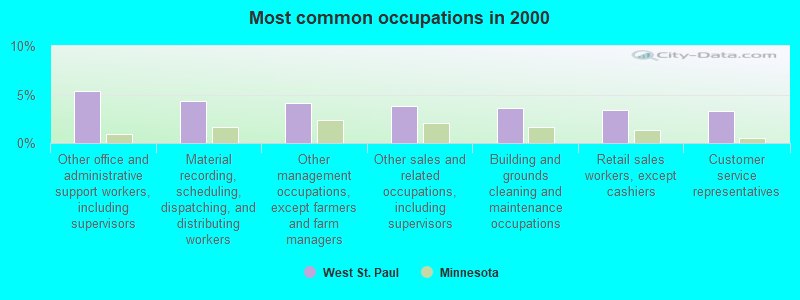
- Other office and administrative support workers, including supervisors (5.4%)
- Material recording, scheduling, dispatching, and distributing workers (4.3%)
- Other management occupations, except farmers and farm managers (4.1%)
- Other sales and related occupations, including supervisors (3.8%)
- Building and grounds cleaning and maintenance occupations (3.6%)
- Retail sales workers, except cashiers (3.4%)
- Customer service representatives (3.3%)
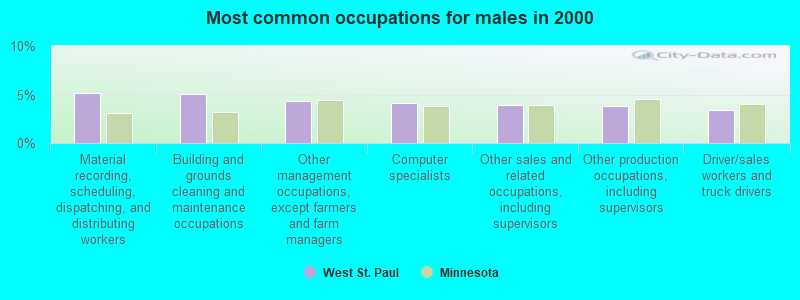
- Material recording, scheduling, dispatching, and distributing workers (5.1%)
- Building and grounds cleaning and maintenance occupations (5.0%)
- Other management occupations, except farmers and farm managers (4.3%)
- Computer specialists (4.1%)
- Other sales and related occupations, including supervisors (4.0%)
- Other production occupations, including supervisors (3.8%)
- Driver/sales workers and truck drivers (3.4%)

- Other office and administrative support workers, including supervisors (7.5%)
- Secretaries and administrative assistants (5.5%)
- Information and record clerks, except customer service representatives (4.9%)
- Registered nurses (4.1%)
- Other management occupations, except farmers and farm managers (4.0%)
- Other sales and related occupations, including supervisors (3.7%)
- Customer service representatives (3.7%)
Average climate in West St. Paul, Minnesota
Based on data reported by over 4,000 weather stations


|
|


(lower is better)
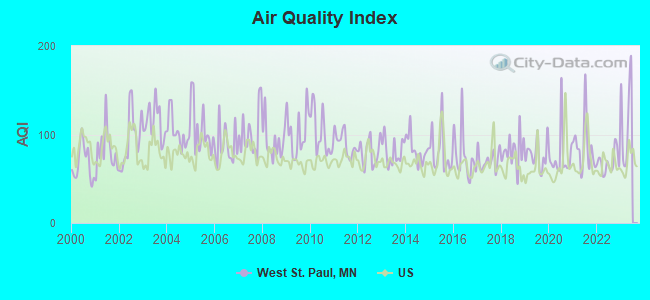
Air Quality Index (AQI) level in 2022 was 68.4. This is about average.
| City: | 68.4 |
| U.S.: | 72.6 |
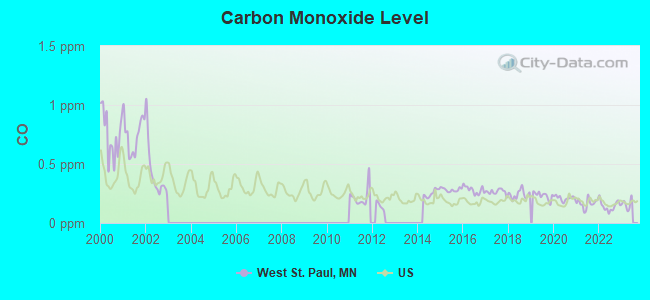
Carbon Monoxide (CO) [ppm] level in 2022 was 0.144. This is significantly better than average. Closest monitor was 2.6 miles away from the city center.
| City: | 0.144 |
| U.S.: | 0.251 |
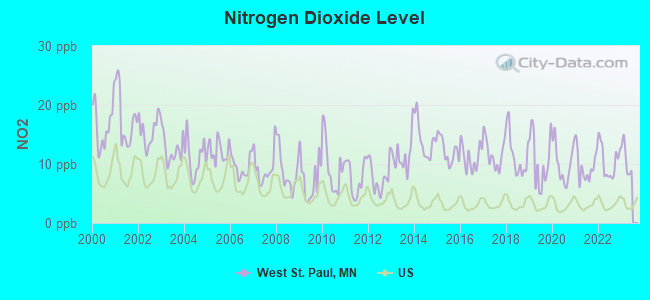
Nitrogen Dioxide (NO2) [ppb] level in 2022 was 10.4. This is significantly worse than average. Closest monitor was 1.3 miles away from the city center.
| City: | 10.4 |
| U.S.: | 5.1 |
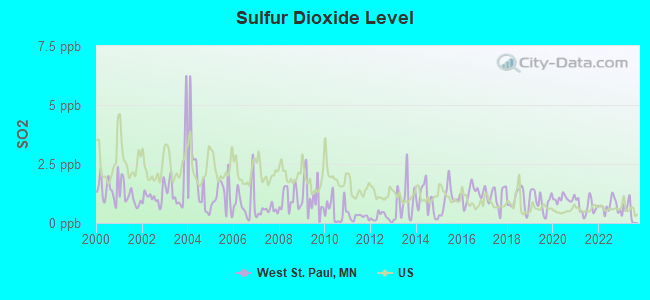
Sulfur Dioxide (SO2) [ppb] level in 2022 was 0.729. This is significantly better than average. Closest monitor was 1.3 miles away from the city center.
| City: | 0.729 |
| U.S.: | 1.515 |
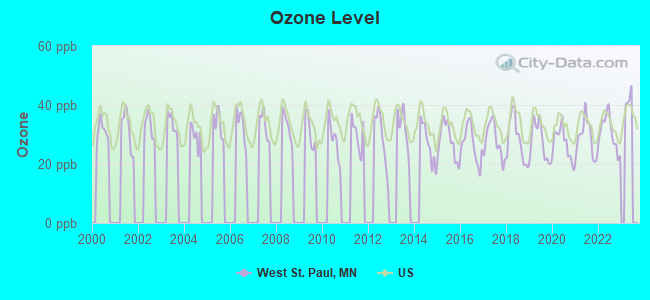
Ozone [ppb] level in 2022 was 30.7. This is about average. Closest monitor was 2.7 miles away from the city center.
| City: | 30.7 |
| U.S.: | 33.3 |
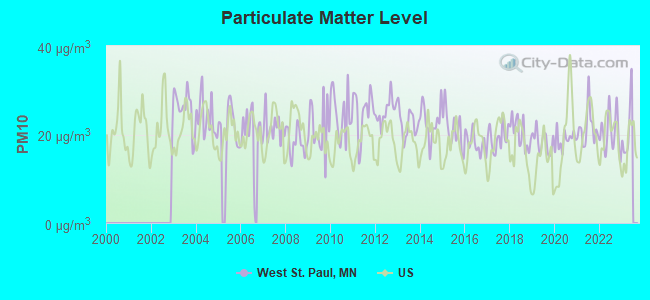
Particulate Matter (PM10) [µg/m3] level in 2022 was 20.4. This is about average. Closest monitor was 2.7 miles away from the city center.
| City: | 20.4 |
| U.S.: | 19.2 |
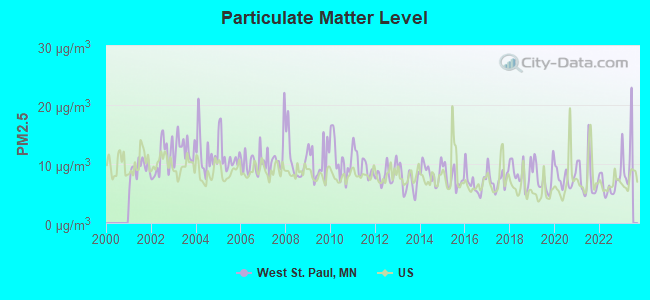
Particulate Matter (PM2.5) [µg/m3] level in 2022 was 6.38. This is better than average. Closest monitor was 1.7 miles away from the city center.
| City: | 6.38 |
| U.S.: | 8.11 |
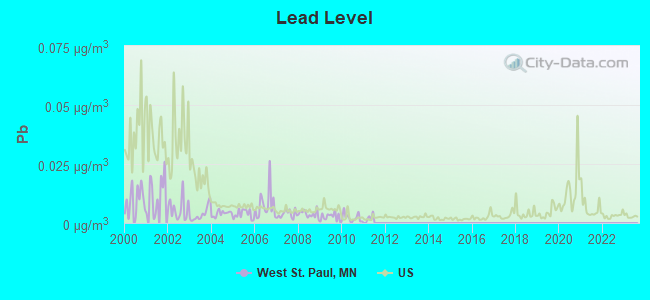
Lead (Pb) [µg/m3] level in 2010 was 0.00217. This is significantly better than average. Closest monitor was 1.3 miles away from the city center.
| City: | 0.00217 |
| U.S.: | 0.00931 |
Tornado activity:
West St. Paul-area historical tornado activity is slightly above Minnesota state average. It is 30% greater than the overall U.S. average.
On 5/6/1965, a category F4 (max. wind speeds 207-260 mph) tornado 12.7 miles away from the West St. Paul city center killed 3 people and injured 175 people and caused between $5,000,000 and $50,000,000 in damages.
On 5/6/1965, a category F4 tornado 15.2 miles away from the city center killed 6 people and injured 158 people and caused between $5,000,000 and $50,000,000 in damages.
Earthquake activity:
West St. Paul-area historical earthquake activity is significantly above Minnesota state average. It is 57% smaller than the overall U.S. average.On 7/9/1975 at 14:54:15, a magnitude 4.6 (4.6 MB, Class: Light, Intensity: IV - V) earthquake occurred 153.1 miles away from the city center
On 6/5/1993 at 01:24:53, a magnitude 4.1 (4.1 LG, Depth: 6.2 mi) earthquake occurred 164.7 miles away from the city center
On 3/4/1983 at 06:32:18, a magnitude 4.6 (4.4 MB, 4.6 LG, 4.4 ML) earthquake occurred 315.1 miles away from West St. Paul center
On 10/20/1995 at 15:57:18, a magnitude 3.7 (3.7 LG, Depth: 3.1 mi, Class: Light, Intensity: II - III) earthquake occurred 193.4 miles away from the city center
On 2/9/1994 at 08:45:35, a magnitude 3.1 (3.1 LG, Depth: 3.1 mi) earthquake occurred 93.8 miles away from the city center
On 11/3/2002 at 20:41:56, a magnitude 4.3 (4.3 MB, Depth: 3.1 mi) earthquake occurred 325.3 miles away from the city center
Magnitude types: regional Lg-wave magnitude (LG), body-wave magnitude (MB), local magnitude (ML)
Natural disasters:
The number of natural disasters in Dakota County (15) is near the US average (15).Major Disasters (Presidential) Declared: 11
Emergencies Declared: 3
Causes of natural disasters: Floods: 11, Storms: 7, Tornadoes: 5, Drought: 1, Hurricane: 1, Wind: 1, Other: 1 (Note: some incidents may be assigned to more than one category).

Hospitals and medical centers near West St. Paul:
- DCI EMERSON (Hospital, about 1 miles away; WEST SAINT PAUL, MN)
- WEST ST PAUL DIALYSIS OF DAVITA (Dialysis Facility, about 1 miles away; WEST ST PAUL, MN)
- FMC - WEST ST PAUL DIALYSIS (Dialysis Facility, about 1 miles away; WEST ST PAUL, MN)
- DIVINE REDEEMER MEMORIAL HOSPITAL (Hospital, about 2 miles away; SOUTH ST PAUL, MN)
- CERENITY CARE CTR - BETHESDA (Nursing Home, about 2 miles away; SOUTH ST PAUL, MN)
- WILDER RESIDENCE WEST (Nursing Home, about 2 miles away; SAINT PAUL, MN)
- CERENITY CARE CENTER ON HUMBOLDT (Nursing Home, about 2 miles away; SAINT PAUL, MN)
Amtrak station near West St. Paul:
Colleges/universities with over 2000 students nearest to West St. Paul:
- Saint Paul College (about 4 miles; Saint Paul, MN; Full-time enrollment: 4,778)
- Metropolitan State University (about 4 miles; Saint Paul, MN; FT enrollment: 6,159)
- Concordia University-Saint Paul (about 5 miles; Saint Paul, MN; FT enrollment: 2,501)
- Macalester College (about 5 miles; Saint Paul, MN; FT enrollment: 2,174)
- St Catherine University (about 5 miles; Saint Paul, MN; FT enrollment: 3,771)
- Hamline University (about 6 miles; Saint Paul, MN; FT enrollment: 3,818)
- University of St Thomas (about 6 miles; Saint Paul, MN; FT enrollment: 8,762)
Public high schools in West St. Paul:
- WEST HEIGHTS ALC (Location: 150 MARIE AVE, Grades: 9-12)
- WEST HEIGHTS EXTENDED DAY (Location: 150 MARIE AVE E, Grades: 9-12)
- BLUESKY CHARTER SCHOOL (Location: 33 WENTWORTH AVE E STE 100, Grades: KG-12, Charter school)
- ACADEMIC ARTS HIGH SCHOOL (Location: 60 E MARIE AVE, STE #220, Grades: 7-12, Charter school)
- SPECIAL EDUCATION PROGRAM (Location: 1897 DELAWARE, Grades: PK-12)
- HENRY SIBLEY HIGH SCHOOL (Location: 1897 DELAWARE AVE, Grades: 9-12)
- W ST. PAUL AREA LEARNING CNTR. (Location: 1897 DELAWARE AVE, Grades: 9-12)
- BRANCH OUT TRANSITIONAL SERVICES (Location: 150 E MARIE AVE, Grades: 12)
Private high school in West St. Paul:
- ST CROIX LUTHERAN HIGH SCHOOL (Students: 478, Location: 1200 OAKDALE AVE, Grades: 6-12)
Public elementary/middle schools in West St. Paul:
Private elementary/middle schools in West St. Paul:
- ST JOSEPH'S SCHOOL (Students: 580, Location: 1138 SEMINOLE AVE, Grades: PK-8)
- CROWN OF LIFE LUTHERAN SCHOOL (Students: 157, Location: 115 CRUSADER AVE W, Grades: PK-8)
- ST MICHAEL ELEMENTARY SCHOOL (Students: 91, Location: 335 HURLEY AVE E, Grades: KG-8)
Points of interest:
Notable locations in West St. Paul: Thompson Oaks Golf Course (A), Southview Country Club (B), South Metro Fire Department Station 1 Headquarters (C). Display/hide their locations on the map
Shopping Centers: Doddway Shopping Center (1), Robert Square Shopping Center (2), Signal Hills Shopping Center (3), South Robert Plaza Shopping Center (4), Southview Square Shopping Center (5), Westview Value Center Shopping Center (6). Display/hide their locations on the map
Churches in West St. Paul include: Saint Joseph Church (A), Saint George Antiochian Orthodox Christian Church (B), Riverview Baptist Church (C), Oakdale Community Church (D), Bethel Baptist Church (E), Bahai Faith (F), Iglesia Apostolica (G), Faith United Methodist Church (H). Display/hide their locations on the map
Lakes: Lilly Lake (A), Thompson Lake (B). Display/hide their locations on the map
Parks in West St. Paul include: Albert Park (1), Dodd Park (2), Wescheke Park (3), Orme Park (4), Mud Lake Park (5), Harmon Field (6), Charles Matson Field (7), Emerson Park (8), Thompson County Park (9). Display/hide their locations on the map
Birthplace of: Harold Stassen - Soilder, Joan Kroc - Food industry businessman, Randy Skarda - Ice hockey player, Tom Gibis - Voice actor.
| This city: | 2.2 people |
| Minnesota: | 2.5 people |
| This city: | 55.7% |
| Whole state: | 64.6% |
| This city: | 6.9% |
| Whole state: | 6.9% |
Likely homosexual households (counted as self-reported same-sex unmarried-partner households)
- Lesbian couples: 0.6% of all households
- Gay men: 0.3% of all households
People in group quarters in West St. Paul in 2010:
- 220 people in nursing facilities/skilled-nursing facilities
- 47 people in group homes intended for adults
- 27 people in residential treatment centers for adults
- 14 people in other noninstitutional facilities
People in group quarters in West St. Paul in 2000:
- 219 people in nursing homes
- 128 people in homes for the mentally retarded
- 6 people in other group homes
Banks with branches in West St. Paul (2011 data):
- TCF National Bank: West St. Paul Cub Branch at 2021 S. Robert Street, branch established on 1989/10/30; Southview Square Branch at 1503 South Robert Street, branch established on 1923/01/01. Info updated 2009/11/23: Bank assets: $19,007.0 mil, Deposits: $12,377.0 mil, headquarters in Sioux Falls, SD, positive income, Commercial Lending Specialization, 441 total offices, Holding Company: Tcf Financial Corporation
- Wells Fargo Bank, National Association: West St. Paul Branch at 1710 South Robert Street, branch established on 1985/12/31. Info updated 2011/04/05: Bank assets: $1,161,490.0 mil, Deposits: $905,653.0 mil, headquarters in Sioux Falls, SD, positive income, 6395 total offices, Holding Company: Wells Fargo & Company
For population 15 years and over in West St. Paul:
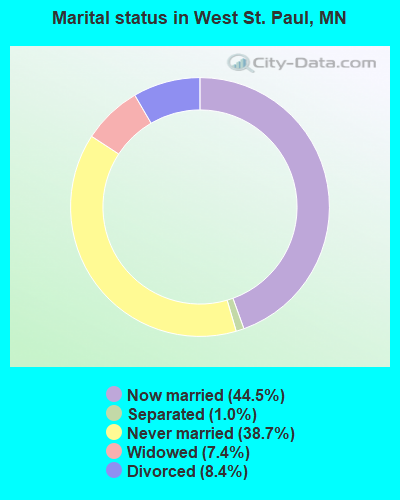
- Never married: 38.7%
- Now married: 44.5%
- Separated: 1.0%
- Widowed: 7.4%
- Divorced: 8.4%
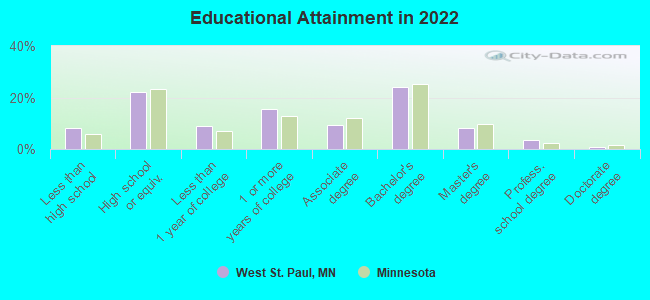
For population 25 years and over in West St. Paul:
- High school or higher: 92.4%
- Bachelor's degree or higher: 35.4%
- Graduate or professional degree: 11.9%
- Unemployed: 4.1%
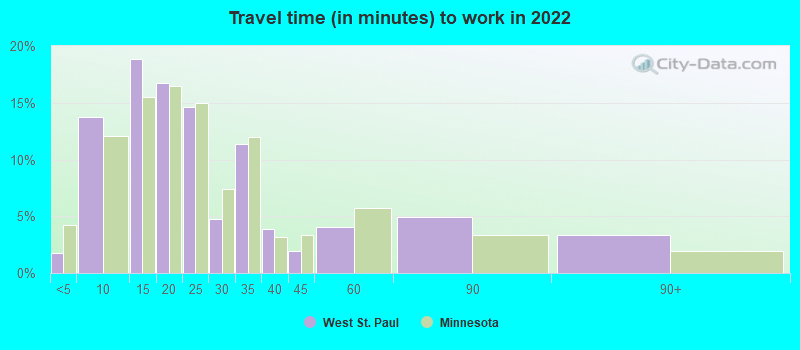
- Mean travel time to work (commute): 17.8 minutes
| Here: | 10.1 |
| Minnesota average: | 10.9 |
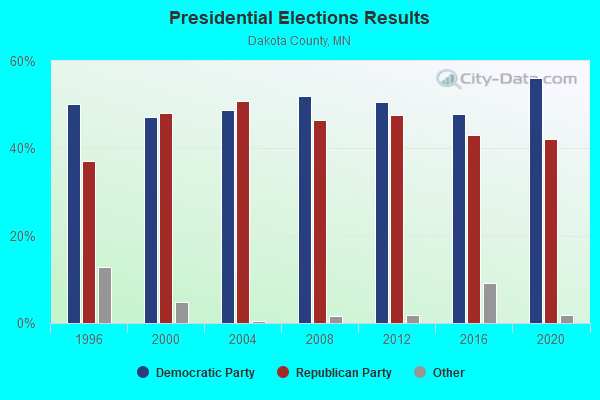
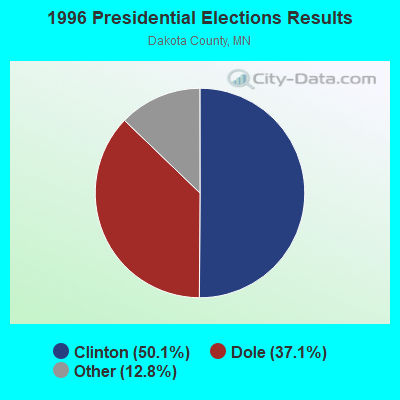
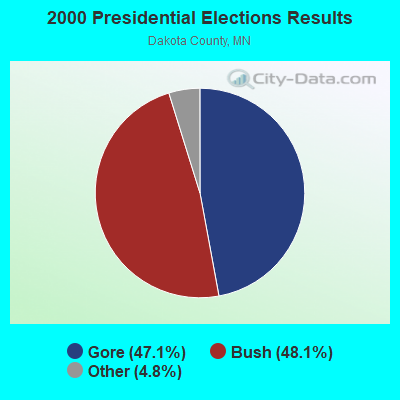

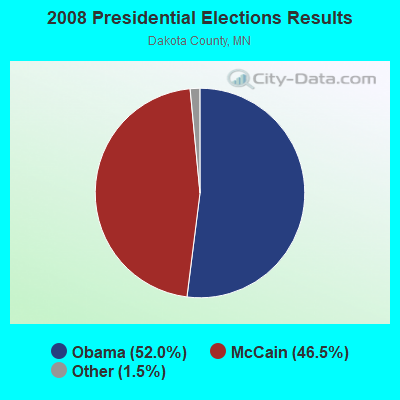
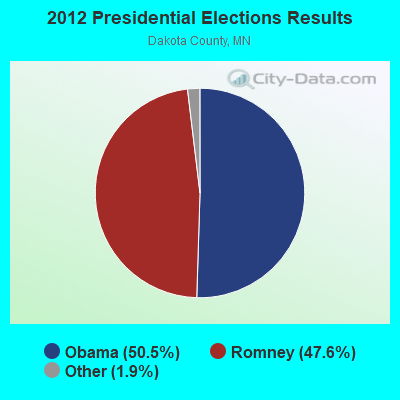
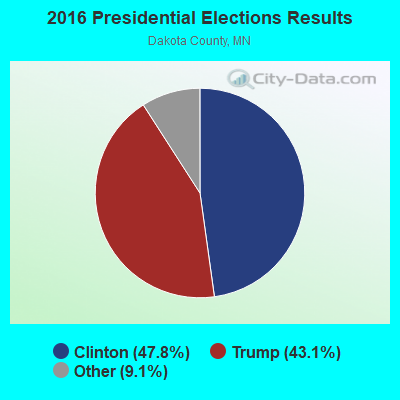
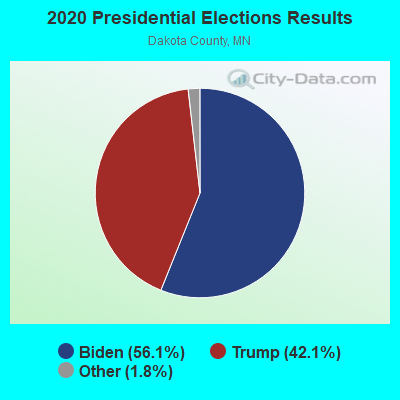
Graphs represent county-level data. Detailed 2008 Election Results
Religion statistics for West St. Paul, MN (based on Dakota County data)
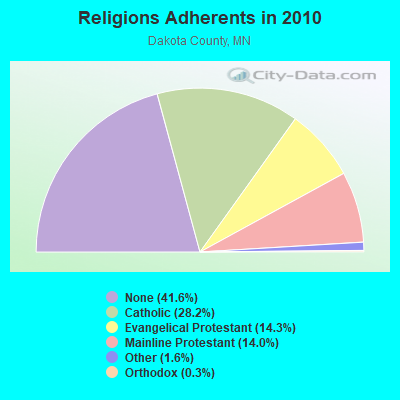
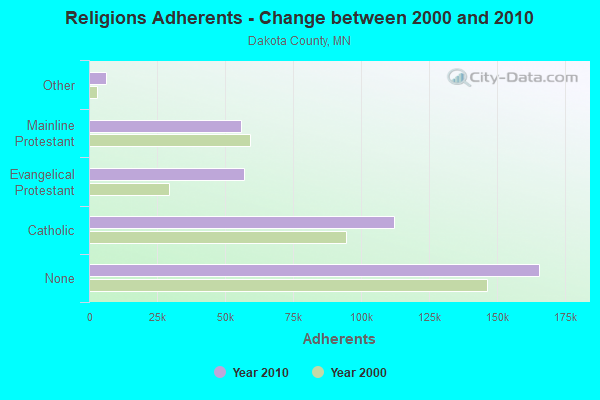
| Religion | Adherents | Congregations |
|---|---|---|
| Catholic | 112,264 | 18 |
| Evangelical Protestant | 57,007 | 111 |
| Mainline Protestant | 55,850 | 56 |
| Other | 6,321 | 27 |
| Orthodox | 1,173 | 5 |
| Black Protestant | 313 | 2 |
| None | 165,624 | - |
Food Environment Statistics:
| Dakota County: | 0.90 / 10,000 pop. |
| Minnesota: | 1.83 / 10,000 pop. |
| Dakota County: | 0.13 / 10,000 pop. |
| State: | 0.13 / 10,000 pop. |
| Dakota County: | 0.15 / 10,000 pop. |
| Minnesota: | 0.49 / 10,000 pop. |
| Dakota County: | 3.03 / 10,000 pop. |
| Minnesota: | 3.90 / 10,000 pop. |
| This county: | 5.03 / 10,000 pop. |
| Minnesota: | 6.98 / 10,000 pop. |
| Here: | 6.1% |
| Minnesota: | 6.5% |
| This county: | 25.6% |
| State: | 25.9% |
| Dakota County: | 12.6% |
| Minnesota: | 13.0% |
Health and Nutrition:
| West St. Paul: | 51.0% |
| Minnesota: | 50.6% |
| Here: | 49.0% |
| Minnesota: | 48.4% |
| West St. Paul: | 28.4 |
| Minnesota: | 28.5 |
| West St. Paul: | 20.3% |
| Minnesota: | 21.0% |
| West St. Paul: | 10.2% |
| State: | 9.8% |
| This city: | 6.9 |
| Minnesota: | 6.8 |
| This city: | 33.8% |
| Minnesota: | 33.5% |
| West St. Paul: | 57.3% |
| State: | 57.7% |
| West St. Paul: | 78.6% |
| Minnesota: | 79.3% |
More about Health and Nutrition of West St. Paul, MN Residents
West St. Paul government finances - Expenditure in 2021 (per resident):
- Construction - General Public Buildings: $1,208,000 ($55.43)
Regular Highways: $681,000 ($31.25)
Parks and Recreation: $465,000 ($21.34)
Miscellaneous Commercial Activities - Other: $336,000 ($15.42)
General - Other: $68,000 ($3.12)
- Current Operations - Police Protection: $5,186,000 ($237.96)
Sewerage: $3,549,000 ($162.84)
Parks and Recreation: $2,029,000 ($93.10)
Central Staff Services: $1,831,000 ($84.01)
Regular Highways: $1,669,000 ($76.58)
Solid Waste Management: $1,413,000 ($64.83)
Financial Administration: $730,000 ($33.50)
Housing and Community Development: $540,000 ($24.78)
Protective Inspection and Regulation - Other: $380,000 ($17.44)
Judicial and Legal Services: $303,000 ($13.90)
Miscellaneous Commercial Activities - Other: $298,000 ($13.67)
General Public Buildings: $158,000 ($7.25)
- General - Interest on Debt: $1,597,000 ($73.28)
- Intergovernmental to Local - Other - Local Fire Protection: $2,582,000 ($118.47)
Other - Police Protection: $728,000 ($33.40)
Other - Regular Highways: $571,000 ($26.20)
Other - Housing and Community Development: $54,000 ($2.48)
Other - General - Other: $53,000 ($2.43)
Other - Financial Administration: $36,000 ($1.65)
Other - Parks and Recreation: $18,000 ($0.83)
Other - Central Staff Services: $5,000 ($0.23)
Other - Solid Waste Management: $2,000 ($0.09)
- Other Capital Outlay - Parks and Recreation: $619,000 ($28.40)
Central Staff Services: $299,000 ($13.72)
Regular Highways: $249,000 ($11.43)
Police Protection: $121,000 ($5.55)
- Total Salaries and Wages: $7,428,000 ($340.83)
West St. Paul government finances - Revenue in 2021 (per resident):
- Charges - Sewerage: $4,390,000 ($201.43)
Parks and Recreation: $662,000 ($30.38)
Other: $468,000 ($21.47)
- Federal Intergovernmental - Other: $1,665,000 ($76.40)
- Local Intergovernmental - Other: $488,000 ($22.39)
- Miscellaneous - General Revenue - Other: $1,625,000 ($74.56)
Interest Earnings: $1,128,000 ($51.76)
Special Assessments: $512,000 ($23.49)
Rents: $184,000 ($8.44)
Fines and Forfeits: $47,000 ($2.16)
Sale of Property: $44,000 ($2.02)
Donations From Private Sources: $23,000 ($1.06)
- State Intergovernmental - General Local Government Support: $1,457,000 ($66.85)
Highways: $573,000 ($26.29)
Other: $359,000 ($16.47)
- Tax - Property: $18,387,000 ($843.67)
General Sales and Gross Receipts: $1,479,000 ($67.86)
Other License: $699,000 ($32.07)
Alcoholic Beverage License: $68,000 ($3.12)
Occupation and Business License - Other: $59,000 ($2.71)
Public Utility License: $20,000 ($0.92)
West St. Paul government finances - Debt in 2021 (per resident):
- Long Term Debt - Beginning Outstanding - Unspecified Public Purpose: $59,855,000 ($2746.40)
Outstanding Unspecified Public Purpose: $55,890,000 ($2564.47)
Beginning Outstanding - Public Debt for Private Purpose: $12,855,000 ($589.84)
Outstanding Nonguaranteed - Industrial Revenue: $11,940,000 ($547.86)
Retired Unspecified Public Purpose: $3,965,000 ($181.93)
Retired Nonguaranteed - Public Debt for Private Purpose: $915,000 ($41.98)
West St. Paul government finances - Cash and Securities in 2021 (per resident):
- Bond Funds - Cash and Securities: $2,640,000 ($121.13)
- Other Funds - Cash and Securities: $20,886,000 ($958.34)
- Sinking Funds - Cash and Securities: $20,047,000 ($919.84)
8.01% of this county's 2020 resident taxpayers moved to other counties in 2021 ($77,850 average adjusted gross income)
| Here: | 8.01% |
| Minnesota average: | 7.79% |
0.01% of residents moved to foreign countries ($89 average AGI)
Dakota County: 0.01% Minnesota average: 0.00%
Top counties to which taxpayers relocated from this county between 2020 and 2021:
| to Hennepin County, MN | |
| to Ramsey County, MN | |
| to Scott County, MN |
| Businesses in West St. Paul, MN | ||||
| Name | Count | Name | Count | |
|---|---|---|---|---|
| Arby's | 1 | Lowe's | 1 | |
| Bakers Square | 1 | McDonald's | 1 | |
| Blockbuster | 1 | Nike | 2 | |
| Buffalo Wild Wings | 1 | Old Country Buffet | 1 | |
| Caribou Coffee | 1 | Penske | 1 | |
| Chipotle | 1 | Starbucks | 1 | |
| Chuck E. Cheese's | 1 | T-Mobile | 1 | |
| Kmart | 1 | |||
Strongest AM radio stations in West St. Paul:
- WCTS (1030 AM; 50 kW; MAPLEWOOD, MN; Owner: CNTL. BAPT. THEO/AL SEMI MINNEAPOLIS)
- KSTP (1500 AM; 50 kW; ST. PAUL, MN; Owner: KSTP-AM, LLC (DELAWARE))
- KTIS (900 AM; 25 kW; MINNEAPOLIS, MN; Owner: NORTHWESTERN COLLEGE)
- WCCO (830 AM; 50 kW; MINNEAPOLIS, MN; Owner: INFINITY MEDIA CORPORATION)
- KUOM (770 AM; daytime; 5 kW; MINNEAPOLIS, MN)
- KFAN (1130 AM; 50 kW; MINNEAPOLIS, MN; Owner: AMFM RADIO LICENSES, L.L.C.)
- KKMS (980 AM; 5 kW; RICHFIELD, MN)
- WMNN (1330 AM; 10 kW; MINNEAPOLIS, MN; Owner: MINNESOTA PUBLIC RADIO.)
- WDGY (630 AM; 8 kW; HUDSON, WI; Owner: 630 RADIO, INCORPORATED)
- WWTC (1280 AM; 5 kW; MINNEAPOLIS, MN; Owner: SCA LICENSE CORPORATION)
- KDIZ (1440 AM; 5 kW; GOLDEN VALLEY, MN; Owner: KQRS, INC.)
- KLBB (1400 AM; 1 kW; ST. PAUL, MN; Owner: 1400, INC.)
- WMGT (1220 AM; 5 kW; STILLWATER, MN; Owner: ENDURANCE BROADCASTING, LLC)
Strongest FM radio stations in West St. Paul:
- K294AM (106.7 FM; WEST ST. PAUL, MN; Owner: FRESH AIR, INCORPORATED)
- KNOW-FM (91.1 FM; MINNEAPOLIS-ST. PAUL, MN; Owner: MINNESOTA PUBLIC RADIO)
- WLTE (102.9 FM; MINNEAPOLIS, MN; Owner: INFINITY MEDIA CORPORATION)
- KSTP-FM (94.5 FM; ST. PAUL, MN; Owner: KSTP-FM, LLC, A DELAWARE LLC)
- KEEY-FM (102.1 FM; ST. PAUL, MN; Owner: AMFM RADIO LICENSES, L.L.C.)
- KTIS-FM (98.5 FM; MINNEAPOLIS, MN; Owner: NORTHWESTERN COLLEGE)
- KNOF (95.3 FM; ST. PAUL, MN; Owner: SELBY GOSPEL BROADCASTING CORPORATION)
- KDWB-FM (101.3 FM; RICHFIELD, MN; Owner: AMFM RADIO LICENSES, L.L.C.)
- KQRS-FM (92.5 FM; GOLDEN VALLEY, MN; Owner: KQRS, Inc.)
- KSJN (99.5 FM; MINNEAPOLIS, MN; Owner: MINNESOTA PUBLIC RADIO)
- KXXR (93.7 FM; MINNEAPOLIS, MN; Owner: KQRS, INC.)
- KBEM-FM (88.5 FM; MINNEAPOLIS, MN; Owner: BD. OF EDUCATION, S.S.D. NO. 1)
- K214DF (90.7 FM; GOLDEN VALLEY, MN; Owner: EDUCATIONAL MEDIA FOUNDATION)
- KTCZ-FM (97.1 FM; MINNEAPOLIS, MN; Owner: AMFM RADIO LICENSES, L.L.C.)
- WMCN (91.7 FM; ST. PAUL, MN; Owner: MACALESTER COLLEGE)
- WCAL (89.3 FM; NORTHFIELD, MN; Owner: ST. OLAF COLLEGE)
- KFAI (90.3 FM; MINNEAPOLIS, MN; Owner: FRESH AIR, INC.)
- WXPT (104.1 FM; ST. LOUIS PARK, MN; Owner: THE AUDIO HOUSE, INC.)
- KQQL (107.9 FM; ANOKA, MN; Owner: AMFM RADIO LICENSES, L.L.C.)
- WGVX (105.1 FM; LAKEVILLE, MN; Owner: KQRS, INC.)
TV broadcast stations around West St. Paul:
- KMSP-TV (Channel 9; MINNEAPOLIS, MN; Owner: FOX TELEVISION STATIONS, INC.)
- KTCA-TV (Channel 2; ST. PAUL, MN; Owner: TWIN CITIES PUBLIC TELEVISION, INC.)
- KARE (Channel 11; MINNEAPOLIS, MN; Owner: MULTIMEDIA HOLDINGS CORPORATION)
- KSTP-TV (Channel 5; ST. PAUL, MN; Owner: HUBBARD BROADCASTING, INC.)
- KTCI-TV (Channel 17; ST. PAUL, MN; Owner: TWIN CITIES PUBLIC TELEVISION, INC.)
- WCCO-TV (Channel 4; MINNEAPOLIS, MN; Owner: CBS BROADCASTING INC.)
- KMWB (Channel 23; MINNEAPOLIS, MN; Owner: KLGT LICENSEE, LLC)
- KSTC-TV (Channel 45; MINNEAPOLIS, MN; Owner: HUBBARD BROADCASTING, INC.)
- WFTC (Channel 29; MINNEAPOLIS, MN; Owner: FOX TELEVISION STATIONS, INC.)
- K07UI (Channel 7; MINNEAPOLIS, ETC., MN; Owner: WORD OF GOD FELLOWSHIP, INC.)
- K58BS (Channel 58; MINNEAPOLIS, MN; Owner: TRINITY BROADCASTING NETWORK)
- K67HG (Channel 67; MINNEAPOLIS, MN; Owner: VENTANA TELEVISION, INC.)
- K14KH (Channel 14; MINNEAPOLIS, MN; Owner: THREE ANGELS BROADCASTING NETWORK)
- K19ER (Channel 19; ST. PAUL, MN; Owner: CATHOLIC VIEWS BROADCASTS, INC.)
- W62BD (Channel 62; MINNEAPOLIS, MN; Owner: WORD OF GOD FELLOWSHIP, INC.)
- WBWX-CA (Channel 13; MINNEAPOLIS, MN; Owner: THE BOX WORLDWIDE LLC)
- KPXM (Channel 41; ST. CLOUD, MN; Owner: PAXSON MINNEAPOLIS LICENSE, INC.)
- W55AP (Channel 55; RIVER FALLS, WI; Owner: STATE OF WISCONSIN - EDUCATIONAL COMMUNICATIONS BOARD)
- National Bridge Inventory (NBI) Statistics
- 9Number of bridges
- 82ft / 24.7mTotal length
- 223,850Total average daily traffic
- 13,795Total average daily truck traffic
FCC Registered Antenna Towers:
46 (See the full list of FCC Registered Antenna Towers in West St. Paul)FCC Registered Broadcast Land Mobile Towers:
7- 1630 S Robert Street (Lat: 44.916083 Lon: -93.101333), Call Sign: WPVA736,
Assigned Frequencies: 462.262 MHz, 461.312 MHz, 469.262 MHz, 469.862 MHz, Grant Date: 06/07/2002, Expiration Date: 06/07/2012, Cancellation Date: 08/11/2012, Certifier: Rhonda Topp, Registrant: Border Foods Inc., 12800 Industrial Park Blvd Ste 210, Minneapolis, MN 55441, Phone: (763) 489-3004, Fax: (763) 489-3005, Email:
- 2001 S Robert St (Lat: 44.886111 Lon: -93.079722), Call Sign: WQHV440,
Assigned Frequencies: 462.337 MHz, 462.437 MHz, 467.437 MHz, Grant Date: 11/16/2007, Expiration Date: 11/16/2017, Cancellation Date: 01/20/2018, Certifier: Len Slade, Registrant: Advanced Wireless Communications, 20809 Kensington Blvd, Lakeville, MN 55044-8353, Phone: (952) 469-0150, Email:
- Lat: 44.902083 Lon: -93.078722, Call Sign: WQLI439,
Assigned Frequencies: 72.1600 MHz, Grant Date: 01/28/2010, Expiration Date: 01/28/2020, Cancellation Date: 04/04/2020, Certifier: Darren Ouimette, Registrant: Primex Wireless, Inc., 965 Wells Street, Lake Geneva, WI 53147, Phone: (262) 249-2327, Fax: (262) 249-2327, Email:
- Lat: 44.883194 Lon: -93.116861, Call Sign: WQVZ768,
Assigned Frequencies: 467.850 MHz, 467.875 MHz, 467.900 MHz, 467.925 MHz, Grant Date: 06/25/2015, Expiration Date: 06/25/2025, Certifier: Jason Sanders, Registrant: Fit, 1565 Oak St, Eugene, OR 97404, Phone: (541) 485-8441, Fax: (541) 485-7556, Email:
- Lat: 44.895778 Lon: -93.076361, Call Sign: WQYS319,
Assigned Frequencies: 467.212 MHz, Grant Date: 12/29/2016, Expiration Date: 12/29/2026, Certifier: Randy Hall, Registrant: Innovation Wireless, 5306 Beethoven St, Los Angeles, CA 90066, Phone: (888) 559-5565, Fax: (310) 482-3480, Email:
- Lat: 44.885583 Lon: -93.069472, Call Sign: WRAK490,
Assigned Frequencies: 452.412 MHz, 452.812 MHz, 452.862 MHz, 457.412 MHz, 457.862 MHz, Grant Date: 12/13/2017, Expiration Date: 12/13/2027, Certifier: James E Feyder, Registrant: Bearcom Operating LLC, Dallas, TX 75355-9001, Phone: (800) 458-9887, Email:
- Lat: 44.885500 Lon: -93.083167, Call Sign: WRNN338,
Assigned Frequencies: 452.037 MHz, 457.037 MHz, 462.337 MHz, 462.437 MHz, 467.437 MHz, Grant Date: 07/29/2021, Expiration Date: 07/29/2031, Certifier: Gary Reff, Registrant: Professional Wireless Comms., 451 Cliff Road, East, Suite 101, Burnsville, MN 55337, Phone: (952) 746-2500, Fax: (952) 746-2300, Email:
FCC Registered Microwave Towers:
1- MSPAGD, 44 E. Moreland (Lat: 44.908000 Lon: -93.083111), Type: Tower, Structure height: 28 m, Overall height: 29.2 m, Call Sign: WQJW577,
Assigned Frequencies: 21460.0 MHz, 21325.0 MHz, Grant Date: 01/23/2009, Expiration Date: 01/23/2019, Cancellation Date: 03/30/2019, Certifier: Kurt Maass, Registrant: Telecom Transport Management, Inc., 146 N. Canal Street, Suite 210, Seattle, WA 98103, Phone: (206) 816-6907, Fax: (206) 545-9585, Email:
FCC Registered Amateur Radio Licenses:
3- Call Sign: K0KWN, Licensee ID: L00152801, Grant Date: 07/08/2022, Expiration Date: 08/04/2032, Certifier: Ronald A Lundeen, Registrant: Ronald A Lundeen, 263 Wentworth Ave. E, West St. Paul, MN 55118
- Call Sign: N0TMU, Licensee ID: L00509972, Grant Date: 05/03/2022, Expiration Date: 07/21/2032, Certifier: Charles F Howell, Registrant: Charles F Howell, 293 West Bernard St, West St. Paul, MN 55118
- Call Sign: KE0DAV, Licensee ID: L01698537, Grant Date: 02/12/2015, Expiration Date: 02/12/2025, Cancellation Date: 04/03/2015, Certifier: James A Nicklas, Registrant: James A Nicklas, 345 Betty Lane, West St. Paul, MN 55118
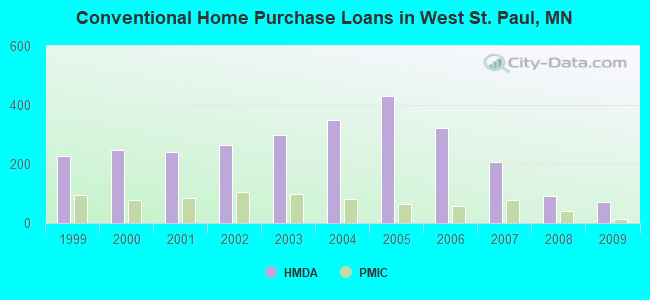
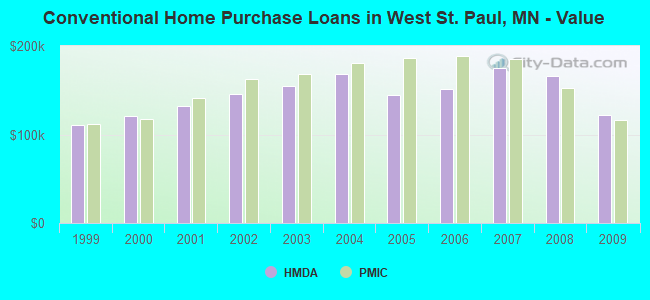
| Home Mortgage Disclosure Act Aggregated Statistics For Year 2009 (Based on 5 full tracts) | ||||||||||
| A) FHA, FSA/RHS & VA Home Purchase Loans | B) Conventional Home Purchase Loans | C) Refinancings | D) Home Improvement Loans | F) Non-occupant Loans on < 5 Family Dwellings (A B C & D) | ||||||
|---|---|---|---|---|---|---|---|---|---|---|
| Number | Average Value | Number | Average Value | Number | Average Value | Number | Average Value | Number | Average Value | |
| LOANS ORIGINATED | 127 | $146,512 | 72 | $122,486 | 344 | $169,349 | 25 | $42,640 | 20 | $110,800 |
| APPLICATIONS APPROVED, NOT ACCEPTED | 5 | $125,800 | 8 | $143,625 | 37 | $187,000 | 4 | $76,250 | 1 | $150,000 |
| APPLICATIONS DENIED | 13 | $157,154 | 13 | $112,385 | 117 | $194,624 | 10 | $127,400 | 12 | $98,417 |
| APPLICATIONS WITHDRAWN | 11 | $151,000 | 10 | $146,800 | 80 | $168,138 | 3 | $96,667 | 3 | $138,333 |
| FILES CLOSED FOR INCOMPLETENESS | 4 | $168,750 | 2 | $112,500 | 34 | $146,971 | 1 | $10,000 | 2 | $152,000 |
Detailed HMDA statistics for the following Tracts: 0601.01 , 0601.02, 0601.03, 0601.04, 0601.05
| Private Mortgage Insurance Companies Aggregated Statistics For Year 2009 (Based on 5 full tracts) | ||||
| A) Conventional Home Purchase Loans | B) Refinancings | |||
|---|---|---|---|---|
| Number | Average Value | Number | Average Value | |
| LOANS ORIGINATED | 13 | $116,846 | 5 | $186,200 |
| APPLICATIONS APPROVED, NOT ACCEPTED | 2 | $147,000 | 2 | $166,000 |
| APPLICATIONS DENIED | 2 | $166,000 | 2 | $120,500 |
| APPLICATIONS WITHDRAWN | 0 | $0 | 0 | $0 |
| FILES CLOSED FOR INCOMPLETENESS | 0 | $0 | 1 | $217,000 |
Detailed PMIC statistics for the following Tracts: 0601.01 , 0601.02, 0601.03, 0601.04, 0601.05
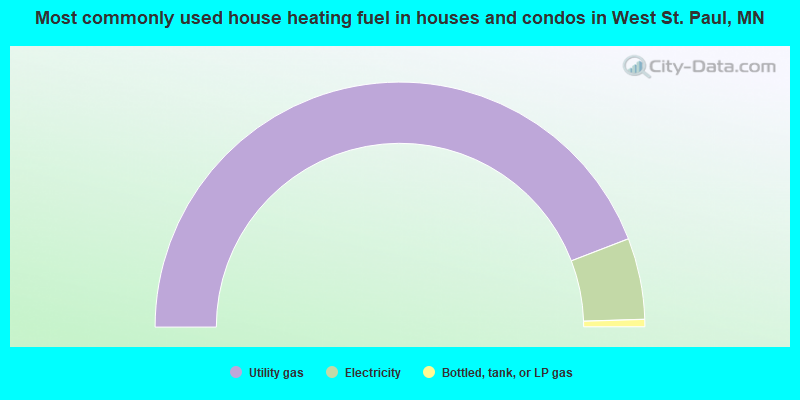
- 88.3%Utility gas
- 10.7%Electricity
- 1.0%Bottled, tank, or LP gas
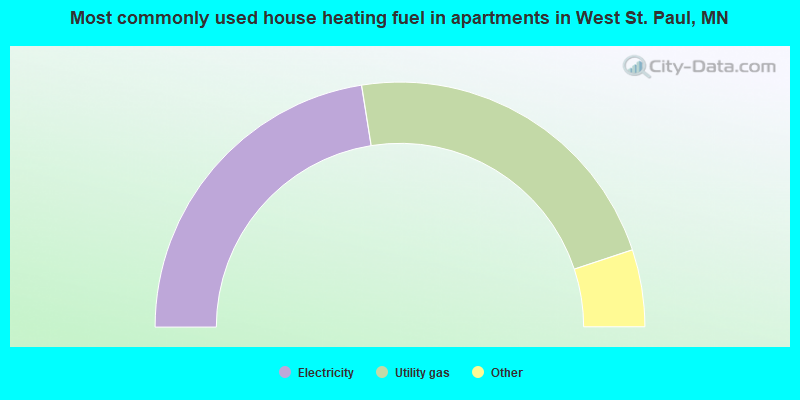
- 45.0%Electricity
- 44.8%Utility gas
- 3.8%No fuel used
- 3.2%Bottled, tank, or LP gas
- 3.1%Other fuel
West St. Paul compared to Minnesota state average:
- Unemployed percentage significantly below state average.
- Hispanic race population percentage significantly above state average.
- Renting percentage above state average.
- Length of stay since moving in significantly above state average.
- Number of rooms per house below state average.
State forum archive:

|
|
Total of 267 patent applications in 2008-2024.