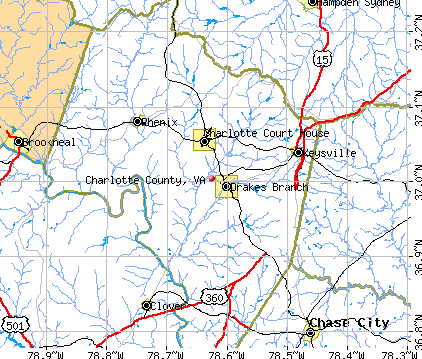
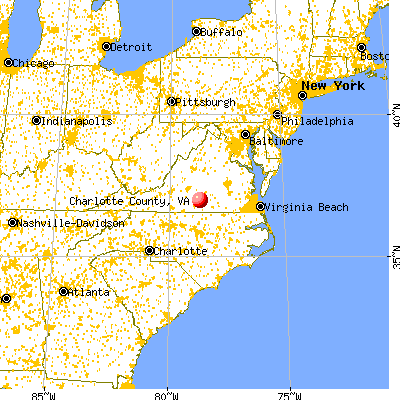
Charlotte County, Virginia (VA)
County owner-occupied free and clear houses and condos in 2010: 1,850
County owner-occupied houses and condos in 2000: 3,834
Renter-occupied apartments: 1,312 (it was 1,117 in 2000)
| % of renters here: | 23% |
| State: | 33% |
Land area: 475 sq. mi.
Water area: 2.4 sq. mi.
Population density: 25 people per square mile (low).
Industries providing employment: Educational, health and social services (27.3%), Retail trade (13.4%).
Type of workers:
- Private wage or salary: 61%
- Government: 25%
- Self-employed, not incorporated: 14%
- Unpaid family work: 0%
- OSM Map
- General Map
- Google Map
- MSN Map

- 7,77867.6%White Non-Hispanic Alone
- 2,99526.0%Black Non-Hispanic Alone
- 3723.2%Two or more races
- 3132.7%Hispanic or Latino
- 430.4%Asian alone
- 70.06%Some other race alone

| Median resident age: | 45.8 years |
| Virginia median age: | 39.0 years |
| Males: 5,906 | |
| Females: 5,736 |

 | Prices for beautiful old country estates low for a reason? (35 replies) |
| Worst county in Virginia *drum roll* (51 replies) |
| Younger (late 50s) retiree wants small farm... WHERE?? (38 replies) |
| Looking for IT friendly town/area to buy small farm (12 replies) |
| Will I survive in Pamplin? (13 replies) |
| Chase City??? (12 replies) |
| Charlotte County: | 2.0 people |
| Virginia: | 3 people |
Estimated median household income in 2022: $50,735 ($28,929 in 1999)
| This county: | $50,735 |
| Virginia: | $85,873 |
Median contract rent in 2022 for apartments: $492 (lower quartile is $409, upper quartile is $583)
| This county: | $492 |
| State: | $1270 |
Estimated median house or condo value in 2022: $147,442 (it was $69,600 in 2000)
| Charlotte: | $147,442 |
| Virginia: | $365,700 |
Median monthly housing costs for homes and condos with a mortgage: $1,098
Median monthly housing costs for units without a mortgage: $366
Institutionalized population: 155
Crime in 2021 (reported by the sheriff's office or county police, not the county total):
- Murders: 0
- Rapes: 2
- Robberies: 3
- Assaults: 8
- Burglaries: 18
- Thefts: 89
- Auto thefts: 14
Crime in 2020 (reported by the sheriff's office or county police, not the county total):
- Murders: 0
- Rapes: 4
- Robberies: 3
- Assaults: 6
- Burglaries: 33
- Thefts: 93
- Auto thefts: 10
Single-family new house construction building permits:
- 2022: 16 buildings, average cost: $288,400
- 2021: 23 buildings, average cost: $222,900
- 2020: 11 buildings, average cost: $147,500
- 2019: 16 buildings, average cost: $163,600
- 2018: 23 buildings, average cost: $203,200
- 2017: 12 buildings, average cost: $216,000
- 2016: 9 buildings, average cost: $161,500
- 2015: 14 buildings, average cost: $195,100
- 2014: 13 buildings, average cost: $140,000
- 2013: 21 buildings, average cost: $152,100
- 2012: 18 buildings, average cost: $124,500
- 2011: 34 buildings, average cost: $101,500
- 2010: 24 buildings, average cost: $122,300
- 2009: 57 buildings, average cost: $99,300
- 2008: 36 buildings, average cost: $125,000
- 2007: 64 buildings, average cost: $132,100
- 2006: 60 buildings, average cost: $108,400
- 2005: 59 buildings, average cost: $98,500
- 2004: 69 buildings, average cost: $75,700
- 2003: 56 buildings, average cost: $79,100
- 2002: 89 buildings, average cost: $88,400
- 2001: 90 buildings, average cost: $72,900
- 2000: 90 buildings, average cost: $57,900
- 1999: 94 buildings, average cost: $65,700
- 1998: 98 buildings, average cost: $63,200
- 1997: 83 buildings, average cost: $62,300


Median real estate property taxes paid for housing units with mortgages in 2022: $657 (0.4%)
Median real estate property taxes paid for housing units with no mortgage in 2022: $736 (0.5%)


| Charlotte County: | 21.5% |
| Virginia: | 10.6% |
Median age of residents in 2022: 45.8 years old
(Males: 40.1 years old, Females: 49.1 years old)
(Median age for: White residents: 46.9 years old, Black residents: 49.3 years old, Asian residents: 47.2 years old, Hispanic or Latino residents: 12.0 years old, Other race residents: 50.0 years old)
Fair market rent in 2006 for a 1-bedroom apartment in Charlotte County is $434 a month.
Fair market rent for a 2-bedroom apartment is $483 a month.
Fair market rent for a 3-bedroom apartment is $621 a month.
Cities in this county include: Keysville, Drakes Branch, Charlotte Court House, Phenix.
Notable locations in this county outside city limits:
Notable locations in Charlotte County: Dancing Point Shoal Channel Range (A), Bacons Castle (B), Walls Bridge (C), Grays Creek Marina (D), Claremont Wharf (E), Sandy Point Wharf (F), Old Courthouse Corners (G), Pipsico Boy Scout Reservation (H), Smith Fort (I), Four Mile Tree (J), Dillard Wharf (K), Swanns Point Plantation (L), Surry Nuclear Powerplant (M), Chippokes Plantation (N), Clarks Landing (O), Cross Creek Landing (P), Davis Landing (Q), Grays Landing (R), Camp Lions (S), Camp Kiwanis (T). Display/hide their locations on the map
Churches in Charlotte County include: Poplar Lawn Church (A), Rocky Hock Church (B), Saint Marys Church (C), Church of All Nations (D), Cypress Creek Church (E), Swanns Point Church (F), The Church of Jesus Christ (G), Ferguson Grove Church (H), Union Church (I). Display/hide their locations on the map
Cemeteries: Booker T Memorial Park (1), Wier Neck Cemetery (2), Jones Cemetery (3), Hickory Grove Memorial Cemetery (4), Poplar Lawn Cemetery (5), Swanns Point Plantation Cemetery (6), Mount Moriah Cemetery (7). Display/hide their locations on the map
Lakes, reservoirs, and swamps: Peach Orchard Gut (A), Black Duck Gut (B), Averys Pond (C), Sunken Meadow Pond (D), Atkins Pond (E), Gray Pond (F), Eastover Pond (G), Low Point Millpond (H). Display/hide their locations on the map
Streams, rivers, and creeks: Lower Chippokes Creek (A), Warwick Swamp (B), Upper Chippokes Creek (C), Timber Neck Creek (D), Sunken Meadow Creek (E), Spring Run (F), Spring Grove Swamp (G), Reedy Branch (H), Pigeonroost Swamp (I). Display/hide their locations on the map
Parks in Charlotte County include: Hog Island State Waterfowl Refuge (1), Chippokes Plantation State Park (2). Display/hide their locations on the map
Neighboring counties: Amelia County  , Russell County
  , Wayne County, Kentucky , Hampton city
  , Lynchburg city
  , Salem city .
| Here: | 2.9% |
| Virginia: | 2.7% |


Current college students: 284
People 25 years of age or older with a high school degree or higher: 84.5%
People 25 years of age or older with a bachelor's degree or higher: 16.6%
Number of foreign born residents: 73 (69.8% naturalized citizens)
| Charlotte County: | 0.6% |
| Whole state: | 12.7% |

- Year of entry for the foreign-born population
- 282010 or later
- 142000 to 2009
- 41990 to 1999
- 141980 to 1989
- 11970 to 1979
- 15Before 1970
Mean travel time to work (commute): minutes
Percentage of county residents living and working in this county: 99.7%
Housing units in structures:
- One, detached: 4,453
- One, attached: 10
- Two: 32
- 3 or 4: 46
- 5 to 9: 60
- 10 to 19: 6
- 20 to 49: 24
- 50 or more: 28
- Mobile homes: 1,353
- Boats, RVs, vans, etc.: 17
Housing units in Charlotte County with a mortgage: 1,199 (49 second mortgage, 6 home equity loan, 30 both second mortgage and home equity loan)
Houses without a mortgage: 110
| Here: | 0.9% with mortgage |
| State: | 97.2% with mortgage |
Religion statistics for Charlotte County
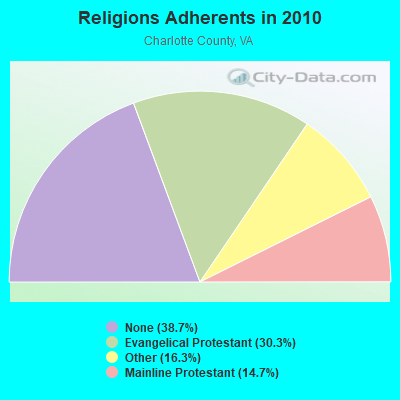
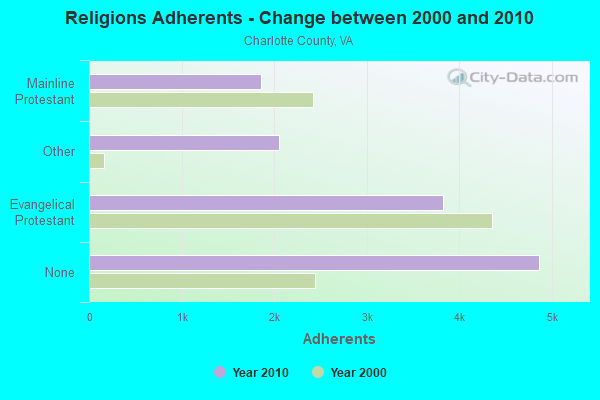
| Religion | Adherents | Congregations |
|---|---|---|
| Evangelical Protestant | 3,818 | 19 |
| Other | 2,050 | 4 |
| Mainline Protestant | 1,853 | 25 |
| None | 4,865 | - |
Source: Clifford Grammich, Kirk Hadaway, Richard Houseal, Dale E.Jones, Alexei Krindatch, Richie Stanley and Richard H.Taylor. 2012. 2010 U.S.Religion Census: Religious Congregations & Membership Study. Association of Statisticians of American Religious Bodies. Jones, Dale E., et al. 2002. Congregations and Membership in the United States 2000. Nashville, TN: Glenmary Research Center.
Food Environment Statistics:
| Charlotte County: | 4.89 / 10,000 pop. |
| State: | 2.03 / 10,000 pop. |
| This county: | 0.81 / 10,000 pop. |
| Virginia: | 1.43 / 10,000 pop. |
| Charlotte County: | 5.70 / 10,000 pop. |
| Virginia: | 4.03 / 10,000 pop. |
| This county: | 3.26 / 10,000 pop. |
| State: | 7.65 / 10,000 pop. |
| Charlotte County: | 11.4% |
| Virginia: | 9.3% |
| Charlotte County: | 29.4% |
| State: | 26.7% |
| Here: | 18.2% |
| State: | 18.6% |
Agriculture in Charlotte County:
Average size of farms: 250 acresAverage value of agricultural products sold per farm: $29,542
Average value of crops sold per acre for harvested cropland: $253.73
The value of nursery, greenhouse, floriculture, and sod as a percentage of the total market value of agricultural products sold: 0.35%
The value of livestock, poultry, and their products as a percentage of the total market value of agricultural products sold: 58.34%
Average total farm production expenses per farm: $30,035
Harvested cropland as a percentage of land in farms: 19.41%
Irrigated harvested cropland as a percentage of land in farms: 5.37%
Average market value of all machinery and equipment per farm: $38,751
The percentage of farms operated by a family or individual: 93.27%
Average age of principal farm operators: 57 years
Average number of cattle and calves per 100 acres of all land in farms: 12.62
Milk cows as a percentage of all cattle and calves: 7.72%
Corn for grain: 1142 harvested acres
All wheat for grain: 1271 harvested acres
Soybeans for beans: 1410 harvested acres
Vegetables: 33 harvested acres
Land in orchards: 5 acres
Tornado activity:
Charlotte County historical area-adjusted tornado activity is significantly below Virginia state average. It is 6754958.3 times below overall U.S. average.Tornadoes in this county have caused 3 injuries recorded between 1950 and 2004.
On 4/19/1978, a category 3 (max. wind speeds 158-206 mph) tornado injured 3 people and caused between $50,000 and $500,000 in damages.
Earthquake activity:
Charlotte County-area historical earthquake activity is significantly above Virginia state average. It is 45% smaller than the overall U.S. average.On 8/23/2011 at 17:51:04, a magnitude 5.8 (5.8 MW, Depth: 3.7 mi, Class: Moderate, Intensity: VI - VII) earthquake occurred 73.3 miles away from Charlotte County center
On 8/9/2020 at 12:07:37, a magnitude 5.1 (5.1 MW, Depth: 4.7 mi) earthquake occurred 141.5 miles away from the county center
On 12/9/2003 at 20:59:14, a magnitude 4.5 (4.5 MB, 4.5 LG, Class: Light, Intensity: IV - V) earthquake occurred 56.7 miles away from the county center
On 12/9/2003 at 20:59:18, a magnitude 4.5 (4.5 ML, Depth: 6.2 mi) earthquake occurred 60.7 miles away from the county center
On 8/25/2011 at 05:07:52, a magnitude 4.5 (4.5 ML, Depth: 4.2 mi) earthquake occurred 74.7 miles away from Charlotte County center
On 8/24/2011 at 00:04:36, a magnitude 4.2 (4.2 ML) earthquake occurred 73.1 miles away from the county center
Magnitude types: regional Lg-wave magnitude (LG), body-wave magnitude (MB), local magnitude (ML), moment magnitude (MW)
Most recent natural disasters:
- Virginia Covid-19 Pandemic, Incident Period: January 20, 2020, Major Disaster (Presidential) Declared DR-4512-VA: April 2, 2020, FEMA Id: 4512, Natural disaster type: Other
- Virginia Tropical Storm Michael, Incident Period: October 9, 2018 - October 16, 2018, FEMA Id: 4411, Natural disaster type: Tropical Storm
- Virginia Hurricane Sandy, Incident Period: October 26, 2012 to November 01, 2012, Emergency Declared EM-3359: October 29, 2012, FEMA Id: 3359, Natural disaster type: Hurricane
- Virginia Severe Storms and Straight-line Winds, Incident Period: June 29, 2012 to July 01, 2012, Major Disaster (Presidential) Declared DR-4072: July 27, 2012, FEMA Id: 4072, Natural disaster type: Storm, Wind
- Virginia Hurricane Katrina Evacuation, Incident Period: August 29, 2005 to October 01, 2005, Emergency Declared EM-3240: September 12, 2005, FEMA Id: 3240, Natural disaster type: Hurricane
- Virginia Hurricane Isabel, Incident Period: September 18, 2003 to October 01, 2003, Major Disaster (Presidential) Declared DR-1491: September 18, 2003, FEMA Id: 1491, Natural disaster type: Hurricane
- Virginia Winter Storm, Incident Period: January 25, 2000 to January 30, 2000, Major Disaster (Presidential) Declared DR-1318: February 28, 2000, FEMA Id: 1318, Natural disaster type: Winter Storm
- Virginia Hurricane Fran, Incident Period: September 05, 1996 to September 23, 1996, Major Disaster (Presidential) Declared DR-1135: September 06, 1996, FEMA Id: 1135, Natural disaster type: Hurricane
- Virginia Blizzard, Incident Period: January 06, 1996 to January 12, 1996, Major Disaster (Presidential) Declared DR-1086: January 13, 1996, FEMA Id: 1086, Natural disaster type: Blizzard
- Virginia Ice Storm, Winter Storm, Severe Storm, Incident Period: March 01, 1994 to March 05, 1994, Major Disaster (Presidential) Declared DR-1021: April 11, 1994, FEMA Id: 1021, Natural disaster type: Ice Storm, Winter Storm, Storm
- 5 other natural disasters have been reported since 1953.
The number of natural disasters in Charlotte County (15) is near the US average (15).
Major Disasters (Presidential) Declared: 9
Emergencies Declared: 5
Causes of natural disasters: Hurricanes: 4, Storms: 3, Winter Storms: 3, Droughts: 2, Ice Storms: 2, Tropical Storms: 2, Blizzard: 1, Flood: 1, Wind: 1, Other: 1 (Note: some incidents may be assigned to more than one category).

Means of transportation to work:
- Drove a car alone: 2,153 (72.2%)
- Carpooled: 175 (5.9%)
- Bus: 7 (0.2%)
- Taxicab, motorcycle, or other means: 169 (5.7%)
- Walked: 110 (3.7%)
- Worked at home: 357 (12.0%)


- Health care and social assistance (29%)
- Educational services (18%)
- Retail trade (11%)
- Public administration (8%)
- Other services, except public administration (7%)
- Manufacturing (6%)
- Finance and insurance (6%)

- Health care and social assistance (27%)
- Educational services (17%)
- Retail trade (10%)
- Public administration (8%)
- Other services, except public administration (7%)
- Manufacturing (6%)
- Finance and insurance (5%)

- Transportation occupations (18%)
- Sales and related occupations (12%)
- Installation, maintenance, and repair occupations (11%)
- Management occupations (10%)
- Farming, fishing, and forestry occupations (9%)
- Construction and extraction occupations (8%)
- Law enforcement workers including supervisors (5%)

- Office and administrative support occupations (21%)
- Educational instruction, and library occupations (10%)
- Healthcare support occupations (9%)
- Management occupations (8%)
- Sales and related occupations (6%)
- Business and financial operations occupations (6%)
- Food preparation and serving related occupations (6%)

- Korea (26%)
- Mexico (23%)
- England (12%)
- Haiti (10%)
- Thailand (5%)
- Vietnam (4%)
- Tanzania (4%)

- American (34%)
- English (11%)
- Irish (4%)
- German (2%)
- European (2%)
- Scotch-Irish (1%)
- African (1%)


People in group quarters in Charlotte County, Virginia in 2010:
- 83 people in local jails and other municipal confinement facilities
- 54 people in nursing facilities/skilled-nursing facilities
- 18 people in group homes for juveniles (non-correctional)
- 12 people in workers' group living quarters and job corps centers
- 8 people in group homes intended for adults
People in group quarters in Charlotte County, Virginia in 2000:
- 89 people in agriculture workers' dormitories on farms
- 88 people in nursing homes
- 51 people in local jails and other confinement facilities (including police lockups)
- 3 people in homes for the mentally retarded
6.67% of this county's 2021 resident taxpayers lived in other counties in 2020 ($40,259 average adjusted gross income)
| Here: | 6.67% |
| Virginia average: | 10.16% |
10 or fewer of this county's residents moved from foreign countries.
5.06% relocated from other counties in Virginia ($26,661 average AGI)
1.61% relocated from other states ($13,599 average AGI)
Charlotte County: 1.61% Virginia average: 3.91%

Top counties from which taxpayers relocated into this county between 2020 and 2021:
| from Prince Edward County, VA | |
| from Mecklenburg County, VA |
6.35% of this county's 2020 resident taxpayers moved to other counties in 2021 ($35,962 average adjusted gross income)
| Here: | 6.35% |
| Virginia average: | 10.20% |
10 or fewer of this county's residents moved to foreign countries.
5.35% relocated to other counties in Virginia ($31,900 average AGI)
1.00% relocated to other states ($4,062 average AGI)
Charlotte County: 1.00% Virginia average: 3.98%

Top counties to which taxpayers relocated from this county between 2020 and 2021:
| to Prince Edward County, VA | |
| to Mecklenburg County, VA |
Births per 1000 population from 1990 to 1999: 13.0
Births per 1000 population from 2000 to 2006: 11.5

Deaths per 1000 population from 1990 to 1999: 13.4
Deaths per 1000 population from 2000 to 2009: 12.6
Deaths per 1000 population from 2010 to 2020: 13.1

Infant deaths per 1000 live births from 1990 to 1999: 7.2
Infant deaths per 1000 live births from 2000 to 2006: 3.1

Persons under 19 years old without health insurance coverage in 2018: 7.2%


Persons enrolled in hospital insurance and/or supplemental medical insurance (Medicare) in July 1, 2007: 2,927 (2,367 aged, 560 disabled)
Children under 18 without health insurance coverage in 2007: 279 (10%)


Most common underlying causes of death in Charlotte County, Virginia in 1999 - 2019:
- Bronchus or lung, unspecified - Malignant neoplasms (185)
- Acute myocardial infarction, unspecified (141)
- Atherosclerotic heart disease (65)
- Chronic obstructive pulmonary disease, unspecified (22)
Population without health insurance coverage in 2000: 15%
Children under 18 without health insurance coverage in 2000: 12%
Medical specialist MDs per 100,000 population in 2005: 1,185
Dentists per 100,000 population in 1998: 8
Total births per 100,000 population, July 2005 - July 2006 : 8
Total deaths per 100,000 population, July 2005 - July 2006: 32
Limited-service eating places per 100,000 population in 2005 : 8
Crimes per 100,000 population in 1996: 1
Household type by relationship:
Households: 11,642- Male householders: 2,145 (791 living alone), Female householders: 2,522 (816 living alone)
1,856 spouses (1,839 opposite-sex spouses), 136 unmarried partners, (135 opposite-sex unmarried partners), 3,212 children (2,917 natural, 137 adopted, 147 stepchildren), 604 grandchildren, 116 brothers or sisters, 107 parents, 0 foster children, 107 other relatives, 602 non-relatives
- In group quarters: 158
Size of family households: 1,485 2-persons, 575 3-persons, 524 4-persons, 143 5-persons, 67 6-persons, 47 7-or-more-persons.
Size of nonfamily households: 1,607 1-person, 177 2-persons, 5 3-persons, 2 4-persons, 31 6-persons.
1,276 married couples with children.
708 single-parent households (38 men, 670 women).
98.8% of residents of Charlotte speak English at home.
0.3% of residents speak Spanish at home (84% speak English very well, 16% don't speak English at all).
0.4% of residents speak other Indo-European language at home (79% speak English very well, 7% speak English well, 14% speak English not well).
0.3% of residents speak Asian or Pacific Island language at home (71% speak English very well, 21% speak English well, 8% speak English not well).
0.1% of residents speak other language at home (100% speak English very well).
In fiscal year 2004:
Federal Government expenditure: $87,789,000 ($7,073 per capita)
Department of Defense expenditure: $4,803,000
Federal direct payments to individuals for retirement and disability: $45,440,000
Federal other direct payments to individuals: $18,016,000
Federal direct payments not to individuals: $1,014,000
Federal grants: $15,553,000
Federal procurement contracts: $4,790,000 ($2,343,000 Department of Defense)
Federal salaries and wages: $2,976,000 ($0,000 Department of Defense)
Federal Government direct loans: $898,000
Federal guaranteed/insured loans: $1,633,000
Federal Government insurance: $3,792,000
Population change from April 1, 2000 to July 1, 2005:
Births: 781| Here: | 63 per 1000 residents |
| State: | 70 per 1000 residents |
Deaths: 843
| Here: | 68 per 1000 residents |
| State: | 40 per 1000 residents |
Net international migration: +40
| Here: | +3 per 1000 residents |
| State: | +18 per 1000 residents |
Net internal migration: -12
| Here: | |
| State: |

Total withdrawal of fresh water for public supply: 0.11 millions of gallons per day (all from ground)
| Here: | 6.1 |
| State: | 7.0 |
| Here: | 5.0 |
| State: | 4.3 |

- Year house built in Charlotte County, Virginia
- 42020 or later
- 3652010 to 2019
- 6902000 to 2009
- 8181990 to 1999
- 8531980 to 1989
- 9921970 to 1979
- 5981960 to 1969
- 6111950 to 1959
- 2561940 to 1949
- 7711939 or earlier

- Rooms in owner-occupied houses in Charlotte County, Virginia
- 01 room
- 112 rooms
- 1313 rooms
- 2904 rooms
- 6915 rooms
- 7856 rooms
- 5357 rooms
- 4308 rooms
- 3649+ rooms

- Rooms in renter-occupied apartments in Charlotte County, Virginia
- 181 room
- 192 rooms
- 1123 rooms
- 2874 rooms
- 4115 rooms
- 1856 rooms
- 2477 rooms
- 498 rooms
- 689+ rooms

- Bedrooms in owner-occupied houses in Charlotte County, Virginia
- 26no bedroom
- 551 bedroom
- 5512 bedrooms
- 1,8173 bedrooms
- 5424 bedrooms
- 2575+ bedrooms

- Bedrooms in renter-occupied apartments in Charlotte County, Virginia
- 18no bedroom
- 1551 bedroom
- 5392 bedrooms
- 5723 bedrooms
- 1134 bedrooms
- 75+ bedrooms

- Cars and other vehicles available in Charlotte County in owner-occupied houses/condos
- 171no vehicle
- 7321 vehicle
- 1,0692 vehicles
- 8763 vehicles
- 3204 vehicles
- 745+ vehicles

- Cars and other vehicles available in Charlotte County in renter-occupied apartments
- 206no vehicle
- 6721 vehicle
- 3442 vehicles
- 983 vehicles
- 964 vehicles
- 05+ vehicles
94.6% of Charlotte County residents lived in the same house 1 years ago.
Out of people who lived in different houses, 27% lived in this county.
Out of people who lived in different counties, 67% lived in Virginia.
| Charlotte County: | 94.6% |
| State average: | 86.6% |
Place of birth for U.S.-born residents:
- This state: 8,915
- Other state: 2,581
- Northeast: 1,098
- Midwest: 184
- South: 1,170
- West: 123


- 48.5%Electricity
- 22.2%Bottled, tank, or LP gas
- 14.3%Fuel oil, kerosene, etc.
- 9.9%Wood
- 2.9%Utility gas
- 1.0%Solar energy
- 0.6%Other fuel
- 0.5%No fuel used

- 62.2%Electricity
- 14.8%Bottled, tank, or LP gas
- 12.8%Wood
- 9.3%Fuel oil, kerosene, etc.
- 0.6%Other fuel
- 0.3%No fuel used
Private vs. public school enrollment:
| Here: | 2.0% |
| Virginia: | 13.2% |
| Here: | 11.3% |
| Virginia: | 10.2% |
| Here: | 15.8% |
| Virginia: | 18.7% |


Charlotte County government finances - Expenditure in 2018:
- Charges - Solid Waste Management: $939,000
Other: $520,000
Elementary and Secondary Education School Lunch: $315,000
Elementary and Secondary Education School Tuition and Transportation: $26,000
- Construction - Elementary and Secondary Education: $120,000
- Current Operations - Elementary and Secondary Education: $25,340,000
Public Welfare - Other: $5,723,000
Police Protection: $2,346,000
Correctional Institutions: $1,665,000
Judicial and Legal Services: $690,000
Central Staff Services: $671,000
Financial Administration: $605,000
Libraries: $556,000
General Public Buildings: $481,000
Local Fire Protection: $472,000
Natural Resources - Other: $253,000
Health - Other: $238,000
General - Other: $237,000
Housing and Community Development: $146,000
Parks and Recreation: $86,000
Protective Inspection and Regulation - Other: $65,000
- Federal Intergovernmental - Public Welfare: $3,250,000
Education: $2,250,000
Other: $102,000
General Local Government Support: $79,000
Highways: $18,000
- General - Interest on Debt: $8,000
- Intergovernmental to Local - Other - Elementary and Secondary Education: $251,000
- Local Intergovernmental - Education: $129,000
- Long Term Debt - Retired Unspecified Public Purpose: $206,000
Beginning Outstanding - Unspecified Public Purpose: $206,000
- Miscellaneous - General Revenue - Other: $1,461,000
Interest Earnings: $591,000
Rents: $292,000
Fines and Forfeits: $266,000
Sale of Property: $13,000
- Other Capital Outlay - Elementary and Secondary Education: $580,000
- Other Funds - Cash and Securities: $10,865,000
- State Intergovernmental - Education: $21,098,000
Other: $2,478,000
Public Welfare: $1,350,000
General Local Government Support: $1,080,000
- Tax - Property: $8,970,000
General Sales and Gross Receipts: $629,000
Motor Vehicle License: $353,000
Public Utilities Sales: $312,000
Documentary and Stock Transfer: $67,000
Other License: $65,000
- Total Salaries and Wages: $14,508,000
Charlotte County government finances - Revenue in 2018:
- Charges - Solid Waste Management: $939,000
Other: $520,000
Elementary and Secondary Education School Lunch: $315,000
Elementary and Secondary Education School Tuition and Transportation: $26,000
- Construction - Elementary and Secondary Education: $120,000
- Current Operations - Elementary and Secondary Education: $25,340,000
Public Welfare - Other: $5,723,000
Police Protection: $2,346,000
Correctional Institutions: $1,665,000
Judicial and Legal Services: $690,000
Central Staff Services: $671,000
Financial Administration: $605,000
Libraries: $556,000
General Public Buildings: $481,000
Local Fire Protection: $472,000
Natural Resources - Other: $253,000
Health - Other: $238,000
General - Other: $237,000
Housing and Community Development: $146,000
Parks and Recreation: $86,000
Protective Inspection and Regulation - Other: $65,000
- Federal Intergovernmental - Public Welfare: $3,250,000
Education: $2,250,000
Other: $102,000
General Local Government Support: $79,000
Highways: $18,000
- General - Interest on Debt: $8,000
- Intergovernmental to Local - Other - Elementary and Secondary Education: $251,000
- Local Intergovernmental - Education: $129,000
- Long Term Debt - Retired Unspecified Public Purpose: $206,000
Beginning Outstanding - Unspecified Public Purpose: $206,000
- Miscellaneous - General Revenue - Other: $1,461,000
Interest Earnings: $591,000
Rents: $292,000
Fines and Forfeits: $266,000
Sale of Property: $13,000
- Other Capital Outlay - Elementary and Secondary Education: $580,000
- Other Funds - Cash and Securities: $10,865,000
- State Intergovernmental - Education: $21,098,000
Other: $2,478,000
Public Welfare: $1,350,000
General Local Government Support: $1,080,000
- Tax - Property: $8,970,000
General Sales and Gross Receipts: $629,000
Motor Vehicle License: $353,000
Public Utilities Sales: $312,000
Documentary and Stock Transfer: $67,000
Other License: $65,000
- Total Salaries and Wages: $14,508,000
Charlotte County government finances - Debt in 2018:
- Charges - Solid Waste Management: $939,000
Other: $520,000
Elementary and Secondary Education School Lunch: $315,000
Elementary and Secondary Education School Tuition and Transportation: $26,000
- Construction - Elementary and Secondary Education: $120,000
- Current Operations - Elementary and Secondary Education: $25,340,000
Public Welfare - Other: $5,723,000
Police Protection: $2,346,000
Correctional Institutions: $1,665,000
Judicial and Legal Services: $690,000
Central Staff Services: $671,000
Financial Administration: $605,000
Libraries: $556,000
General Public Buildings: $481,000
Local Fire Protection: $472,000
Natural Resources - Other: $253,000
Health - Other: $238,000
General - Other: $237,000
Housing and Community Development: $146,000
Parks and Recreation: $86,000
Protective Inspection and Regulation - Other: $65,000
- Federal Intergovernmental - Public Welfare: $3,250,000
Education: $2,250,000
Other: $102,000
General Local Government Support: $79,000
Highways: $18,000
- General - Interest on Debt: $8,000
- Intergovernmental to Local - Other - Elementary and Secondary Education: $251,000
- Local Intergovernmental - Education: $129,000
- Long Term Debt - Retired Unspecified Public Purpose: $206,000
Beginning Outstanding - Unspecified Public Purpose: $206,000
- Miscellaneous - General Revenue - Other: $1,461,000
Interest Earnings: $591,000
Rents: $292,000
Fines and Forfeits: $266,000
Sale of Property: $13,000
- Other Capital Outlay - Elementary and Secondary Education: $580,000
- Other Funds - Cash and Securities: $10,865,000
- State Intergovernmental - Education: $21,098,000
Other: $2,478,000
Public Welfare: $1,350,000
General Local Government Support: $1,080,000
- Tax - Property: $8,970,000
General Sales and Gross Receipts: $629,000
Motor Vehicle License: $353,000
Public Utilities Sales: $312,000
Documentary and Stock Transfer: $67,000
Other License: $65,000
- Total Salaries and Wages: $14,508,000
Charlotte County government finances - Cash and Securities in 2018:
- Charges - Solid Waste Management: $939,000
Other: $520,000
Elementary and Secondary Education School Lunch: $315,000
Elementary and Secondary Education School Tuition and Transportation: $26,000
- Construction - Elementary and Secondary Education: $120,000
- Current Operations - Elementary and Secondary Education: $25,340,000
Public Welfare - Other: $5,723,000
Police Protection: $2,346,000
Correctional Institutions: $1,665,000
Judicial and Legal Services: $690,000
Central Staff Services: $671,000
Financial Administration: $605,000
Libraries: $556,000
General Public Buildings: $481,000
Local Fire Protection: $472,000
Natural Resources - Other: $253,000
Health - Other: $238,000
General - Other: $237,000
Housing and Community Development: $146,000
Parks and Recreation: $86,000
Protective Inspection and Regulation - Other: $65,000
- Federal Intergovernmental - Public Welfare: $3,250,000
Education: $2,250,000
Other: $102,000
General Local Government Support: $79,000
Highways: $18,000
- General - Interest on Debt: $8,000
- Intergovernmental to Local - Other - Elementary and Secondary Education: $251,000
- Local Intergovernmental - Education: $129,000
- Long Term Debt - Retired Unspecified Public Purpose: $206,000
Beginning Outstanding - Unspecified Public Purpose: $206,000
- Miscellaneous - General Revenue - Other: $1,461,000
Interest Earnings: $591,000
Rents: $292,000
Fines and Forfeits: $266,000
Sale of Property: $13,000
- Other Capital Outlay - Elementary and Secondary Education: $580,000
- Other Funds - Cash and Securities: $10,865,000
- State Intergovernmental - Education: $21,098,000
Other: $2,478,000
Public Welfare: $1,350,000
General Local Government Support: $1,080,000
- Tax - Property: $8,970,000
General Sales and Gross Receipts: $629,000
Motor Vehicle License: $353,000
Public Utilities Sales: $312,000
Documentary and Stock Transfer: $67,000
Other License: $65,000
- Total Salaries and Wages: $14,508,000
Supplemental Security Income (SSI) in 2006:
- Total number of recipients: 591
- Number of aged recipients: 125
- Number of blind and disabled recipients: 466
- Number of recipients under 18: 69
- Number of recipients between 18 and 64: 298
- Number of recipients older than 64: 224
- Number of recipients also receiving OASDI: 303
- Amount of payments (thousands of dollars): 230
| Most common first names in Charlotte County, VA among deceased individuals | ||
| Name | Count | Lived (average) |
|---|---|---|
| John | 107 | 74.9 years |
| James | 105 | 71.5 years |
| William | 102 | 72.6 years |
| Mary | 95 | 79.2 years |
| Robert | 68 | 74.3 years |
| Annie | 44 | 79.4 years |
| George | 43 | 73.4 years |
| Thomas | 42 | 75.5 years |
| Henry | 33 | 77.4 years |
| Elizabeth | 32 | 77.9 years |
| Most common last names in Charlotte County, VA among deceased individuals | ||
| Last name | Count | Lived (average) |
|---|---|---|
| Johnson | 45 | 75.4 years |
| Jones | 42 | 74.4 years |
| Smith | 37 | 74.7 years |
| White | 32 | 80.3 years |
| Morton | 31 | 79.1 years |
| Newcomb | 30 | 70.0 years |
| Jackson | 28 | 73.7 years |
| Adams | 27 | 75.9 years |
| Hurt | 27 | 75.8 years |
| Thompson | 27 | 72.4 years |
| Businesses in Charlotte County, VA | ||||
| Name | Count | Name | Count | |
|---|---|---|---|---|
| Ace Hardware | 1 | Rite Aid | 1 | |
| Burger King | 1 | True Value | 1 | |
| Ford | 1 | U.S. Cellular | 1 | |
| H&R Block | 1 | UPS | 2 | |
Charlotte County on our top lists:
- #89 on the list of "Top 101 counties with the lowest total withdrawal of fresh water for public supply"