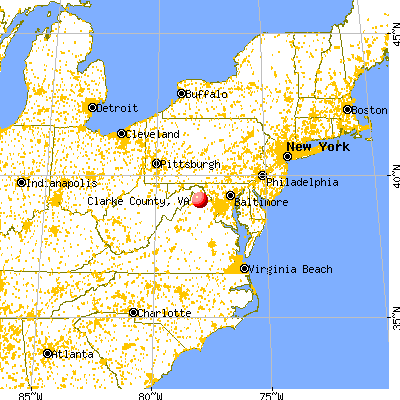
Clarke County, Virginia (VA)
County owner-occupied free and clear houses and condos in 2010: 1,098
County owner-occupied houses and condos in 2000: 3,733
Renter-occupied apartments: 1,353 (it was 1,209 in 2000)
| % of renters here: | 24% |
| State: | 33% |
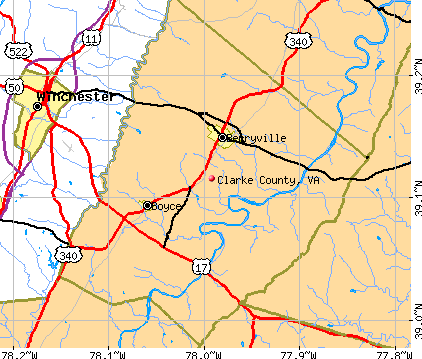
Land area: 177 sq. mi.
Water area: 1.6 sq. mi.
Population density: 85 people per square mile (average).
Industries providing employment: Educational, health and social services (20.4%), Professional, scientific, management, administrative, and waste management services (15.8%), Retail trade (12.5%), Construction (11.0%).
Type of workers:
- Private wage or salary: 70%
- Government: 21%
- Self-employed, not incorporated: 8%
- Unpaid family work: 0%
- OSM Map
- General Map
- Google Map
- MSN Map

- 12,35683.2%White Non-Hispanic Alone
- 1,0316.9%Hispanic or Latino
- 6754.5%Black Non-Hispanic Alone
- 4593.1%Two or more races
- 1891.3%Asian alone
- 900.6%Some other race alone
- 440.3%American Indian and Alaska Native alone

| Median resident age: | 48.8 years |
| Virginia median age: | 39.0 years |
| Males: 7,405 | |
| Females: 7,578 |

 | is NoVA where the North ends? (45 replies) |
| Northern Virginia, especially Fairfax County, is losing population (42 replies) |
| South Arlington shantytowns (48 replies) |
| Homeschooling Communities in Virginia (2 replies) |
| Is This An Accurate Map of Virginia's Regions? (53 replies) |
| Where is Northern Virginia? (25 replies) |
| Clarke County: | 2.0 people |
| Virginia: | 3 people |
Estimated median household income in 2022: $105,780 ($51,601 in 1999)
| This county: | $105,780 |
| Virginia: | $85,873 |
Median contract rent in 2022 for apartments: $1,122 (lower quartile is $904, upper quartile is $1,290)
| This county: | $1122 |
| State: | $1270 |
Estimated median house or condo value in 2022: $534,452 (it was $156,500 in 2000)
| Clarke: | $534,452 |
| Virginia: | $365,700 |
Median monthly housing costs for homes and condos with a mortgage: $1,999
Median monthly housing costs for units without a mortgage: $574
Institutionalized population: 236
Crime in 2021 (reported by the sheriff's office or county police, not the county total):
- Murders: 0
- Rapes: 2
- Robberies: 1
- Assaults: 1
- Burglaries: 2
- Thefts: 35
- Auto thefts: 4
Crime in 2020 (reported by the sheriff's office or county police, not the county total):
- Murders: 0
- Rapes: 1
- Robberies: 1
- Assaults: 5
- Burglaries: 9
- Thefts: 40
- Auto thefts: 5
Single-family new house construction building permits:
- 2022: 93 buildings, average cost: $376,700
- 2021: 115 buildings, average cost: $304,600
- 2020: 78 buildings, average cost: $254,000
- 2019: 54 buildings, average cost: $277,000
- 2018: 35 buildings, average cost: $313,300
- 2017: 53 buildings, average cost: $371,400
- 2016: 60 buildings, average cost: $383,800
- 2015: 45 buildings, average cost: $344,500
- 2014: 34 buildings, average cost: $278,900
- 2013: 28 buildings, average cost: $242,300
- 2012: 20 buildings, average cost: $232,600
- 2011: 17 buildings, average cost: $339,400
- 2010: 23 buildings, average cost: $278,600
- 2009: 24 buildings, average cost: $284,200
- 2008: 41 buildings, average cost: $233,700
- 2007: 56 buildings, average cost: $171,900
- 2006: 80 buildings, average cost: $164,600
- 2005: 221 buildings, average cost: $203,500
- 2004: 130 buildings, average cost: $176,600
- 2003: 127 buildings, average cost: $180,400
- 2002: 129 buildings, average cost: $164,500
- 2001: 139 buildings, average cost: $165,500
- 2000: 101 buildings, average cost: $155,200
- 1999: 123 buildings, average cost: $151,000
- 1998: 75 buildings, average cost: $145,000
- 1997: 74 buildings, average cost: $134,800


Median real estate property taxes paid for housing units with mortgages in 2022: $2,831 (0.5%)
Median real estate property taxes paid for housing units with no mortgage in 2022: $2,676 (0.6%)


| Clarke County: | 5.7% |
| Virginia: | 10.6% |
Median age of residents in 2022: 48.8 years old
(Males: 48.4 years old, Females: 49.5 years old)
(Median age for: White residents: 50.0 years old, Black residents: 52.4 years old, American Indian residents: 30.8 years old, Asian residents: 56.2 years old, Hispanic or Latino residents: 25.9 years old, Other race residents: 28.1 years old)
Area name: Washington-Arlington-Alexandria, DC-VA-MD HUD Metro FMR Area
Fair market rent in 2006 for a 1-bedroom apartment in Clarke County is $1080 a month.
Fair market rent for a 2-bedroom apartment is $1225 a month.
Fair market rent for a 3-bedroom apartment is $1580 a month.
Cities in this county include: Berryville, Shenandoah Retreat, Boyce.
Neighboring counties: Fauquier County  , Lawrence County, Indiana
  , Wood County, West Virginia , Macoupin County, Illinois , Montgomery County, Illinois .
| Here: | 2.2% |
| Virginia: | 2.7% |


Current college students: 385
People 25 years of age or older with a high school degree or higher: 93.7%
People 25 years of age or older with a bachelor's degree or higher: 34.5%
Number of foreign born residents: 723 (67.7% naturalized citizens)
| Clarke County: | 4.8% |
| Whole state: | 12.7% |

- Year of entry for the foreign-born population
- 2022010 or later
- 892000 to 2009
- 1491990 to 1999
- 511980 to 1989
- 731970 to 1979
- 98Before 1970
Mean travel time to work (commute): " minutes
Percentage of county residents living and working in this county: 96.5%
Housing units in structures:
- One, detached: 5,724
- One, attached: 398
- Two: 78
- 3 or 4: 29
- 5 to 9: 33
- 20 to 49: 93
- 50 or more: 119
- Mobile homes: 40
Housing units in Clarke County with a mortgage: 3,231 (322 second mortgage, 0 home equity loan, 295 both second mortgage and home equity loan)
Houses without a mortgage: 110
| Here: | 2.7% with mortgage |
| State: | 97.2% with mortgage |
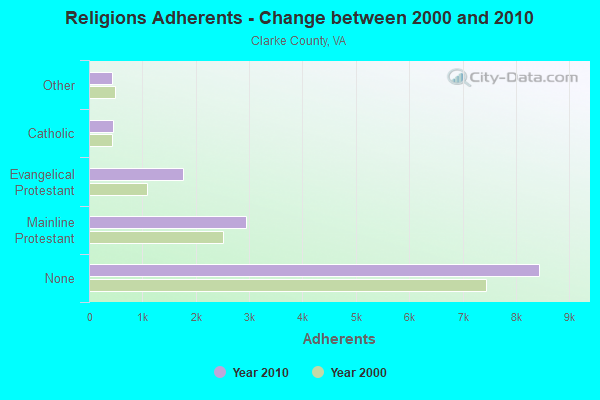
Religion statistics for Clarke County
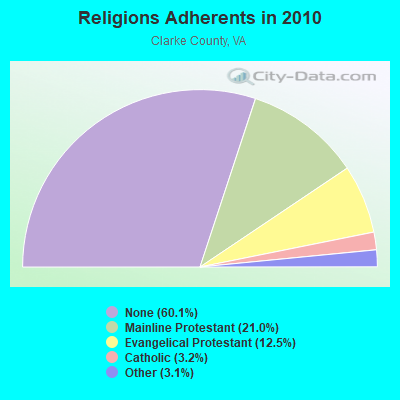
| Religion | Adherents | Congregations |
|---|---|---|
| Mainline Protestant | 2,949 | 16 |
| Evangelical Protestant | 1,761 | 10 |
| Catholic | 449 | 1 |
| Other | 435 | 1 |
| None | 8,440 | - |
Source: Clifford Grammich, Kirk Hadaway, Richard Houseal, Dale E.Jones, Alexei Krindatch, Richie Stanley and Richard H.Taylor. 2012. 2010 U.S.Religion Census: Religious Congregations & Membership Study. Association of Statisticians of American Religious Bodies. Jones, Dale E., et al. 2002. Congregations and Membership in the United States 2000. Nashville, TN: Glenmary Research Center.
Food Environment Statistics:
| Clarke County: | 0.70 / 10,000 pop. |
| State: | 2.03 / 10,000 pop. |
| This county: | 2.09 / 10,000 pop. |
| Virginia: | 1.43 / 10,000 pop. |
| Clarke County: | 5.58 / 10,000 pop. |
| Virginia: | 4.03 / 10,000 pop. |
| This county: | 5.58 / 10,000 pop. |
| State: | 7.65 / 10,000 pop. |
| Clarke County: | 10.1% |
| Virginia: | 9.3% |
| Clarke County: | 26.4% |
| State: | 26.7% |
| Here: | 10.9% |
| State: | 18.6% |
Agriculture in Clarke County:
Average size of farms: 157 acresAverage value of agricultural products sold per farm: $33,086
Average value of crops sold per acre for harvested cropland: $209.12
The value of nursery, greenhouse, floriculture, and sod as a percentage of the total market value of agricultural products sold: 8.79%
The value of livestock, poultry, and their products as a percentage of the total market value of agricultural products sold: 66.21%
Average total farm production expenses per farm: $37,231
Harvested cropland as a percentage of land in farms: 33.97%
Average market value of all machinery and equipment per farm: $38,786
The percentage of farms operated by a family or individual: 85.38%
Average age of principal farm operators: 56 years
Average number of cattle and calves per 100 acres of all land in farms: 22.73
Milk cows as a percentage of all cattle and calves: 8.40%
Corn for grain: 3582 harvested acres
All wheat for grain: 715 harvested acres
Soybeans for beans: 1530 harvested acres
Vegetables: 25 harvested acres
Land in orchards: 2,093 acres
Earthquake activity:
Clarke County-area historical earthquake activity is significantly above Virginia state average. It is 52% smaller than the overall U.S. average.On 8/23/2011 at 17:51:04, a magnitude 5.8 (5.8 MW, Depth: 3.7 mi, Class: Moderate, Intensity: VI - VII) earthquake occurred 83.4 miles away from Clarke County center
On 9/25/1998 at 19:52:52, a magnitude 5.2 (4.8 MB, 4.3 MS, 5.2 LG, 4.5 MW, Depth: 3.1 mi) earthquake occurred 207.5 miles away from the county center
On 8/25/2011 at 05:07:52, a magnitude 4.5 (4.5 ML, Depth: 4.2 mi, Class: Light, Intensity: IV - V) earthquake occurred 80.8 miles away from the county center
On 12/9/2003 at 20:59:18, a magnitude 4.5 (4.5 ML, Depth: 6.2 mi) earthquake occurred 92.9 miles away from the county center
On 12/9/2003 at 20:59:14, a magnitude 4.5 (4.5 MB, 4.5 LG) earthquake occurred 105.8 miles away from Clarke County center
On 1/16/1994 at 01:49:16, a magnitude 4.6 (4.6 MB, 4.6 LG, Depth: 3.1 mi) earthquake occurred 133.7 miles away from the county center
Magnitude types: regional Lg-wave magnitude (LG), body-wave magnitude (MB), local magnitude (ML), surface-wave magnitude (MS), moment magnitude (MW)
Most recent natural disasters:
- Virginia Covid-19 Pandemic, Incident Period: January 20, 2020, Major Disaster (Presidential) Declared DR-4512-VA: April 2, 2020, FEMA Id: 4512, Natural disaster type: Other
- Virginia Severe Winter Storm And Snowstorm, Incident Period: January 22, 2016 to January 23, 2016, Major Disaster (Presidential) Declared DR-4262: March 07, 2016, FEMA Id: 4262, Natural disaster type: Snowstorm, Winter Storm
- Virginia Hurricane Sandy, Incident Period: October 26, 2012 to November 01, 2012, Emergency Declared EM-3359: October 29, 2012, FEMA Id: 3359, Natural disaster type: Hurricane
- Virginia Severe Storms and Straight-line Winds, Incident Period: June 29, 2012 to July 01, 2012, Major Disaster (Presidential) Declared DR-4072: July 27, 2012, FEMA Id: 4072, Natural disaster type: Storm, Wind
- Virginia Severe Winter Storms and Snowstorms, Incident Period: February 05, 2010 to February 11, 2010, Major Disaster (Presidential) Declared DR-1905: April 27, 2010, FEMA Id: 1905, Natural disaster type: Snowstorm, Winter Storm
- Virginia Hurricane Katrina Evacuation, Incident Period: August 29, 2005 to October 01, 2005, Emergency Declared EM-3240: September 12, 2005, FEMA Id: 3240, Natural disaster type: Hurricane
- Virginia Hurricane Isabel, Incident Period: September 18, 2003 to October 01, 2003, Major Disaster (Presidential) Declared DR-1491: September 18, 2003, FEMA Id: 1491, Natural disaster type: Hurricane
- Virginia Winter Storm, Incident Period: January 25, 2000 to January 30, 2000, Major Disaster (Presidential) Declared DR-1318: February 28, 2000, FEMA Id: 1318, Natural disaster type: Winter Storm
- Virginia Hurricane Fran, Incident Period: September 05, 1996 to September 23, 1996, Major Disaster (Presidential) Declared DR-1135: September 06, 1996, FEMA Id: 1135, Natural disaster type: Hurricane
- Virginia Severe Flooding, Incident Period: January 19, 1996 to February 01, 1996, Major Disaster (Presidential) Declared DR-1098: January 27, 1996, FEMA Id: 1098, Natural disaster type: Flood
- 5 other natural disasters have been reported since 1953.
The number of natural disasters in Clarke County (15) is near the US average (15).
Major Disasters (Presidential) Declared: 11
Emergencies Declared: 4
Causes of natural disasters: Hurricanes: 4, Winter Storms: 4, Floods: 2, Snowstorms: 2, Storms: 2, Blizzard: 1, Drought: 1, Tropical Storm: 1, Wind: 1, Other: 1 (Note: some incidents may be assigned to more than one category).

Means of transportation to work:
- Drove a car alone: 2,852 (60.8%)
- Carpooled: 455 (9.7%)
- Bus: 6 (0.1%)
- Taxicab, motorcycle, or other means: 43 (0.9%)
- Walked: 85 (1.8%)
- Worked at home: 1,421 (30.3%)


- Health care and social assistance (17%)
- Educational services (15%)
- Public administration (11%)
- Retail trade (8%)
- Professional, scientific, and technical services (7%)
- Other services, except public administration (4%)
- Administrative and support and waste management services (4%)

- Health care and social assistance (18%)
- Educational services (16%)
- Public administration (12%)
- Retail trade (9%)
- Professional, scientific, and technical services (8%)
- Other services, except public administration (5%)
- Administrative and support and waste management services (5%)

- Management occupations (20%)
- Sales and related occupations (12%)
- Construction and extraction occupations (10%)
- Computer and mathematical occupations (8%)
- Installation, maintenance, and repair occupations (8%)
- Business and financial operations occupations (6%)
- Material moving occupations (5%)
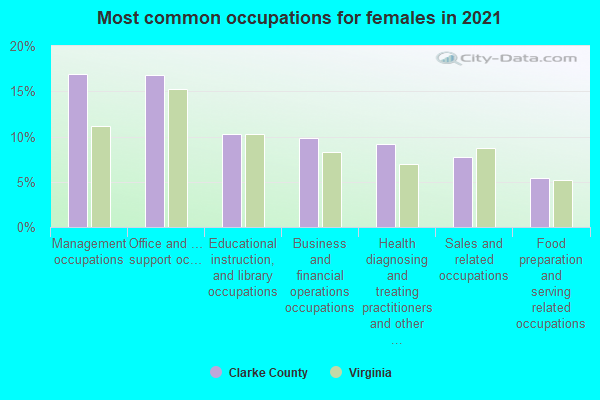
- Management occupations (19%)
- Office and administrative support occupations (17%)
- Educational instruction, and library occupations (10%)
- Health diagnosing and treating practitioners and other technical occupations (10%)
- Business and financial operations occupations (9%)
- Sales and related occupations (8%)
- Personal care and service occupations (4%)

- Philippines (13%)
- El Salvador (13%)
- Mexico (11%)
- Germany (9%)
- Trinidad and Tobago (6%)
- Peru (6%)
- Guatemala (5%)

- American (19%)
- German (14%)
- Irish (12%)
- English (12%)
- European (4%)
- Italian (3%)
- Northern European (2%)


People in group quarters in Clarke County, Virginia in 2010:
- 114 people in nursing facilities/skilled-nursing facilities
- 75 people in correctional residential facilities
- 47 people in residential treatment centers for juveniles (non-correctional)
- 19 people in other noninstitutional facilities
People in group quarters in Clarke County, Virginia in 2000:
- 150 people in state prisons
- 134 people in nursing homes
- 24 people in religious group quarters
- 4 people in other nonhousehold living situations
10.99% of this county's 2021 resident taxpayers lived in other counties in 2020 ($72,375 average adjusted gross income)
| Here: | 10.99% |
| Virginia average: | 10.16% |
10 or fewer of this county's residents moved from foreign countries.
8.12% relocated from other counties in Virginia ($51,063 average AGI)
2.87% relocated from other states ($21,313 average AGI)
Clarke County: 2.87% Virginia average: 3.91%

Top counties from which taxpayers relocated into this county between 2020 and 2021:
| from Loudoun County, VA | |
| from Frederick County, VA | |
| from Fairfax County, VA | |
| from Winchester city, VA | |
| from Warren County, VA | |
| from Berkeley County, WV | |
| from Jefferson County, WV |
8.19% of this county's 2020 resident taxpayers moved to other counties in 2021 ($83,494 average adjusted gross income)
| Here: | 8.19% |
| Virginia average: | 10.20% |
10 or fewer of this county's residents moved to foreign countries.
5.08% relocated to other counties in Virginia ($50,483 average AGI)
3.11% relocated to other states ($33,010 average AGI)
Clarke County: 3.11% Virginia average: 3.98%

Top counties to which taxpayers relocated from this county between 2020 and 2021:
| to Frederick County, VA | |
| to Loudoun County, VA | |
| to Jefferson County, WV | |
| to Berkeley County, WV | |
| to Winchester city, VA |
Births per 1000 population from 1990 to 1999: 10.9
Births per 1000 population from 2000 to 2006: 9.3

Deaths per 1000 population from 1990 to 1999: 9.8
Deaths per 1000 population from 2000 to 2009: 9.8
Deaths per 1000 population from 2010 to 2020: 10.7

Infant deaths per 1000 live births from 1990 to 1999: 8.0
Infant deaths per 1000 live births from 2000 to 2006: 1.1

Persons under 19 years old without health insurance coverage in 2018: 6.8%


Persons enrolled in hospital insurance and/or supplemental medical insurance (Medicare) in July 1, 2007: 2,143 (1,924 aged, 219 disabled)
Children under 18 without health insurance coverage in 2007: 295 (9%)


Most common underlying causes of death in Clarke County, Virginia in 1999 - 2019:
- Bronchus or lung, unspecified - Malignant neoplasms (125)
- Atherosclerotic heart disease (80)
- Acute myocardial infarction, unspecified (33)
- Alzheimer disease, unspecified (32)
- Chronic obstructive pulmonary disease, unspecified (32)
- Unspecified dementia (32)
- Cardiac arrhythmia, unspecified (11)
- Stroke, not specified as haemorrhage or infarction (10)
Population without health insurance coverage in 2000: 8%
Children under 18 without health insurance coverage in 2000: 7%
Medical specialist MDs per 100,000 population in 2005: 915
Dentists per 100,000 population in 1998: 7
Total births per 100,000 population, July 2005 - July 2006 : 23
Total deaths per 100,000 population, July 2005 - July 2006: 49
Household type by relationship:
Households: 14,983- Male householders: 2,964 (792 living alone), Female householders: 2,806 (737 living alone)
3,293 spouses (3,203 opposite-sex spouses), 248 unmarried partners, (217 opposite-sex unmarried partners), 3,876 children (3,516 natural, 49 adopted, 311 stepchildren), 330 grandchildren, 83 brothers or sisters, 272 parents, 0 foster children, 290 other relatives, 566 non-relatives
- In group quarters: 241
Size of family households: 2,039 2-persons, 712 3-persons, 774 4-persons, 230 5-persons, 112 6-persons, 118 7-or-more-persons.
Size of nonfamily households: 1,528 1-person, 226 2-persons, 19 3-persons, 11 6-persons.
1,923 married couples with children.
456 single-parent households (200 men, 256 women).
92.5% of residents of Clarke speak English at home.
4.5% of residents speak Spanish at home (55% speak English very well, 31% speak English well, 10% speak English not well, 4% don't speak English at all).
1.9% of residents speak other Indo-European language at home (98% speak English very well, 2% speak English well).
0.9% of residents speak Asian or Pacific Island language at home (97% speak English very well, 3% speak English not well).
In fiscal year 2004:
Federal Government expenditure: $59,320,000 ($4,282 per capita)
Department of Defense expenditure: $4,073,000
Federal direct payments to individuals for retirement and disability: $35,557,000
Federal other direct payments to individuals: $10,359,000
Federal direct payments not to individuals: $332,000
Federal grants: $5,834,000
Federal procurement contracts: $4,688,000 ($577,000 Department of Defense)
Federal salaries and wages: $2,550,000 ($51,000 Department of Defense)
Federal Government direct loans: $29,000
Federal guaranteed/insured loans: $6,273,000
Federal Government insurance: $11,250,000
Population change from April 1, 2000 to July 1, 2005:
Births: 658| Here: | 46 per 1000 residents |
| State: | 70 per 1000 residents |
Deaths: 699
| Here: | 49 per 1000 residents |
| State: | 40 per 1000 residents |
Net international migration: +53
| Here: | +4 per 1000 residents |
| State: | +18 per 1000 residents |
Net internal migration: +1,563
| Here: | +110 per 1000 residents |
| State: | +14 per 1000 residents |

Total withdrawal of fresh water for public supply: 0.47 millions of gallons per day (17% from ground, 83% from surface)
| Here: | 7.4 |
| State: | 7.0 |
| Here: | 4.9 |
| State: | 4.3 |

- Year house built in Clarke County, Virginia
- 282020 or later
- 3782010 to 2019
- 1,2062000 to 2009
- 8381990 to 1999
- 8011980 to 1989
- 7431970 to 1979
- 5551960 to 1969
- 4251950 to 1959
- 2351940 to 1949
- 1,2231939 or earlier

- Rooms in owner-occupied houses in Clarke County, Virginia
- 01 room
- 02 rooms
- 83 rooms
- 2944 rooms
- 5565 rooms
- 6446 rooms
- 8287 rooms
- 5418 rooms
- 1,6679+ rooms

- Rooms in renter-occupied apartments in Clarke County, Virginia
- 611 room
- 652 rooms
- 1683 rooms
- 2094 rooms
- 2605 rooms
- 2296 rooms
- 437 rooms
- 808 rooms
- 1369+ rooms

- Bedrooms in owner-occupied houses in Clarke County, Virginia
- 0no bedroom
- 371 bedroom
- 5742 bedrooms
- 1,9663 bedrooms
- 1,2784 bedrooms
- 6815+ bedrooms

- Bedrooms in renter-occupied apartments in Clarke County, Virginia
- 61no bedroom
- 1171 bedroom
- 5112 bedrooms
- 4343 bedrooms
- 554 bedrooms
- 705+ bedrooms

- Cars and other vehicles available in Clarke County in owner-occupied houses/condos
- 33no vehicle
- 5991 vehicle
- 1,8052 vehicles
- 1,1073 vehicles
- 6214 vehicles
- 3345+ vehicles

- Cars and other vehicles available in Clarke County in renter-occupied apartments
- 81no vehicle
- 7201 vehicle
- 2902 vehicles
- 763 vehicles
- 754 vehicles
- 195+ vehicles
90.4% of Clarke County residents lived in the same house 1 years ago.
Out of people who lived in different houses, 20% lived in this county.
Out of people who lived in different counties, 75% lived in Virginia.
| Clarke County: | 90.4% |
| State average: | 86.6% |
Place of birth for U.S.-born residents:
- This state: 7,545
- Other state: 6,616
- Northeast: 2,134
- Midwest: 935
- South: 2,819
- West: 726


- 46.1%Electricity
- 15.5%Utility gas
- 14.2%Fuel oil, kerosene, etc.
- 11.3%Bottled, tank, or LP gas
- 10.4%Wood
- 1.3%Other fuel
- 0.6%No fuel used
- 0.4%Coal or coke
- 0.2%Solar energy

- 72.1%Electricity
- 9.8%Utility gas
- 7.3%Fuel oil, kerosene, etc.
- 5.6%Wood
- 3.0%Other fuel
- 2.1%Bottled, tank, or LP gas
Private vs. public school enrollment:
| Here: | 17.2% |
| Virginia: | 13.2% |
| Here: | 3.0% |
| Virginia: | 10.2% |
| Here: | 8.9% |
| Virginia: | 18.7% |


Clarke County government finances - Expenditure in 2017:
- Charges - Other: $551,000
Elementary and Secondary Education School Lunch: $431,000
Parks and Recreation: $398,000
Sewerage: $306,000
Elementary and Secondary Education School Tuition and Transportation: $202,000
Elementary and Secondary Education - Other: $61,000
Solid Waste Management: $21,000
- Construction - Elementary and Secondary Education: $3,607,000
Solid Waste Management: $66,000
Parks and Recreation: $49,000
- Current Operations - Elementary and Secondary Education: $22,736,000
General - Other: $15,713,000
Public Welfare - Other: $2,543,000
Police Protection: $2,364,000
Financial Administration: $1,379,000
Local Fire Protection: $1,085,000
General Public Buildings: $784,000
Parks and Recreation: $767,000
Natural Resources - Other: $739,000
Judicial and Legal Services: $698,000
Housing and Community Development: $536,000
Central Staff Services: $525,000
Sewerage: $518,000
Water Utilities: $320,000
Health - Other: $224,000
Protective Inspection and Regulation - Other: $183,000
Solid Waste Management: $147,000
- Federal Intergovernmental - Other: $718,000
Public Welfare: $713,000
Education: $140,000
General Local Government Support: $6,000
- Intergovernmental to Local - Other - Correctional Institutions: $511,000
Other - Libraries: $207,000
Other - Elementary and Secondary Education: $54,000
Other - Transit Utilities: $19,000
Other - Air Transportation: $3,000
- Intergovernmental to State - Health - Other: $220,000
Natural Resources - Other: $3,000
- Local Intergovernmental - Education: $82,000
General Local Government Support: $52,000
Public Welfare: $44,000
- Long Term Debt - Beginning Outstanding - Public Debt for Private Purpose: $82,951,000
Outstanding Nonguaranteed - Industrial Revenue: $80,524,000
Beginning Outstanding - Unspecified Public Purpose: $39,163,000
Outstanding Unspecified Public Purpose: $36,887,000
Retired Unspecified Public Purpose: $4,055,000
Retired Nonguaranteed - Public Debt for Private Purpose: $2,427,000
Issue, Unspecified Public Purpose: $1,779,000
- Miscellaneous - Fines and Forfeits: $352,000
General Revenue - Other: $257,000
Donations From Private Sources: $131,000
Rents: $61,000
Sale of Property: $14,000
- Other Capital Outlay - Elementary and Secondary Education: $497,000
Police Protection: $204,000
Health - Other: $178,000
General Public Building: $106,000
Parks and Recreation: $95,000
Central Staff Services: $91,000
Housing and Community Development: $57,000
- Other Funds - Cash and Securities: $11,916,000
- Revenue - Water Utilities: $266,000
- Short Term Debt Outstanding - Beginning: $3,006,000
End of Fiscal Year: $2,261,000
- Sinking Funds - Cash and Securities: $80,524,000
- State Intergovernmental - Education: $9,913,000
General Local Government Support: $2,989,000
Other: $2,182,000
Public Welfare: $277,000
- Tax - Property: $19,982,000
General Sales and Gross Receipts: $898,000
Other License: $417,000
Other Selective Sales: $376,000
Public Utilities Sales: $346,000
Motor Vehicle License: $325,000
- Total Salaries and Wages: $13,376,000
- Water Utilities - Interest on Debt: $27,000
Clarke County government finances - Revenue in 2017:
- Charges - Other: $551,000
Elementary and Secondary Education School Lunch: $431,000
Parks and Recreation: $398,000
Sewerage: $306,000
Elementary and Secondary Education School Tuition and Transportation: $202,000
Elementary and Secondary Education - Other: $61,000
Solid Waste Management: $21,000
- Construction - Elementary and Secondary Education: $3,607,000
Solid Waste Management: $66,000
Parks and Recreation: $49,000
- Current Operations - Elementary and Secondary Education: $22,736,000
General - Other: $15,713,000
Public Welfare - Other: $2,543,000
Police Protection: $2,364,000
Financial Administration: $1,379,000
Local Fire Protection: $1,085,000
General Public Buildings: $784,000
Parks and Recreation: $767,000
Natural Resources - Other: $739,000
Judicial and Legal Services: $698,000
Housing and Community Development: $536,000
Central Staff Services: $525,000
Sewerage: $518,000
Water Utilities: $320,000
Health - Other: $224,000
Protective Inspection and Regulation - Other: $183,000
Solid Waste Management: $147,000
- Federal Intergovernmental - Other: $718,000
Public Welfare: $713,000
Education: $140,000
General Local Government Support: $6,000
- Intergovernmental to Local - Other - Correctional Institutions: $511,000
Other - Libraries: $207,000
Other - Elementary and Secondary Education: $54,000
Other - Transit Utilities: $19,000
Other - Air Transportation: $3,000
- Intergovernmental to State - Health - Other: $220,000
Natural Resources - Other: $3,000
- Local Intergovernmental - Education: $82,000
General Local Government Support: $52,000
Public Welfare: $44,000
- Long Term Debt - Beginning Outstanding - Public Debt for Private Purpose: $82,951,000
Outstanding Nonguaranteed - Industrial Revenue: $80,524,000
Beginning Outstanding - Unspecified Public Purpose: $39,163,000
Outstanding Unspecified Public Purpose: $36,887,000
Retired Unspecified Public Purpose: $4,055,000
Retired Nonguaranteed - Public Debt for Private Purpose: $2,427,000
Issue, Unspecified Public Purpose: $1,779,000
- Miscellaneous - Fines and Forfeits: $352,000
General Revenue - Other: $257,000
Donations From Private Sources: $131,000
Rents: $61,000
Sale of Property: $14,000
- Other Capital Outlay - Elementary and Secondary Education: $497,000
Police Protection: $204,000
Health - Other: $178,000
General Public Building: $106,000
Parks and Recreation: $95,000
Central Staff Services: $91,000
Housing and Community Development: $57,000
- Other Funds - Cash and Securities: $11,916,000
- Revenue - Water Utilities: $266,000
- Short Term Debt Outstanding - Beginning: $3,006,000
End of Fiscal Year: $2,261,000
- Sinking Funds - Cash and Securities: $80,524,000
- State Intergovernmental - Education: $9,913,000
General Local Government Support: $2,989,000
Other: $2,182,000
Public Welfare: $277,000
- Tax - Property: $19,982,000
General Sales and Gross Receipts: $898,000
Other License: $417,000
Other Selective Sales: $376,000
Public Utilities Sales: $346,000
Motor Vehicle License: $325,000
- Total Salaries and Wages: $13,376,000
- Water Utilities - Interest on Debt: $27,000
Clarke County government finances - Debt in 2017:
- Charges - Other: $551,000
Elementary and Secondary Education School Lunch: $431,000
Parks and Recreation: $398,000
Sewerage: $306,000
Elementary and Secondary Education School Tuition and Transportation: $202,000
Elementary and Secondary Education - Other: $61,000
Solid Waste Management: $21,000
- Construction - Elementary and Secondary Education: $3,607,000
Solid Waste Management: $66,000
Parks and Recreation: $49,000
- Current Operations - Elementary and Secondary Education: $22,736,000
General - Other: $15,713,000
Public Welfare - Other: $2,543,000
Police Protection: $2,364,000
Financial Administration: $1,379,000
Local Fire Protection: $1,085,000
General Public Buildings: $784,000
Parks and Recreation: $767,000
Natural Resources - Other: $739,000
Judicial and Legal Services: $698,000
Housing and Community Development: $536,000
Central Staff Services: $525,000
Sewerage: $518,000
Water Utilities: $320,000
Health - Other: $224,000
Protective Inspection and Regulation - Other: $183,000
Solid Waste Management: $147,000
- Federal Intergovernmental - Other: $718,000
Public Welfare: $713,000
Education: $140,000
General Local Government Support: $6,000
- Intergovernmental to Local - Other - Correctional Institutions: $511,000
Other - Libraries: $207,000
Other - Elementary and Secondary Education: $54,000
Other - Transit Utilities: $19,000
Other - Air Transportation: $3,000
- Intergovernmental to State - Health - Other: $220,000
Natural Resources - Other: $3,000
- Local Intergovernmental - Education: $82,000
General Local Government Support: $52,000
Public Welfare: $44,000
- Long Term Debt - Beginning Outstanding - Public Debt for Private Purpose: $82,951,000
Outstanding Nonguaranteed - Industrial Revenue: $80,524,000
Beginning Outstanding - Unspecified Public Purpose: $39,163,000
Outstanding Unspecified Public Purpose: $36,887,000
Retired Unspecified Public Purpose: $4,055,000
Retired Nonguaranteed - Public Debt for Private Purpose: $2,427,000
Issue, Unspecified Public Purpose: $1,779,000
- Miscellaneous - Fines and Forfeits: $352,000
General Revenue - Other: $257,000
Donations From Private Sources: $131,000
Rents: $61,000
Sale of Property: $14,000
- Other Capital Outlay - Elementary and Secondary Education: $497,000
Police Protection: $204,000
Health - Other: $178,000
General Public Building: $106,000
Parks and Recreation: $95,000
Central Staff Services: $91,000
Housing and Community Development: $57,000
- Other Funds - Cash and Securities: $11,916,000
- Revenue - Water Utilities: $266,000
- Short Term Debt Outstanding - Beginning: $3,006,000
End of Fiscal Year: $2,261,000
- Sinking Funds - Cash and Securities: $80,524,000
- State Intergovernmental - Education: $9,913,000
General Local Government Support: $2,989,000
Other: $2,182,000
Public Welfare: $277,000
- Tax - Property: $19,982,000
General Sales and Gross Receipts: $898,000
Other License: $417,000
Other Selective Sales: $376,000
Public Utilities Sales: $346,000
Motor Vehicle License: $325,000
- Total Salaries and Wages: $13,376,000
- Water Utilities - Interest on Debt: $27,000
Clarke County government finances - Cash and Securities in 2017:
- Charges - Other: $551,000
Elementary and Secondary Education School Lunch: $431,000
Parks and Recreation: $398,000
Sewerage: $306,000
Elementary and Secondary Education School Tuition and Transportation: $202,000
Elementary and Secondary Education - Other: $61,000
Solid Waste Management: $21,000
- Construction - Elementary and Secondary Education: $3,607,000
Solid Waste Management: $66,000
Parks and Recreation: $49,000
- Current Operations - Elementary and Secondary Education: $22,736,000
General - Other: $15,713,000
Public Welfare - Other: $2,543,000
Police Protection: $2,364,000
Financial Administration: $1,379,000
Local Fire Protection: $1,085,000
General Public Buildings: $784,000
Parks and Recreation: $767,000
Natural Resources - Other: $739,000
Judicial and Legal Services: $698,000
Housing and Community Development: $536,000
Central Staff Services: $525,000
Sewerage: $518,000
Water Utilities: $320,000
Health - Other: $224,000
Protective Inspection and Regulation - Other: $183,000
Solid Waste Management: $147,000
- Federal Intergovernmental - Other: $718,000
Public Welfare: $713,000
Education: $140,000
General Local Government Support: $6,000
- Intergovernmental to Local - Other - Correctional Institutions: $511,000
Other - Libraries: $207,000
Other - Elementary and Secondary Education: $54,000
Other - Transit Utilities: $19,000
Other - Air Transportation: $3,000
- Intergovernmental to State - Health - Other: $220,000
Natural Resources - Other: $3,000
- Local Intergovernmental - Education: $82,000
General Local Government Support: $52,000
Public Welfare: $44,000
- Long Term Debt - Beginning Outstanding - Public Debt for Private Purpose: $82,951,000
Outstanding Nonguaranteed - Industrial Revenue: $80,524,000
Beginning Outstanding - Unspecified Public Purpose: $39,163,000
Outstanding Unspecified Public Purpose: $36,887,000
Retired Unspecified Public Purpose: $4,055,000
Retired Nonguaranteed - Public Debt for Private Purpose: $2,427,000
Issue, Unspecified Public Purpose: $1,779,000
- Miscellaneous - Fines and Forfeits: $352,000
General Revenue - Other: $257,000
Donations From Private Sources: $131,000
Rents: $61,000
Sale of Property: $14,000
- Other Capital Outlay - Elementary and Secondary Education: $497,000
Police Protection: $204,000
Health - Other: $178,000
General Public Building: $106,000
Parks and Recreation: $95,000
Central Staff Services: $91,000
Housing and Community Development: $57,000
- Other Funds - Cash and Securities: $11,916,000
- Revenue - Water Utilities: $266,000
- Short Term Debt Outstanding - Beginning: $3,006,000
End of Fiscal Year: $2,261,000
- Sinking Funds - Cash and Securities: $80,524,000
- State Intergovernmental - Education: $9,913,000
General Local Government Support: $2,989,000
Other: $2,182,000
Public Welfare: $277,000
- Tax - Property: $19,982,000
General Sales and Gross Receipts: $898,000
Other License: $417,000
Other Selective Sales: $376,000
Public Utilities Sales: $346,000
Motor Vehicle License: $325,000
- Total Salaries and Wages: $13,376,000
- Water Utilities - Interest on Debt: $27,000
Supplemental Security Income (SSI) in 2006:
- Total number of recipients: 121
- Number of aged recipients: 36
- Number of blind and disabled recipients: 85
- Number of recipients under 18: 7
- Number of recipients between 18 and 64: 63
- Number of recipients older than 64: 51
- Number of recipients also receiving OASDI: 66
- Amount of payments (thousands of dollars): 39
| Most common first names in Clarke County, VA among deceased individuals | ||
| Name | Count | Lived (average) |
|---|---|---|
| John | 118 | 73.8 years |
| Mary | 98 | 78.4 years |
| James | 87 | 72.0 years |
| William | 80 | 74.7 years |
| Charles | 74 | 76.4 years |
| Robert | 58 | 69.6 years |
| George | 38 | 76.4 years |
| Dorothy | 35 | 75.6 years |
| Thomas | 35 | 77.6 years |
| Ruth | 34 | 82.1 years |
| Most common last names in Clarke County, VA among deceased individuals | ||
| Last name | Count | Lived (average) |
|---|---|---|
| Smith | 38 | 74.8 years |
| Lloyd | 35 | 78.4 years |
| Brown | 32 | 79.0 years |
| Johnson | 31 | 75.1 years |
| Jenkins | 31 | 76.5 years |
| Mcdonald | 29 | 76.1 years |
| Williams | 28 | 82.5 years |
| Jones | 26 | 80.0 years |
| Jackson | 24 | 75.5 years |
| Huff | 21 | 76.2 years |
| Businesses in Clarke County, VA | ||||
| Name | Count | Name | Count | |
|---|---|---|---|---|
| 7-Eleven | 2 | RadioShack | 1 | |
| Baskin-Robbins | 1 | Subway | 2 | |
| Dunkin Donuts | 1 | True Value | 1 | |
| FedEx | 1 | U-Haul | 1 | |
| McDonald's | 1 | UPS | 1 | |