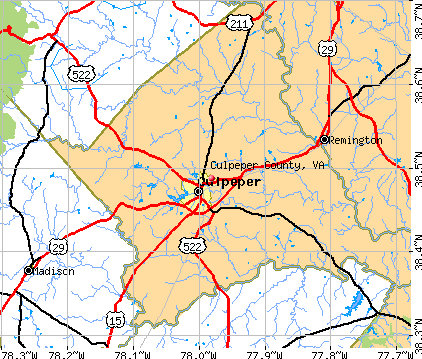
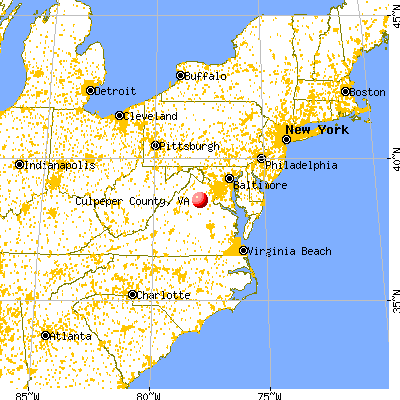
Culpeper County, Virginia (VA)
County owner-occupied free and clear houses and condos in 2010: 2,716
County owner-occupied houses and condos in 2000: 8,560
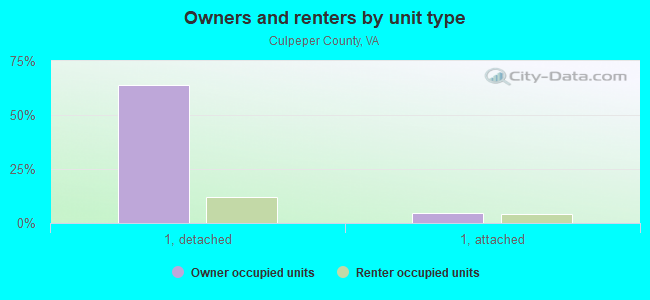
Renter-occupied apartments: 4,623 (it was 3,581 in 2000)
| % of renters here: | 29% |
| State: | 33% |
Land area: 381 sq. mi.
Water area: 1.3 sq. mi.
Population density: 140 people per square mile (average).
Industries providing employment: Educational, health and social services (21.9%), Professional, scientific, management, administrative, and waste management services (12.2%), Retail trade (11.3%).
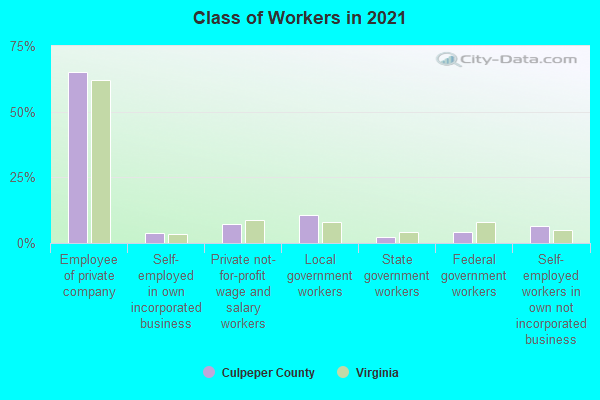
Type of workers:
- Private wage or salary: 76%
- Government: 18%
- Self-employed, not incorporated: 5%
- Unpaid family work: 0%
- OSM Map
- General Map
- Google Map
- MSN Map

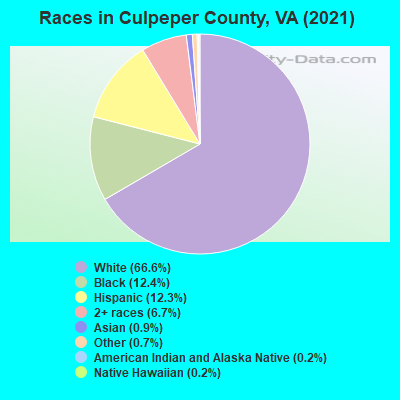
- 35,37166.5%White Non-Hispanic Alone
- 6,85412.9%Hispanic or Latino
- 6,82812.8%Black Non-Hispanic Alone
- 3,2406.1%Two or more races
- 3910.7%Asian alone
- 2850.5%Some other race alone
- 1550.3%American Indian and Alaska Native alone
- 760.1%Native Hawaiian and Other
Pacific Islander alone
| Median resident age: | 39.8 years |
| Virginia median age: | 39.0 years |
| Males: 26,592 | |
| Females: 26,592 |

 | is NoVA where the North ends? (45 replies) |
| Does Madison County feel connected to DC? (12 replies) |
| Where is Northern Virginia? (25 replies) |
| Winchester and surrounding areas (47 replies) |
| Civil-Asset Forfeiture in NoVa? (48 replies) |
| Relocating to Northern Virginia (Staunton, Warrenton, Fredericksburg) (10 replies) |
| Culpeper County: | 2.0 people |
| Virginia: | 3 people |
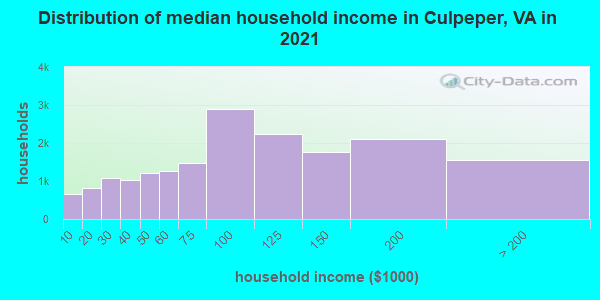
Estimated median household income in 2022: $90,902 ($45,290 in 1999)
| This county: | $90,902 |
| Virginia: | $85,873 |
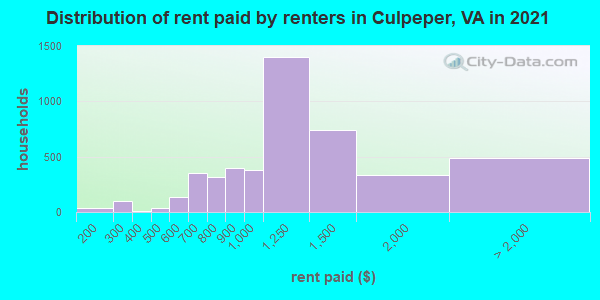
Median contract rent in 2022 for apartments: $1,139 (lower quartile is $896, upper quartile is $1,361)
| This county: | $1139 |
| State: | $1270 |
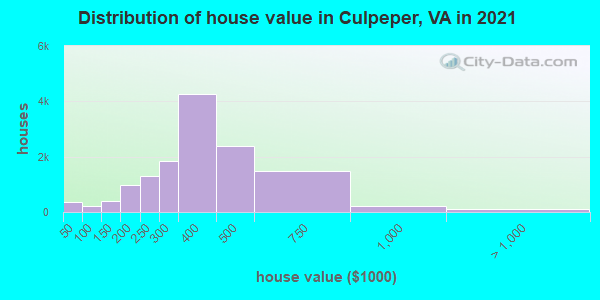
Estimated median house or condo value in 2022: $397,771 (it was $131,400 in 2000)
| Culpeper: | $397,771 |
| Virginia: | $365,700 |
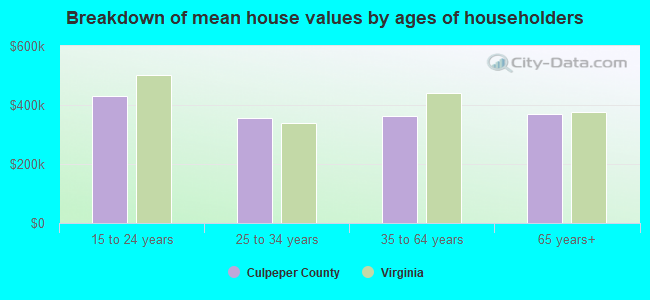
Mean price in 2022:
Median monthly housing costs for homes and condos with a mortgage: $1,818Detached houses: $420,788
Here: $420,788 State: $472,865 Townhouses or other attached units: $264,192
Here: $264,192 State: $457,437 Mobile homes: $110,928
Here: $110,928 State: $100,736
Median monthly housing costs for units without a mortgage: $493
Institutionalized population: 1,629
Crime in 2021 (reported by the sheriff's office or county police, not the county total):
- Murders: 0
- Rapes: 0
- Robberies: 1
- Assaults: 19
- Burglaries: 6
- Thefts: 90
- Auto thefts: 19
Crime in 2020 (reported by the sheriff's office or county police, not the county total):
- Murders: 0
- Rapes: 2
- Robberies: 1
- Assaults: 9
- Burglaries: 14
- Thefts: 95
- Auto thefts: 16
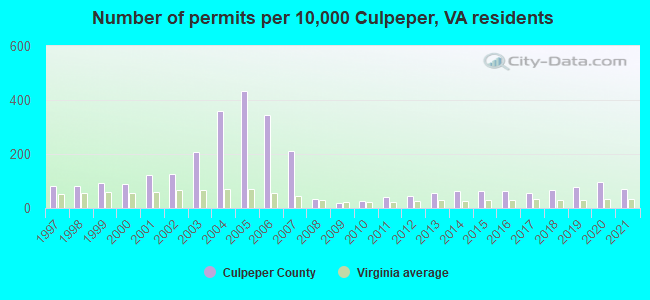
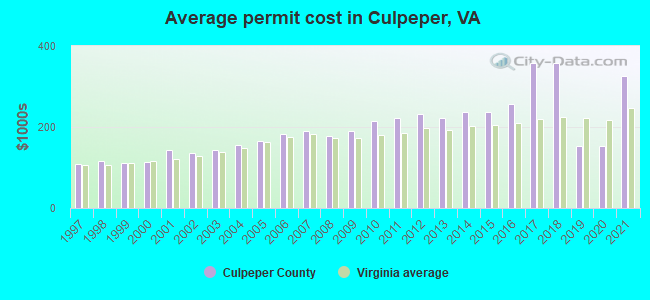
Single-family new house construction building permits:
- 2022: 306 buildings, average cost: $337,500
- 2021: 237 buildings, average cost: $325,900
- 2020: 333 buildings, average cost: $152,700
- 2019: 264 buildings, average cost: $152,700
- 2018: 222 buildings, average cost: $357,100
- 2017: 197 buildings, average cost: $357,100
- 2016: 213 buildings, average cost: $257,500
- 2015: 216 buildings, average cost: $237,400
- 2014: 215 buildings, average cost: $237,800
- 2013: 192 buildings, average cost: $222,500
- 2012: 147 buildings, average cost: $232,700
- 2011: 137 buildings, average cost: $220,800
- 2010: 93 buildings, average cost: $213,600
- 2009: 57 buildings, average cost: $190,700
- 2008: 113 buildings, average cost: $178,600
- 2007: 726 buildings, average cost: $190,500
- 2006: 1184 buildings, average cost: $182,200
- 2005: 1482 buildings, average cost: $164,900
- 2004: 1236 buildings, average cost: $156,300
- 2003: 707 buildings, average cost: $142,100
- 2002: 432 buildings, average cost: $136,900
- 2001: 422 buildings, average cost: $141,500
- 2000: 301 buildings, average cost: $114,000
- 1999: 315 buildings, average cost: $112,400
- 1998: 285 buildings, average cost: $116,200
- 1997: 284 buildings, average cost: $109,300
Median real estate property taxes paid for housing units with mortgages in 2022: $2,174 (0.5%)
Median real estate property taxes paid for housing units with no mortgage in 2022: $1,969 (0.5%)
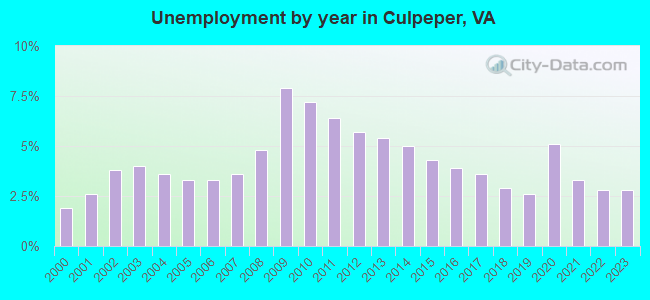
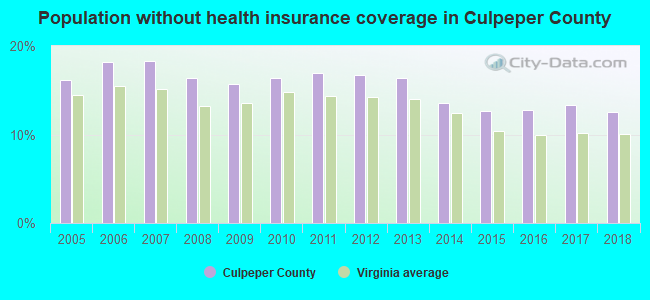
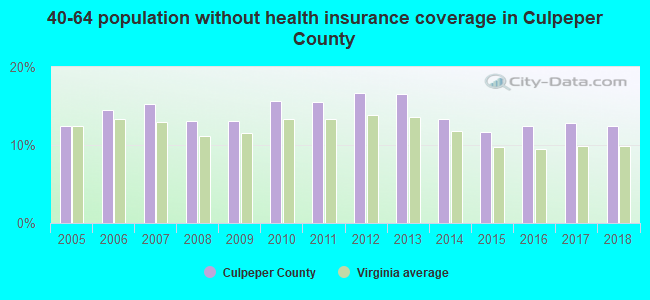
| Culpeper County: | 7.8% |
| Virginia: | 10.6% |
Median age of residents in 2022: 39.8 years old
(Males: 39.4 years old, Females: 40.2 years old)
(Median age for: White residents: 43.8 years old, Black residents: 41.5 years old, American Indian residents: 32.8 years old, Asian residents: 48.6 years old, Hispanic or Latino residents: 24.3 years old, Other race residents: 23.5 years old)
Fair market rent in 2006 for a 1-bedroom apartment in Culpeper County is $610 a month.
Fair market rent for a 2-bedroom apartment is $722 a month.
Fair market rent for a 3-bedroom apartment is $934 a month.
Cities in this county include: Culpeper.
Neighboring counties: Prince George's County, Maryland  , El Paso County, Colorado
  , Finney County, Kansas , Johnson County, Kansas , Rice County, Kansas , Nicholas County, Kentucky , Thomas County, Kansas .
| Here: | 2.5% |
| Virginia: | 2.7% |
Current college students: 919
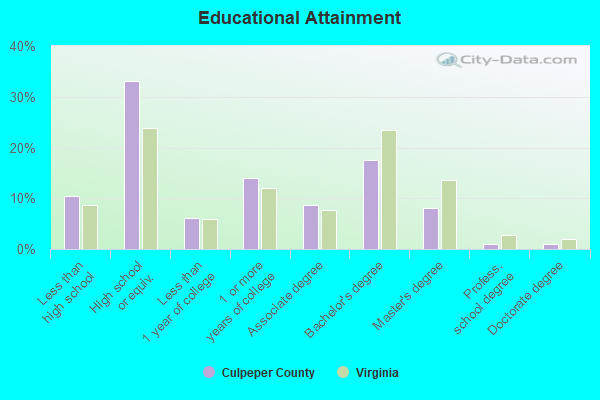
People 25 years of age or older with a high school degree or higher: 89.4%
People 25 years of age or older with a bachelor's degree or higher: 26.8%
Number of foreign born residents: 4,329 (45.0% naturalized citizens)
| Culpeper County: | 8.1% |
| Whole state: | 12.7% |
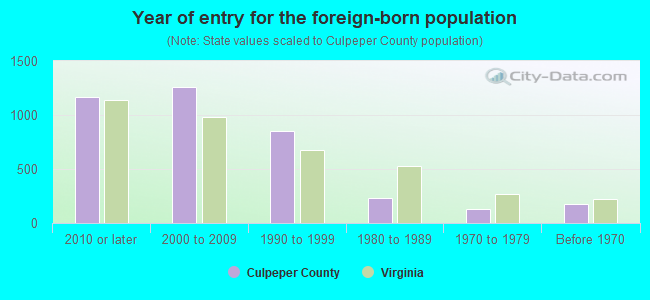
- Year of entry for the foreign-born population
- 1,6072010 or later
- 1,2922000 to 2009
- 7391990 to 1999
- 2271980 to 1989
- 1261970 to 1979
- 177Before 1970
Mean travel time to work (commute): # minutes
Percentage of county residents living and working in this county: 98.6%
Housing units in structures:
- One, detached: 16,023
- One, attached: 1,295
- Two: 197
- 3 or 4: 168
- 5 to 9: 321
- 10 to 19: 766
- 20 to 49: 317
- 50 or more: 165
- Mobile homes: 329
Housing units in Culpeper County with a mortgage: 10,029 (857 second mortgage, 56 home equity loan, 628 both second mortgage and home equity loan)
Houses without a mortgage: 190
| Here: | 5.0% with mortgage |
| State: | 97.2% with mortgage |
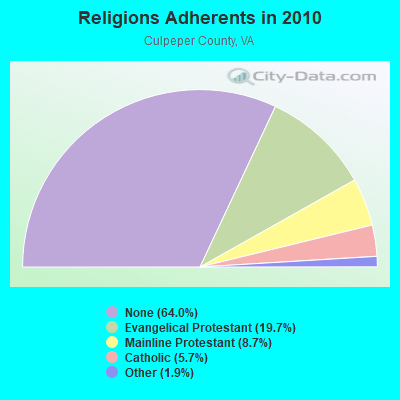
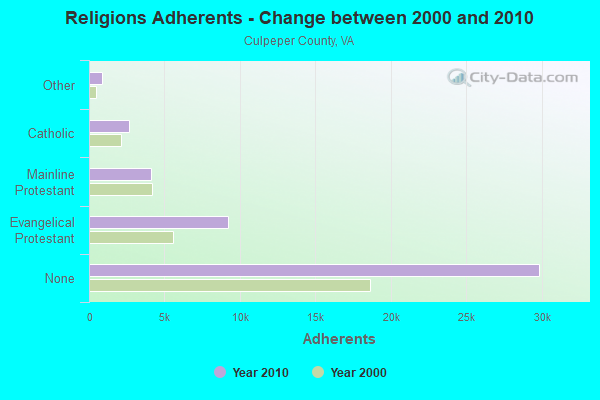
Religion statistics for Culpeper County
| Religion | Adherents | Congregations |
|---|---|---|
| Evangelical Protestant | 9,198 | 48 |
| Mainline Protestant | 4,084 | 14 |
| Catholic | 2,655 | 1 |
| Other | 893 | 4 |
| None | 29,859 | - |
Source: Clifford Grammich, Kirk Hadaway, Richard Houseal, Dale E.Jones, Alexei Krindatch, Richie Stanley and Richard H.Taylor. 2012. 2010 U.S.Religion Census: Religious Congregations & Membership Study. Association of Statisticians of American Religious Bodies. Jones, Dale E., et al. 2002. Congregations and Membership in the United States 2000. Nashville, TN: Glenmary Research Center.
Food Environment Statistics:
| Culpeper County: | 1.97 / 10,000 pop. |
| State: | 2.03 / 10,000 pop. |
| Here: | 0.22 / 10,000 pop. |
| Virginia: | 0.17 / 10,000 pop. |
| This county: | 1.10 / 10,000 pop. |
| Virginia: | 1.43 / 10,000 pop. |
| Culpeper County: | 3.95 / 10,000 pop. |
| Virginia: | 4.03 / 10,000 pop. |
| This county: | 5.70 / 10,000 pop. |
| State: | 7.65 / 10,000 pop. |
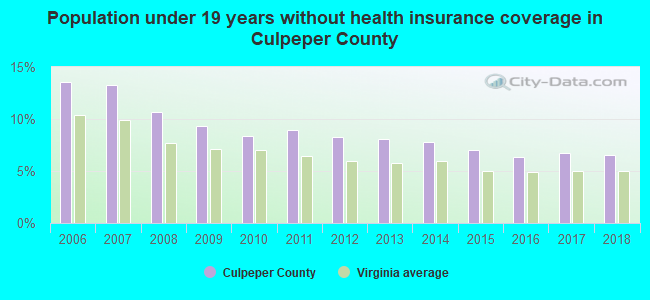
| Culpeper County: | 8.9% |
| Virginia: | 9.3% |
| Culpeper County: | 27.5% |
| State: | 26.7% |
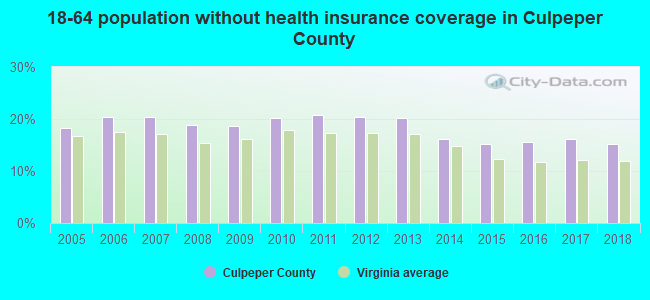
| Here: | 21.4% |
| State: | 18.6% |
Agriculture in Culpeper County:
Average size of farms: 187 acresAverage value of agricultural products sold per farm: $54,877
Average value of crops sold per acre for harvested cropland: $383.36
The value of nursery, greenhouse, floriculture, and sod as a percentage of the total market value of agricultural products sold: 40.37%
The value of livestock, poultry, and their products as a percentage of the total market value of agricultural products sold: 48.65%
Average total farm production expenses per farm: $51,177
Harvested cropland as a percentage of land in farms: 39.30%
Average market value of all machinery and equipment per farm: $46,260
The percentage of farms operated by a family or individual: 88.19%
Average age of principal farm operators: 57 years
Average number of cattle and calves per 100 acres of all land in farms: 24.11
Milk cows as a percentage of all cattle and calves: 10.16%
Corn for grain: 8490 harvested acres
All wheat for grain: 1246 harvested acres
Soybeans for beans: 6032 harvested acres
Vegetables: 50 harvested acres
Land in orchards: 89 acres
Earthquake activity:
Culpeper County-area historical earthquake activity is significantly above Virginia state average. It is 51% smaller than the overall U.S. average.On 8/23/2011 at 17:51:04, a magnitude 5.8 (5.8 MW, Depth: 3.7 mi, Class: Moderate, Intensity: VI - VII) earthquake occurred 40.0 miles away from Culpeper County center
On 8/25/2011 at 05:07:52, a magnitude 4.5 (4.5 ML, Depth: 4.2 mi, Class: Light, Intensity: IV - V) earthquake occurred 37.3 miles away from the county center
On 12/9/2003 at 20:59:18, a magnitude 4.5 (4.5 ML, Depth: 6.2 mi) earthquake occurred 49.7 miles away from the county center
On 12/9/2003 at 20:59:14, a magnitude 4.5 (4.5 MB, 4.5 LG) earthquake occurred 62.3 miles away from the county center
On 8/9/2020 at 12:07:37, a magnitude 5.1 (5.1 MW, Depth: 4.7 mi) earthquake occurred 220.2 miles away from Culpeper County center
On 8/24/2011 at 00:04:36, a magnitude 4.2 (4.2 ML) earthquake occurred 39.6 miles away from the county center
Magnitude types: regional Lg-wave magnitude (LG), body-wave magnitude (MB), local magnitude (ML), moment magnitude (MW)
Most recent natural disasters:
- Virginia Covid-19 Pandemic, Incident Period: January 20, 2020, Major Disaster (Presidential) Declared DR-4512-VA: April 2, 2020, FEMA Id: 4512, Natural disaster type: Other
- Virginia Severe Winter Storm And Snowstorm, Incident Period: January 22, 2016 to January 23, 2016, Major Disaster (Presidential) Declared DR-4262: March 07, 2016, FEMA Id: 4262, Natural disaster type: Snowstorm, Winter Storm
- Virginia Hurricane Sandy, Incident Period: October 26, 2012 to November 01, 2012, Emergency Declared EM-3359: October 29, 2012, FEMA Id: 3359, Natural disaster type: Hurricane
- Virginia Severe Storms and Straight-line Winds, Incident Period: June 29, 2012 to July 01, 2012, Major Disaster (Presidential) Declared DR-4072: July 27, 2012, FEMA Id: 4072, Natural disaster type: Storm, Wind
- Virginia Earthquake, Incident Period: August 23, 2011 to October 25, 2011, Major Disaster (Presidential) Declared DR-4042: November 04, 2011, FEMA Id: 4042, Natural disaster type: Earthquake
- Virginia Severe Winter Storms and Snowstorms, Incident Period: February 05, 2010 to February 11, 2010, Major Disaster (Presidential) Declared DR-1905: April 27, 2010, FEMA Id: 1905, Natural disaster type: Snowstorm, Winter Storm
- Virginia Severe Winter Storm and Snowstorm, Incident Period: December 18, 2009 to December 20, 2009, Major Disaster (Presidential) Declared DR-1874: February 16, 2010, FEMA Id: 1874, Natural disaster type: Snowstorm, Winter Storm
- Virginia Hurricane Katrina Evacuation, Incident Period: August 29, 2005 to October 01, 2005, Emergency Declared EM-3240: September 12, 2005, FEMA Id: 3240, Natural disaster type: Hurricane
- Virginia Hurricane Isabel, Incident Period: September 18, 2003 to October 01, 2003, Major Disaster (Presidential) Declared DR-1491: September 18, 2003, FEMA Id: 1491, Natural disaster type: Hurricane
- Virginia Winter Storm, Incident Period: January 25, 2000 to January 30, 2000, Major Disaster (Presidential) Declared DR-1318: February 28, 2000, FEMA Id: 1318, Natural disaster type: Winter Storm
- 8 other natural disasters have been reported since 1953.
The number of natural disasters in Culpeper County (18) is near the US average (15).
Major Disasters (Presidential) Declared: 14
Emergencies Declared: 4
Causes of natural disasters: Winter Storms: 6, Hurricanes: 4, Storms: 4, Snowstorms: 3, Floods: 2, Blizzard: 1, Drought: 1, Earthquake: 1, Ice Storm: 1, Tropical Storm: 1, Wind: 1, Other: 1 (Note: some incidents may be assigned to more than one category).
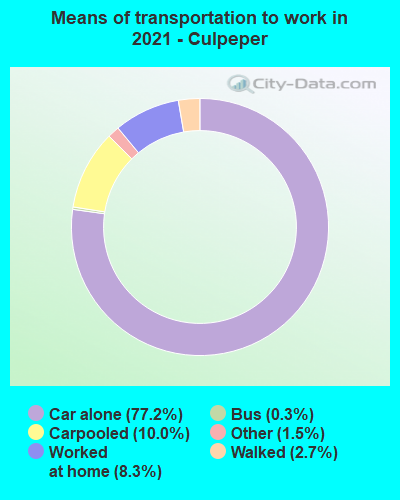
Means of transportation to work:
- Drove a car alone: 13,102 (70.1%)
- Carpooled: 1,886 (10.1%)
- Bus: 44 (0.2%)
- Subway or elevated rail: 19 (0.1%)
- Taxicab, motorcycle, or other means: 239 (1.3%)
- Walked: 633 (3.4%)
- Worked at home: 2,672 (14.3%)
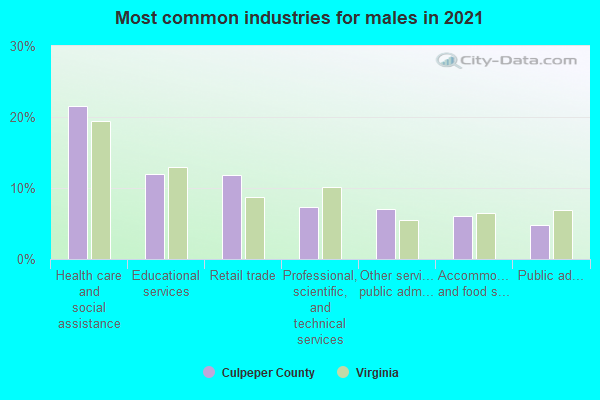
- Health care and social assistance (20%)
- Retail trade (13%)
- Educational services (12%)
- Professional, scientific, and technical services (7%)
- Other services, except public administration (7%)
- Accommodation and food services (6%)
- Public administration (5%)
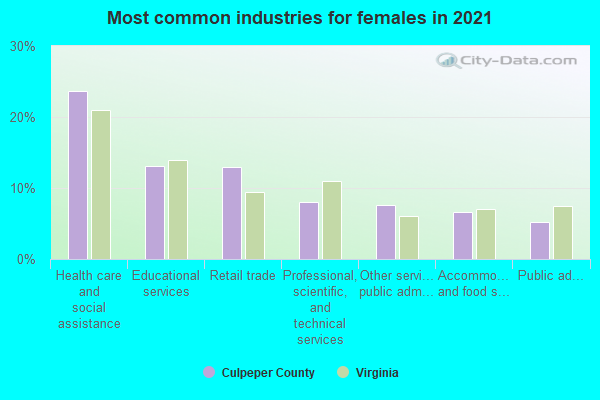
- Health care and social assistance (23%)
- Retail trade (15%)
- Educational services (14%)
- Professional, scientific, and technical services (8%)
- Other services, except public administration (8%)
- Accommodation and food services (6%)
- Public administration (5%)
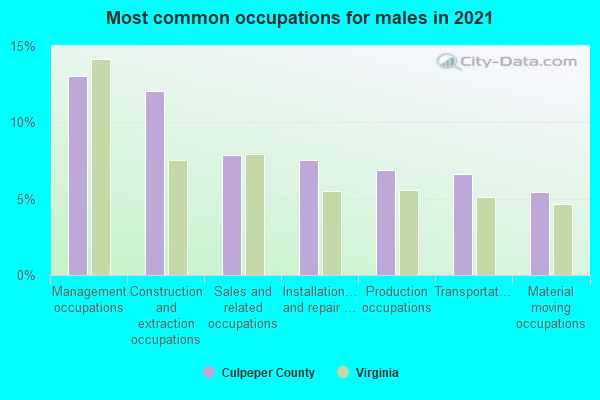
- Management occupations (13%)
- Construction and extraction occupations (11%)
- Production occupations (8%)
- Sales and related occupations (8%)
- Transportation occupations (7%)
- Installation, maintenance, and repair occupations (7%)
- Business and financial operations occupations (5%)
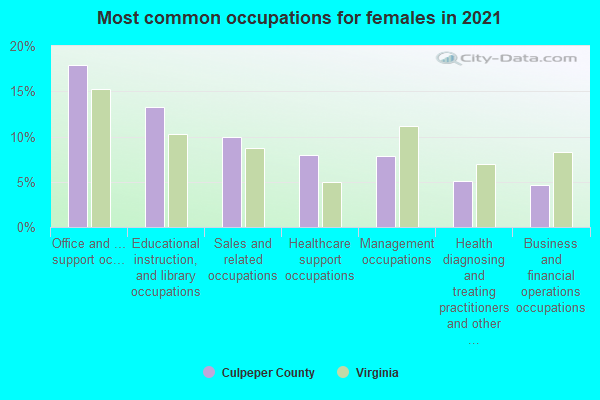
- Office and administrative support occupations (18%)
- Educational instruction, and library occupations (13%)
- Sales and related occupations (10%)
- Management occupations (9%)
- Healthcare support occupations (7%)
- Business and financial operations occupations (5%)
- Food preparation and serving related occupations (5%)
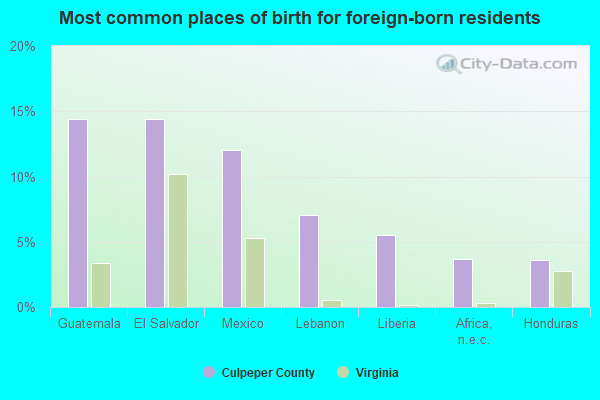
- El Salvador (16%)
- Guatemala (13%)
- Mexico (11%)
- Honduras (7%)
- Lebanon (4%)
- Liberia (4%)
- Peru (3%)
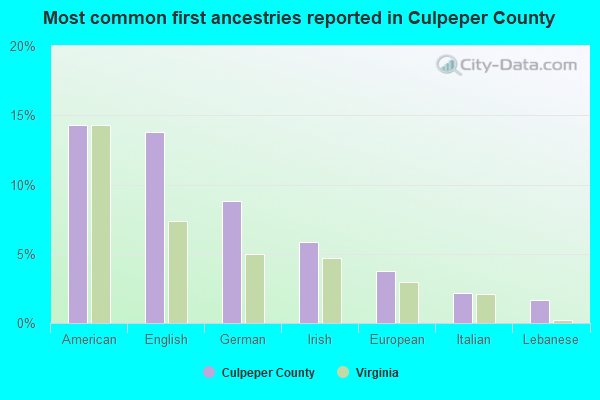
- English (13%)
- American (13%)
- German (8%)
- Irish (7%)
- European (4%)
- Italian (3%)
- Lebanese (1%)
People in group quarters in Culpeper County, Virginia in 2010:
- 1,196 people in state prisons
- 151 people in nursing facilities/skilled-nursing facilities
- 148 people in correctional facilities intended for juveniles
- 67 people in local jails and other municipal confinement facilities
- 63 people in residential treatment centers for juveniles (non-correctional)
- 53 people in other noninstitutional facilities
- 35 people in workers' group living quarters and job corps centers
- 21 people in group homes intended for adults
- 19 people in emergency and transitional shelters (with sleeping facilities) for people experiencing homelessness
- 4 people in group homes for juveniles (non-correctional)
- 4 people in residential treatment centers for adults
People in group quarters in Culpeper County, Virginia in 2000:
- 1,223 people in federal prisons and detention centers
- 169 people in nursing homes
- 144 people in homes for abused, dependent, and neglected children
- 65 people in other noninstitutional group quarters
- 56 people in local jails and other confinement facilities (including police lockups)
- 46 people in residential treatment centers for emotionally disturbed children
- 12 people in homes for the mentally retarded
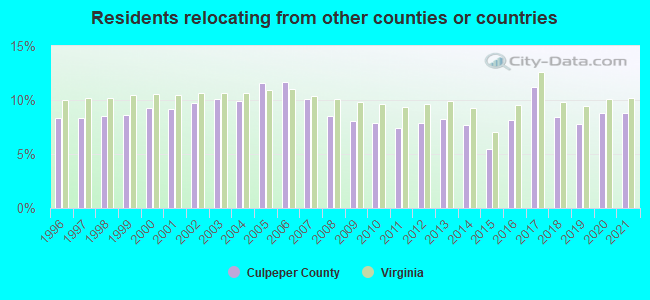
8.79% of this county's 2021 resident taxpayers lived in other counties in 2020 ($69,569 average adjusted gross income)
| Here: | 8.79% |
| Virginia average: | 10.16% |
10 or fewer of this county's residents moved from foreign countries.
6.58% relocated from other counties in Virginia ($55,202 average AGI)
2.21% relocated from other states ($14,367 average AGI)
Culpeper County: 2.21% Virginia average: 3.91%
Top counties from which taxpayers relocated into this county between 2020 and 2021:
| from Fauquier County, VA | |
| from Prince William County, VA | |
| from Fairfax County, VA | |
| from Orange County, VA | |
| from Loudoun County, VA | |
| from Spotsylvania County, VA | |
| from Manassas city, VA |
7.56% of this county's 2020 resident taxpayers moved to other counties in 2021 ($64,928 average adjusted gross income)
| Here: | 7.56% |
| Virginia average: | 10.20% |
10 or fewer of this county's residents moved to foreign countries.
5.48% relocated to other counties in Virginia ($46,983 average AGI)
2.08% relocated to other states ($17,945 average AGI)
Culpeper County: 2.08% Virginia average: 3.98%

Top counties to which taxpayers relocated from this county between 2020 and 2021:
| to Fauquier County, VA | |
| to Orange County, VA | |
| to Madison County, VA | |
| to Prince William County, VA | |
| to Spotsylvania County, VA | |
| to Fairfax County, VA | |
| to Stafford County, VA |
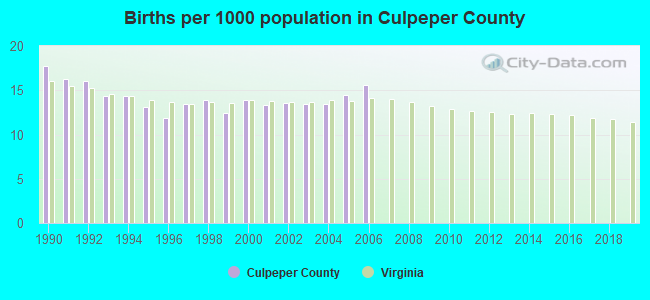
Births per 1000 population from 1990 to 1999: 14.3
Births per 1000 population from 2000 to 2006: 14.0
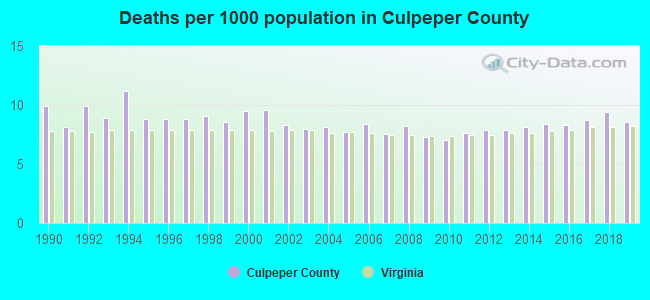
Deaths per 1000 population from 1990 to 1999: 9.2
Deaths per 1000 population from 2000 to 2009: 8.3
Deaths per 1000 population from 2010 to 2020: 8.2
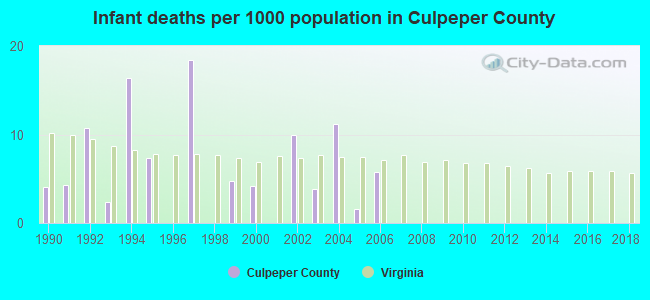
Infant deaths per 1000 live births from 1990 to 1999: 6.8
Infant deaths per 1000 live births from 2000 to 2006: 5.2
Persons under 19 years old without health insurance coverage in 2018: 6.5%

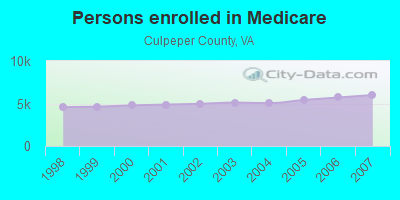
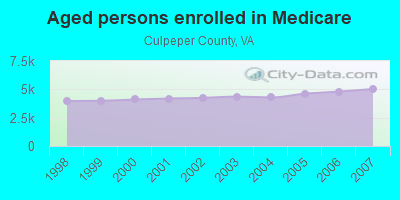
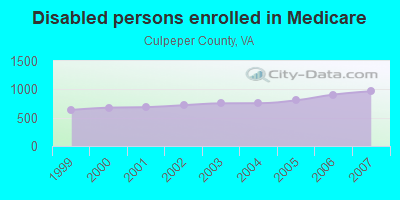
Persons enrolled in hospital insurance and/or supplemental medical insurance (Medicare) in July 1, 2007: 5,994 (5,027 aged, 967 disabled)
Children under 18 without health insurance coverage in 2007: 1,455 (12%)
Most common underlying causes of death in Culpeper County, Virginia in 1999 - 2019:
- Bronchus or lung, unspecified - Malignant neoplasms (471)
- Atherosclerotic heart disease (359)
- Acute myocardial infarction, unspecified (307)
- Chronic obstructive pulmonary disease, unspecified (304)
- Unspecified dementia (190)
- Stroke, not specified as haemorrhage or infarction (188)
- Alzheimer disease, unspecified (162)
- Septicaemia, unspecified (93)
- Congestive heart failure (52)
- Breast, unspecified - Malignant neoplasms (43)
Population without health insurance coverage in 2000: 12%
Children under 18 without health insurance coverage in 2000: 9%
Short term general hospital admissions per 100,000 population in 2004: 9,977
Short term general hospital beds per 100,000 population in 2004: 149
Emergency room visits per 100,000 population in 2004: 55,578
General practice office based MDs per 100,000 population in 2005: 1,237
Medical specialist MDs per 100,000 population in 2005: 884
Dentists per 100,000 population in 1998: 2
Total births per 100,000 population, July 2005 - July 2006 : 30
Total deaths per 100,000 population, July 2005 - July 2006: 63
Limited-service eating places per 100,000 population in 2005 : 12
Suicides per 1,000,000 population from 2000 to 2006: 140.6. This is more than state average.
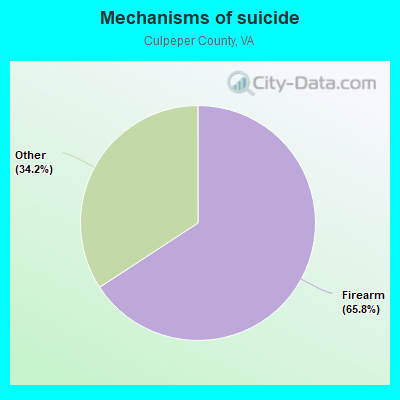
- Firearm - 92.5
- Other - 48.1
Household type by relationship:
Households: 53,184- Male householders: 9,025 (1,501 living alone), Female householders: 9,668 (2,057 living alone)
10,152 spouses (10,012 opposite-sex spouses), 1,557 unmarried partners, (1,519 opposite-sex unmarried partners), 15,780 children (15,119 natural, 148 adopted, 535 stepchildren), 1,641 grandchildren, 456 brothers or sisters, 960 parents, 45 foster children, 921 other relatives, 1,399 non-relatives
- In group quarters: 1,476
Size of family households: 5,835 2-persons, 3,115 3-persons, 2,743 4-persons, 1,610 5-persons, 501 6-persons, 418 7-or-more-persons.
Size of nonfamily households: 3,559 1-person, 709 2-persons, 64 3-persons, 45 4-persons, 33 5-persons.
7,448 married couples with children.
3,278 single-parent households (1,163 men, 2,115 women).
87.4% of residents of Culpeper speak English at home.
9.3% of residents speak Spanish at home (61% speak English very well, 11% speak English well, 17% speak English not well, 11% don't speak English at all).
1.4% of residents speak other Indo-European language at home (75% speak English very well, 18% speak English well, 7% don't speak English at all).
0.5% of residents speak Asian or Pacific Island language at home (47% speak English very well, 41% speak English well, 12% speak English not well, 1% don't speak English at all).
1.1% of residents speak other language at home (64% speak English very well, 33% speak English well, 3% don't speak English at all).
In fiscal year 2004:
Federal Government expenditure: $178,828,000 ($4,449 per capita)
Department of Defense expenditure: $11,024,000
Federal direct payments to individuals for retirement and disability: $98,083,000
Federal other direct payments to individuals: $33,134,000
Federal direct payments not to individuals: $1,698,000
Federal grants: $31,963,000
Federal procurement contracts: $5,255,000 ($396,000 Department of Defense)
Federal salaries and wages: $8,696,000 ($505,000 Department of Defense)
Federal Government direct loans: $4,775,000
Federal guaranteed/insured loans: $48,975,000
Federal Government insurance: $10,629,000
Population change from April 1, 2000 to July 1, 2005:
Births: 2,691| Here: | 63 per 1000 residents |
| State: | 70 per 1000 residents |
Deaths: 1,629
| Here: | 38 per 1000 residents |
| State: | 40 per 1000 residents |
Net international migration: +364
| Here: | +9 per 1000 residents |
| State: | +18 per 1000 residents |
Net internal migration: +6,932
| Here: | +163 per 1000 residents |
| State: | +14 per 1000 residents |
Total withdrawal of fresh water for public supply: 1.72 millions of gallons per day (13% from ground, 87% from surface)
| Here: | 7.1 |
| State: | 7.0 |
| Here: | 4.8 |
| State: | 4.3 |
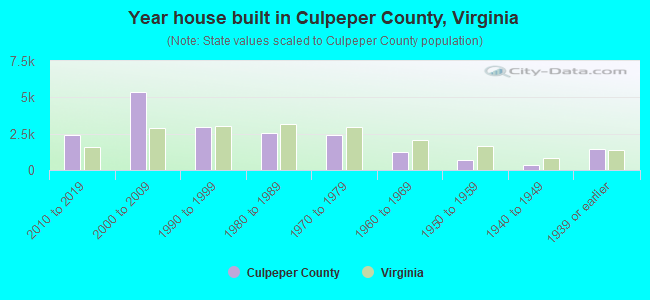
- Year house built in Culpeper County, Virginia
- 662020 or later
- 2,4052010 to 2019
- 5,4652000 to 2009
- 3,1061990 to 1999
- 2,4761980 to 1989
- 2,3551970 to 1979
- 1,0481960 to 1969
- 9131950 to 1959
- 2991940 to 1949
- 1,5161939 or earlier
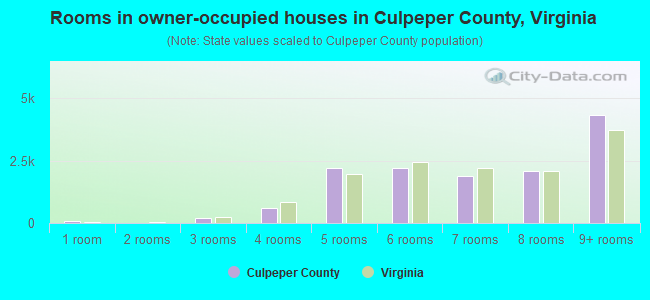
- Rooms in owner-occupied houses in Culpeper County, Virginia
- 571 room
- 112 rooms
- 1173 rooms
- 7624 rooms
- 2,2525 rooms
- 2,5896 rooms
- 1,9067 rooms
- 1,9398 rooms
- 4,3409+ rooms
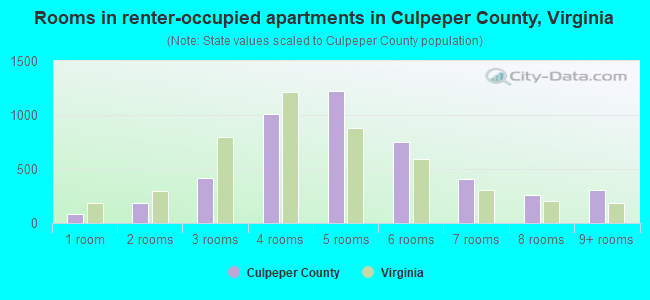
- Rooms in renter-occupied apartments in Culpeper County, Virginia
- 331 room
- 1782 rooms
- 4893 rooms
- 1,0824 rooms
- 1,3185 rooms
- 5856 rooms
- 4577 rooms
- 1858 rooms
- 3599+ rooms
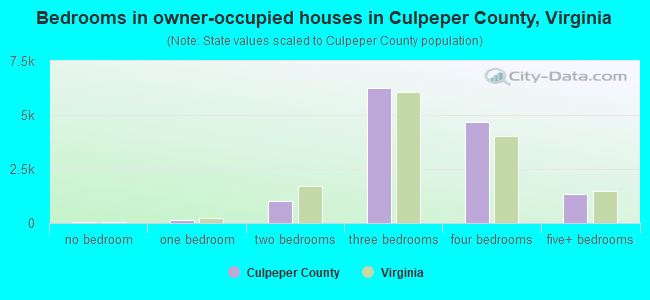
- Bedrooms in owner-occupied houses in Culpeper County, Virginia
- 63no bedroom
- 1291 bedroom
- 1,0162 bedrooms
- 6,6823 bedrooms
- 4,6774 bedrooms
- 1,4395+ bedrooms
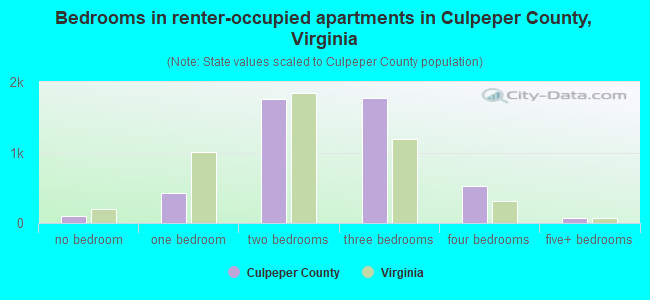
- Bedrooms in renter-occupied apartments in Culpeper County, Virginia
- 48no bedroom
- 5451 bedroom
- 1,8142 bedrooms
- 1,7033 bedrooms
- 4494 bedrooms
- 1335+ bedrooms
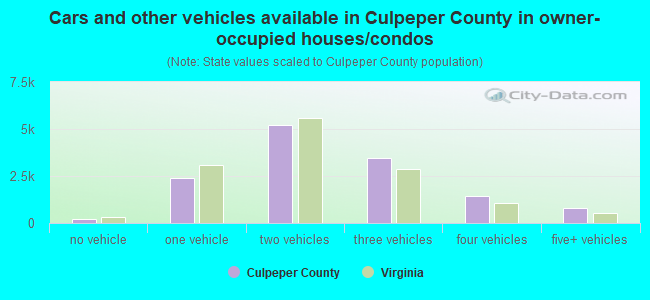
- Cars and other vehicles available in Culpeper County in owner-occupied houses/condos
- 106no vehicle
- 2,6841 vehicle
- 5,5702 vehicles
- 3,2523 vehicles
- 1,4884 vehicles
- 8365+ vehicles
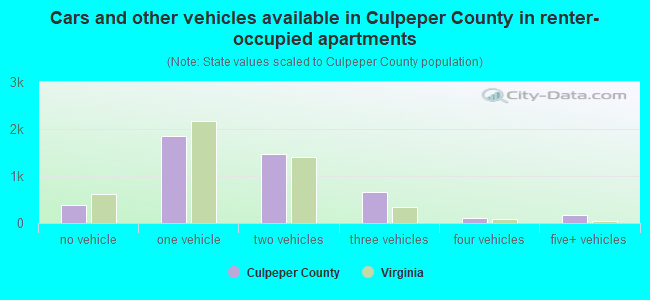
- Cars and other vehicles available in Culpeper County in renter-occupied apartments
- 526no vehicle
- 1,9771 vehicle
- 1,2882 vehicles
- 6423 vehicles
- 1114 vehicles
- 1855+ vehicles
89.3% of Culpeper County residents lived in the same house 1 years ago.
Out of people who lived in different houses, 24% lived in this county.
Out of people who lived in different counties, 78% lived in Virginia.
| Culpeper County: | 89.3% |
| State average: | 86.6% |
Place of birth for U.S.-born residents:
- This state: 30,178
- Other state: 17,807
- Northeast: 5,185
- Midwest: 2,699
- South: 7,430
- West: 2,510
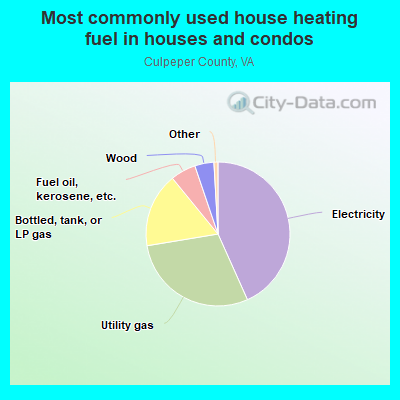
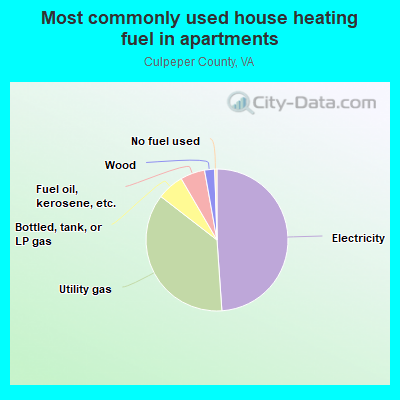
- 44.0%Electricity
- 27.9%Utility gas
- 17.4%Bottled, tank, or LP gas
- 5.7%Fuel oil, kerosene, etc.
- 4.2%Wood
- 0.4%No fuel used
- 0.3%Other fuel
- 53.7%Electricity
- 31.9%Utility gas
- 6.3%Fuel oil, kerosene, etc.
- 5.6%Bottled, tank, or LP gas
- 2.3%Wood
- 0.2%No fuel used
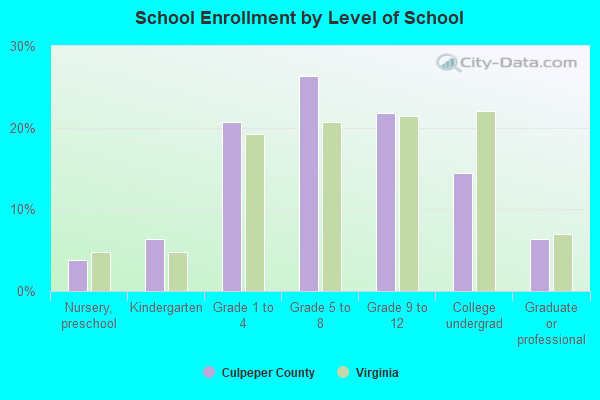
Private vs. public school enrollment:
| Here: | 18.0% |
| Virginia: | 13.2% |
| Here: | 19.0% |
| Virginia: | 10.2% |
| Here: | 7.1% |
| Virginia: | 18.7% |

Culpeper County government finances - Expenditure in 2018:
- Bond Funds - Cash and Securities: $4,057,000
- Charges - Other: $3,845,000
Elementary and Secondary Education School Lunch: $1,775,000
Solid Waste Management: $1,135,000
Sewerage: $502,000
Elementary and Secondary Education - Other: $151,000
Parks and Recreation: $112,000
Elementary and Secondary Education School Tuition and Transportation: $7,000
- Construction - Elementary and Secondary Education: $13,229,000
Regular Highways: $1,299,000
Police Protection: $916,000
Parks and Recreation: $364,000
Central Staff Services: $166,000
- Current Operations - Elementary and Secondary Education: $86,457,000
Public Welfare - Other: $15,999,000
Police Protection: $9,401,000
Correctional Institutions: $4,575,000
General - Other: $3,814,000
Judicial and Legal Services: $2,560,000
Financial Administration: $2,407,000
Local Fire Protection: $2,077,000
Solid Waste Management: $1,997,000
Central Staff Services: $1,729,000
Health - Other: $1,588,000
General Public Buildings: $1,158,000
Libraries: $1,076,000
Air Transportation: $1,068,000
Sewerage: $918,000
Water Utilities: $837,000
Parks and Recreation: $779,000
Protective Inspection and Regulation - Other: $520,000
Natural Resources - Other: $252,000
Other Higher Education: $66,000
- Federal Intergovernmental - Education: $6,815,000
Public Welfare: $3,209,000
Other: $496,000
- General - Interest on Debt: $3,686,000
- Intergovernmental to Local - Other - Elementary and Secondary Education: $22,000
- Local Intergovernmental - Education: $3,067,000
- Long Term Debt - Beginning Outstanding - Unspecified Public Purpose: $82,627,000
Outstanding Unspecified Public Purpose: $76,787,000
Retired Unspecified Public Purpose: $5,840,000
- Miscellaneous - General Revenue - Other: $3,352,000
Interest Earnings: $878,000
Sale of Property: $157,000
Fines and Forfeits: $91,000
Donations From Private Sources: $1,000
- Other Capital Outlay - Elementary and Secondary Education: $2,675,000
- Other Funds - Cash and Securities: $59,294,000
- Revenue - Water Utilities: $443,000
- State Intergovernmental - Education: $53,298,000
General Local Government Support: $6,414,000
Other: $5,318,000
Public Welfare: $4,923,000
- Tax - Property: $62,696,000
General Sales and Gross Receipts: $6,802,000
Motor Vehicle License: $1,100,000
Public Utilities Sales: $945,000
Documentary and Stock Transfer: $700,000
Occupation and Business License - Other: $561,000
Other License: $244,000
Other Selective Sales: $19,000
- Total Salaries and Wages: $53,319,000
Culpeper County government finances - Revenue in 2018:
- Bond Funds - Cash and Securities: $4,057,000
- Charges - Other: $3,845,000
Elementary and Secondary Education School Lunch: $1,775,000
Solid Waste Management: $1,135,000
Sewerage: $502,000
Elementary and Secondary Education - Other: $151,000
Parks and Recreation: $112,000
Elementary and Secondary Education School Tuition and Transportation: $7,000
- Construction - Elementary and Secondary Education: $13,229,000
Regular Highways: $1,299,000
Police Protection: $916,000
Parks and Recreation: $364,000
Central Staff Services: $166,000
- Current Operations - Elementary and Secondary Education: $86,457,000
Public Welfare - Other: $15,999,000
Police Protection: $9,401,000
Correctional Institutions: $4,575,000
General - Other: $3,814,000
Judicial and Legal Services: $2,560,000
Financial Administration: $2,407,000
Local Fire Protection: $2,077,000
Solid Waste Management: $1,997,000
Central Staff Services: $1,729,000
Health - Other: $1,588,000
General Public Buildings: $1,158,000
Libraries: $1,076,000
Air Transportation: $1,068,000
Sewerage: $918,000
Water Utilities: $837,000
Parks and Recreation: $779,000
Protective Inspection and Regulation - Other: $520,000
Natural Resources - Other: $252,000
Other Higher Education: $66,000
- Federal Intergovernmental - Education: $6,815,000
Public Welfare: $3,209,000
Other: $496,000
- General - Interest on Debt: $3,686,000
- Intergovernmental to Local - Other - Elementary and Secondary Education: $22,000
- Local Intergovernmental - Education: $3,067,000
- Long Term Debt - Beginning Outstanding - Unspecified Public Purpose: $82,627,000
Outstanding Unspecified Public Purpose: $76,787,000
Retired Unspecified Public Purpose: $5,840,000
- Miscellaneous - General Revenue - Other: $3,352,000
Interest Earnings: $878,000
Sale of Property: $157,000
Fines and Forfeits: $91,000
Donations From Private Sources: $1,000
- Other Capital Outlay - Elementary and Secondary Education: $2,675,000
- Other Funds - Cash and Securities: $59,294,000
- Revenue - Water Utilities: $443,000
- State Intergovernmental - Education: $53,298,000
General Local Government Support: $6,414,000
Other: $5,318,000
Public Welfare: $4,923,000
- Tax - Property: $62,696,000
General Sales and Gross Receipts: $6,802,000
Motor Vehicle License: $1,100,000
Public Utilities Sales: $945,000
Documentary and Stock Transfer: $700,000
Occupation and Business License - Other: $561,000
Other License: $244,000
Other Selective Sales: $19,000
- Total Salaries and Wages: $53,319,000
Culpeper County government finances - Debt in 2018:
- Bond Funds - Cash and Securities: $4,057,000
- Charges - Other: $3,845,000
Elementary and Secondary Education School Lunch: $1,775,000
Solid Waste Management: $1,135,000
Sewerage: $502,000
Elementary and Secondary Education - Other: $151,000
Parks and Recreation: $112,000
Elementary and Secondary Education School Tuition and Transportation: $7,000
- Construction - Elementary and Secondary Education: $13,229,000
Regular Highways: $1,299,000
Police Protection: $916,000
Parks and Recreation: $364,000
Central Staff Services: $166,000
- Current Operations - Elementary and Secondary Education: $86,457,000
Public Welfare - Other: $15,999,000
Police Protection: $9,401,000
Correctional Institutions: $4,575,000
General - Other: $3,814,000
Judicial and Legal Services: $2,560,000
Financial Administration: $2,407,000
Local Fire Protection: $2,077,000
Solid Waste Management: $1,997,000
Central Staff Services: $1,729,000
Health - Other: $1,588,000
General Public Buildings: $1,158,000
Libraries: $1,076,000
Air Transportation: $1,068,000
Sewerage: $918,000
Water Utilities: $837,000
Parks and Recreation: $779,000
Protective Inspection and Regulation - Other: $520,000
Natural Resources - Other: $252,000
Other Higher Education: $66,000
- Federal Intergovernmental - Education: $6,815,000
Public Welfare: $3,209,000
Other: $496,000
- General - Interest on Debt: $3,686,000
- Intergovernmental to Local - Other - Elementary and Secondary Education: $22,000
- Local Intergovernmental - Education: $3,067,000
- Long Term Debt - Beginning Outstanding - Unspecified Public Purpose: $82,627,000
Outstanding Unspecified Public Purpose: $76,787,000
Retired Unspecified Public Purpose: $5,840,000
- Miscellaneous - General Revenue - Other: $3,352,000
Interest Earnings: $878,000
Sale of Property: $157,000
Fines and Forfeits: $91,000
Donations From Private Sources: $1,000
- Other Capital Outlay - Elementary and Secondary Education: $2,675,000
- Other Funds - Cash and Securities: $59,294,000
- Revenue - Water Utilities: $443,000
- State Intergovernmental - Education: $53,298,000
General Local Government Support: $6,414,000
Other: $5,318,000
Public Welfare: $4,923,000
- Tax - Property: $62,696,000
General Sales and Gross Receipts: $6,802,000
Motor Vehicle License: $1,100,000
Public Utilities Sales: $945,000
Documentary and Stock Transfer: $700,000
Occupation and Business License - Other: $561,000
Other License: $244,000
Other Selective Sales: $19,000
- Total Salaries and Wages: $53,319,000
Culpeper County government finances - Cash and Securities in 2018:
- Bond Funds - Cash and Securities: $4,057,000
- Charges - Other: $3,845,000
Elementary and Secondary Education School Lunch: $1,775,000
Solid Waste Management: $1,135,000
Sewerage: $502,000
Elementary and Secondary Education - Other: $151,000
Parks and Recreation: $112,000
Elementary and Secondary Education School Tuition and Transportation: $7,000
- Construction - Elementary and Secondary Education: $13,229,000
Regular Highways: $1,299,000
Police Protection: $916,000
Parks and Recreation: $364,000
Central Staff Services: $166,000
- Current Operations - Elementary and Secondary Education: $86,457,000
Public Welfare - Other: $15,999,000
Police Protection: $9,401,000
Correctional Institutions: $4,575,000
General - Other: $3,814,000
Judicial and Legal Services: $2,560,000
Financial Administration: $2,407,000
Local Fire Protection: $2,077,000
Solid Waste Management: $1,997,000
Central Staff Services: $1,729,000
Health - Other: $1,588,000
General Public Buildings: $1,158,000
Libraries: $1,076,000
Air Transportation: $1,068,000
Sewerage: $918,000
Water Utilities: $837,000
Parks and Recreation: $779,000
Protective Inspection and Regulation - Other: $520,000
Natural Resources - Other: $252,000
Other Higher Education: $66,000
- Federal Intergovernmental - Education: $6,815,000
Public Welfare: $3,209,000
Other: $496,000
- General - Interest on Debt: $3,686,000
- Intergovernmental to Local - Other - Elementary and Secondary Education: $22,000
- Local Intergovernmental - Education: $3,067,000
- Long Term Debt - Beginning Outstanding - Unspecified Public Purpose: $82,627,000
Outstanding Unspecified Public Purpose: $76,787,000
Retired Unspecified Public Purpose: $5,840,000
- Miscellaneous - General Revenue - Other: $3,352,000
Interest Earnings: $878,000
Sale of Property: $157,000
Fines and Forfeits: $91,000
Donations From Private Sources: $1,000
- Other Capital Outlay - Elementary and Secondary Education: $2,675,000
- Other Funds - Cash and Securities: $59,294,000
- Revenue - Water Utilities: $443,000
- State Intergovernmental - Education: $53,298,000
General Local Government Support: $6,414,000
Other: $5,318,000
Public Welfare: $4,923,000
- Tax - Property: $62,696,000
General Sales and Gross Receipts: $6,802,000
Motor Vehicle License: $1,100,000
Public Utilities Sales: $945,000
Documentary and Stock Transfer: $700,000
Occupation and Business License - Other: $561,000
Other License: $244,000
Other Selective Sales: $19,000
- Total Salaries and Wages: $53,319,000
Supplemental Security Income (SSI) in 2006:
- Total number of recipients: 687
- Number of aged recipients: 106
- Number of blind and disabled recipients: 581
- Number of recipients under 18: 105
- Number of recipients between 18 and 64: 398
- Number of recipients older than 64: 184
- Number of recipients also receiving OASDI: 308
- Amount of payments (thousands of dollars): 263
| Home Mortgage Disclosure Act Aggregated Statistics For Year 2003 (Based on 5 full tracts) | ||||||||||||
| A) FHA, FSA/RHS & VA Home Purchase Loans | B) Conventional Home Purchase Loans | C) Refinancings | D) Home Improvement Loans | E) Loans on Dwellings For 5+ Families | F) Non-occupant Loans on < 5 Family Dwellings (A B C & D) | |||||||
|---|---|---|---|---|---|---|---|---|---|---|---|---|
| Number | Average Value | Number | Average Value | Number | Average Value | Number | Average Value | Number | Average Value | Number | Average Value | |
| LOANS ORIGINATED | 141 | $194,936 | 774 | $171,541 | 2,510 | $153,325 | 115 | $44,504 | 5 | $425,800 | 153 | $127,176 |
| APPLICATIONS APPROVED, NOT ACCEPTED | 6 | $172,333 | 74 | $167,027 | 383 | $133,919 | 35 | $36,200 | 0 | $0 | 14 | $110,000 |
| APPLICATIONS DENIED | 15 | $170,467 | 88 | $145,534 | 759 | $138,078 | 90 | $28,767 | 0 | $0 | 18 | $132,333 |
| APPLICATIONS WITHDRAWN | 21 | $198,333 | 72 | $175,167 | 421 | $147,392 | 19 | $41,316 | 0 | $0 | 15 | $165,200 |
| FILES CLOSED FOR INCOMPLETENESS | 3 | $161,667 | 13 | $184,846 | 110 | $149,236 | 5 | $35,600 | 0 | $0 | 4 | $102,250 |
| Private Mortgage Insurance Companies Aggregated Statistics For Year 2003 (Based on 5 full tracts) | ||||||
| A) Conventional Home Purchase Loans | B) Refinancings | C) Non-occupant Loans on < 5 Family Dwellings (A & B) | ||||
|---|---|---|---|---|---|---|
| Number | Average Value | Number | Average Value | Number | Average Value | |
| LOANS ORIGINATED | 122 | $200,443 | 148 | $177,486 | 12 | $103,333 |
| APPLICATIONS APPROVED, NOT ACCEPTED | 23 | $244,087 | 43 | $177,977 | 2 | $125,500 |
| APPLICATIONS DENIED | 1 | $252,000 | 1 | $209,000 | 0 | $0 |
| APPLICATIONS WITHDRAWN | 9 | $228,222 | 12 | $225,667 | 0 | $0 |
| FILES CLOSED FOR INCOMPLETENESS | 0 | $0 | 0 | $0 | 0 | $0 |
| Most common first names in Culpeper County, VA among deceased individuals | ||
| Name | Count | Lived (average) |
|---|---|---|
| Mary | 228 | 80.0 years |
| William | 223 | 72.9 years |
| John | 215 | 74.1 years |
| James | 194 | 72.7 years |
| Robert | 150 | 71.9 years |
| Charles | 116 | 71.1 years |
| George | 92 | 75.0 years |
| Elizabeth | 85 | 80.4 years |
| Dorothy | 68 | 78.2 years |
| Margaret | 66 | 79.6 years |
| Most common last names in Culpeper County, VA among deceased individuals | ||
| Last name | Count | Lived (average) |
|---|---|---|
| Jenkins | 156 | 73.6 years |
| Brown | 133 | 75.9 years |
| Smith | 96 | 74.3 years |
| Jones | 74 | 77.0 years |
| Johnson | 71 | 76.0 years |
| Williams | 61 | 73.6 years |
| Dodson | 56 | 71.8 years |
| Fincham | 48 | 75.1 years |
| Jackson | 48 | 70.3 years |
| White | 45 | 79.1 years |
| Businesses in Culpeper County, VA | ||||
| Name | Count | Name | Count | |
|---|---|---|---|---|
| 7-Eleven | 5 | MasterBrand Cabinets | 6 | |
| AT&T | 2 | Maurices | 1 | |
| Advance Auto Parts | 1 | McDonald's | 1 | |
| Arby's | 1 | Microtel | 1 | |
| AutoZone | 1 | Nike | 5 | |
| Best Western | 1 | Papa John's Pizza | 1 | |
| Blockbuster | 1 | Penske | 1 | |
| Buffalo Wild Wings | 1 | PetSmart | 1 | |
| Burger King | 1 | Pizza Hut | 1 | |
| CVS | 1 | Popeyes | 1 | |
| Chevrolet | 1 | RadioShack | 1 | |
| Chick-Fil-A | 1 | Rite Aid | 2 | |
| Cold Stone Creamery | 1 | Rodeway Inn | 1 | |
| Comfort Inn | 1 | Ruby Tuesday | 1 | |
| Dairy Queen | 1 | Safeway | 1 | |
| Famous Footwear | 1 | Sears | 1 | |
| FedEx | 5 | Sprint Nextel | 1 | |
| Ford | 1 | Staples | 1 | |
| GNC | 2 | Starbucks | 2 | |
| GameStop | 1 | Subway | 2 | |
| H&R Block | 1 | T-Mobile | 2 | |
| Holiday Inn | 1 | Taco Bell | 1 | |
| IHOP | 1 | Target | 1 | |
| JCPenney | 1 | Toyota | 1 | |
| KFC | 1 | U-Haul | 2 | |
| Kohl's | 1 | UPS | 7 | |
| La-Z-Boy | 1 | Vons | 1 | |
| Lane Furniture | 1 | Walgreens | 1 | |
| Long John Silver's | 1 | Walmart | 1 | |
| Lowe's | 1 | Wendy's | 1 | |
| Martin's | 1 | |||
Culpeper County on our top lists:
- #71 on the list of "Top 101 counties with the lowest Particulate Matter (PM10) Annual air pollution readings in 2012 (µg/m3)"