Sussex County, Virginia (VA)
County owner-occupied free and clear houses and condos in 2010: 1,259
County owner-occupied houses and condos in 2000: 2,867
Renter-occupied apartments: 1,251 (it was 1,259 in 2000)
| % of renters here: | 31% |
| State: | 33% |
Land area: 491 sq. mi.
Water area: 2.1 sq. mi.
Population density: 22 people per square mile (low).
Industries providing employment: Educational, health and social services (19.9%), Retail trade (14.5%), Manufacturing (12.5%), Construction (10.7%).
Type of workers:
- Private wage or salary: 78%
- Government: 20%
- Self-employed, not incorporated: 2%
- Unpaid family work: 0%
- OSM Map
- General Map
- Google Map
- MSN Map

- 5,90854.6%Black Non-Hispanic Alone
- 4,28039.5%White Non-Hispanic Alone
- 3993.7%Hispanic or Latino
- 1821.7%Two or more races
- 510.5%Asian alone
- 20.02%American Indian and Alaska Native alone

| Median resident age: | 40.7 years |
| Virginia median age: | 39.0 years |
| Males: 6,364 | |
| Females: 4,576 |

 | Wash DC needs to annex Arlington and Alexandria back (95 replies) |
| Is VA really cheaper the MD for retirement? (11 replies) |
| Speeding ticket in Sussex, VA (2 replies) |
| Looking into Richmond area (7 replies) |
| Official Reckless Driving Thread (2249 replies) |
| 92 in a 70. Fine+Misdemeanor or fight in court? (22 replies) |
| Sussex County: | 2.0 people |
| Virginia: | 3 people |
Estimated median household income in 2022: $58,261 ($31,007 in 1999)
| This county: | $58,261 |
| Virginia: | $85,873 |
Median contract rent in 2022 for apartments: $706 (lower quartile is $430, upper quartile is $831)
| This county: | $706 |
| State: | $1270 |
Estimated median house or condo value in 2022: $162,509 (it was $67,900 in 2000)
| Sussex: | $162,509 |
| Virginia: | $365,700 |
Mean price in 2022:
Median monthly housing costs for homes and condos with a mortgage: $1,220Detached houses: $270,198
Here: $270,198 State: $472,865 Townhouses or other attached units: $391,210
Here: $391,210 State: $457,437 Mobile homes: $99,245
Here: $99,245 State: $100,736
Median monthly housing costs for units without a mortgage: $421
Institutionalized population: 2,549
Crime in 2021 (reported by the sheriff's office or county police, not the county total):
- Murders: 0
- Rapes: 2
- Robberies: 3
- Assaults: 10
- Burglaries: 18
- Thefts: 60
- Auto thefts: 9
Crime in 2020 (reported by the sheriff's office or county police, not the county total):
- Murders: 1
- Rapes: 4
- Robberies: 1
- Assaults: 12
- Burglaries: 21
- Thefts: 43
- Auto thefts: 12
Health of residents in Sussex County based on CDC Behavioral Risk Factor Surveillance System Survey Questionnaires from 2013 to 2021:
General health status score of residents in this county from 1 (poor) to 5 (excellent) is 3.5. This is about average.73.5% of residents exercised in the past month. This is about average.
42.1% of residents smoked 100+ cigarettes in their lives. This is about average.
54.8% of adult residents drank alcohol in the past 30 days. This is less than average.
74.3% of residents visited a dentist within the past year. This is about average.
Average weight of males is 200 pounds. This is more than average.
Average weight of females is 167 pounds. This is more than average.
Single-family new house construction building permits:
- 2022: 32 buildings, average cost: $193,400
- 2021: 33 buildings, average cost: $150,300
- 2020: 37 buildings, average cost: $129,500
- 2019: 40 buildings, average cost: $89,600
- 2018: 33 buildings, average cost: $118,300
- 2017: 33 buildings, average cost: $127,200
- 2016: 24 buildings, average cost: $155,000
- 2015: 18 buildings, average cost: $121,500
- 2014: 20 buildings, average cost: $106,200
- 2013: 29 buildings, average cost: $89,400
- 2012: 26 buildings, average cost: $117,500
- 2011: 15 buildings, average cost: $120,300
- 2010: 15 buildings, average cost: $136,000
- 2009: 27 buildings, average cost: $134,600
- 2008: 45 buildings, average cost: $116,900
- 2007: 90 buildings, average cost: $123,200
- 2006: 91 buildings, average cost: $128,300
- 2005: 35 buildings, average cost: $140,800
- 2004: 20 buildings, average cost: $159,200
- 2003: 9 buildings, average cost: $54,100
- 2002: 13 buildings, average cost: $113,500
- 2001: 14 buildings, average cost: $172,300
- 2000: 13 buildings, average cost: $84,600
- 1999: 11 buildings, average cost: $94,600
- 1998: 16 buildings, average cost: $102,900
- 1997: 12 buildings, average cost: $138,100


Median real estate property taxes paid for housing units with mortgages in 2022: $1,050 (0.5%)
Median real estate property taxes paid for housing units with no mortgage in 2022: $745 (0.6%)


| Sussex County: | 13.5% |
| Virginia: | 10.6% |
Median age of residents in 2022: 40.7 years old
(Males: 36.6 years old, Females: 47.1 years old)
(Median age for: White residents: 45.9 years old, Black residents: 37.1 years old, American Indian residents: 31.3 years old, Asian residents: 58.6 years old, Hispanic or Latino residents: 30.4 years old, Other race residents: 23.0 years old)
Area name: Richmond, VA HUD Metro FMR Area
Fair market rent in 2006 for a 1-bedroom apartment in Sussex County is $678 a month.
Fair market rent for a 2-bedroom apartment is $757 a month.
Fair market rent for a 3-bedroom apartment is $1010 a month.
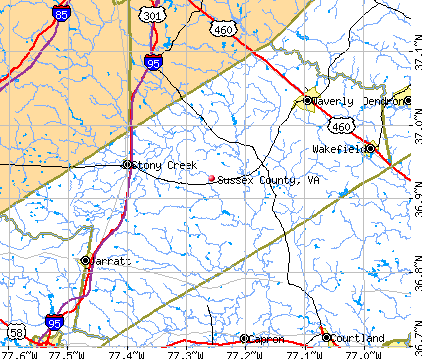
Cities in this county include: Waverly, Wakefield, Sussex, Stony Creek.
Neighboring counties: Archuleta County, Colorado  , Mecklenburg County
  , Leslie County, Kentucky , Monroe County, Kentucky , Texas County, Missouri , Suffolk city
  .
.
| Here: | 3.9% |
| Virginia: | 2.7% |


Current college students: 442
People 25 years of age or older with a high school degree or higher: 81.3%
People 25 years of age or older with a bachelor's degree or higher: 15.4%
Number of foreign born residents: 180 (41.8% naturalized citizens)
| Sussex County: | 1.7% |
| Whole state: | 12.7% |

- Year of entry for the foreign-born population
- 102010 or later
- 1132000 to 2009
- 141990 to 1999
- 311980 to 1989
- 01970 to 1979
- 25Before 1970
Mean travel time to work (commute): ! minutes
Percentage of county residents living and working in this county: 101.1%
Housing units in structures:
- One, detached: 3,453
- One, attached: 40
- Two: 120
- 3 or 4: 84
- 5 to 9: 82
- 10 to 19: 26
- 20 to 49: 12
- 50 or more: 13
- Mobile homes: 870
Housing units in Sussex County with a mortgage: 1,358 (117 second mortgage, 20 home equity loan, 91 both second mortgage and home equity loan)
Houses without a mortgage: 47
| Here: | 2.1% with mortgage |
| State: | 97.2% with mortgage |
Religion statistics for Sussex County
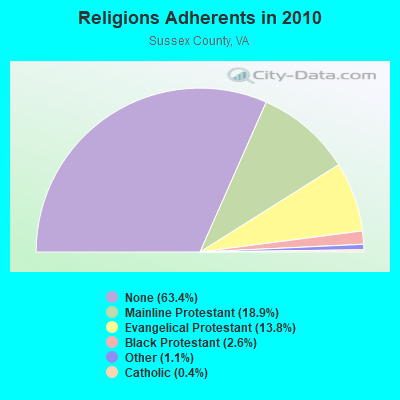
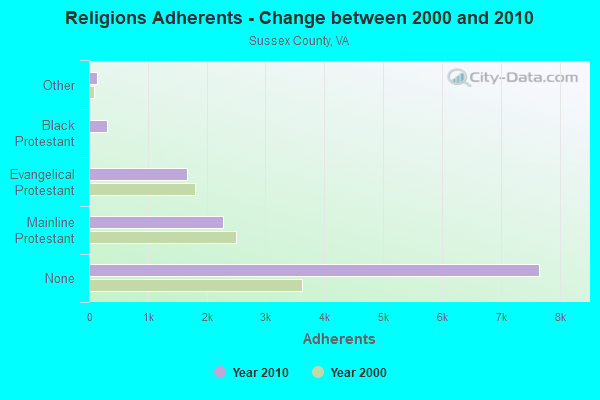
| Religion | Adherents | Congregations |
|---|---|---|
| Mainline Protestant | 2,279 | 12 |
| Evangelical Protestant | 1,668 | 11 |
| Black Protestant | 309 | 2 |
| Other | 128 | 2 |
| Catholic | 45 | 1 |
| None | 7,658 | - |
Source: Clifford Grammich, Kirk Hadaway, Richard Houseal, Dale E.Jones, Alexei Krindatch, Richie Stanley and Richard H.Taylor. 2012. 2010 U.S.Religion Census: Religious Congregations & Membership Study. Association of Statisticians of American Religious Bodies. Jones, Dale E., et al. 2002. Congregations and Membership in the United States 2000. Nashville, TN: Glenmary Research Center.
Food Environment Statistics:
| Sussex County: | 5.78 / 10,000 pop. |
| State: | 2.03 / 10,000 pop. |
| This county: | 3.30 / 10,000 pop. |
| Virginia: | 1.43 / 10,000 pop. |
| Sussex County: | 9.08 / 10,000 pop. |
| Virginia: | 4.03 / 10,000 pop. |
| This county: | 4.95 / 10,000 pop. |
| State: | 7.65 / 10,000 pop. |
| Sussex County: | 11.6% |
| Virginia: | 9.3% |
| Sussex County: | 31.9% |
| State: | 26.7% |
| Here: | 14.8% |
| State: | 18.6% |
Agriculture in Sussex County:
Average size of farms: 571 acresAverage value of agricultural products sold per farm: $192,878
Average total farm production expenses per farm: $189,577
Harvested cropland as a percentage of land in farms: 47.27%
Irrigated harvested cropland as a percentage of land in farms: 4.02%
Average market value of all machinery and equipment per farm: $97,757
The percentage of farms operated by a family or individual: 93.08%
Average age of principal farm operators: 56 years
Average number of cattle and calves per 100 acres of all land in farms: 2.85
Corn for grain: 4515 harvested acres
All wheat for grain: 3564 harvested acres
Upland cotton: 5522 harvested acres
Soybeans for beans: 16195 harvested acres
Vegetables: 12 harvested acres
Earthquake activity:
Sussex County-area historical earthquake activity is significantly above Virginia state average. It is 56% smaller than the overall U.S. average.On 8/23/2011 at 17:51:04, a magnitude 5.8 (5.8 MW, Depth: 3.7 mi, Class: Moderate, Intensity: VI - VII) earthquake occurred 77.5 miles away from Sussex County center
On 12/9/2003 at 20:59:14, a magnitude 4.5 (4.5 MB, 4.5 LG, Class: Light, Intensity: IV - V) earthquake occurred 57.8 miles away from the county center
On 12/9/2003 at 20:59:18, a magnitude 4.5 (4.5 ML, Depth: 6.2 mi) earthquake occurred 74.7 miles away from the county center
On 8/25/2011 at 05:07:52, a magnitude 4.5 (4.5 ML, Depth: 4.2 mi) earthquake occurred 80.6 miles away from the county center
On 8/9/2020 at 12:07:37, a magnitude 5.1 (5.1 MW, Depth: 4.7 mi) earthquake occurred 214.9 miles away from Sussex County center
On 8/24/2011 at 00:04:36, a magnitude 4.2 (4.2 ML) earthquake occurred 78.3 miles away from the county center
Magnitude types: regional Lg-wave magnitude (LG), body-wave magnitude (MB), local magnitude (ML), moment magnitude (MW)
Most recent natural disasters:
- Virginia Covid-19 Pandemic, Incident Period: January 20, 2020, Major Disaster (Presidential) Declared DR-4512-VA: April 2, 2020, FEMA Id: 4512, Natural disaster type: Other
- Virginia Hurricane Sandy, Incident Period: October 26, 2012 to November 01, 2012, Emergency Declared EM-3359: October 29, 2012, FEMA Id: 3359, Natural disaster type: Hurricane
- Virginia Hurricane Irene, Incident Period: August 26, 2011 to September 04, 2011, Emergency Declared EM-3329: August 26, 2011, FEMA Id: 3329, Natural disaster type: Hurricane
- Virginia Hurricane Irene, Incident Period: August 26, 2011 to August 28, 2011, Major Disaster (Presidential) Declared DR-4024: September 03, 2011, FEMA Id: 4024, Natural disaster type: Hurricane
- Virginia Severe Storms and Flooding, Including Severe Storms and Flooding Associated with Tropical Depression Ernesto, Incident Period: August 29, 2006 to September 07, 2006, Major Disaster (Presidential) Declared DR-1661: September 22, 2006, FEMA Id: 1661, Natural disaster type: Storm, Flood, Tropical Depression
- Virginia Hurricane Katrina Evacuation, Incident Period: August 29, 2005 to October 01, 2005, Emergency Declared EM-3240: September 12, 2005, FEMA Id: 3240, Natural disaster type: Hurricane
- Virginia Hurricane Isabel, Incident Period: September 18, 2003 to October 01, 2003, Major Disaster (Presidential) Declared DR-1491: September 18, 2003, FEMA Id: 1491, Natural disaster type: Hurricane
- Virginia Winter Storm, Incident Period: January 25, 2000 to January 30, 2000, Major Disaster (Presidential) Declared DR-1318: February 28, 2000, FEMA Id: 1318, Natural disaster type: Winter Storm
- Virginia Hurricane Floyd, Incident Period: September 13, 1999 to September 26, 1999, Major Disaster (Presidential) Declared DR-1293: September 18, 1999, FEMA Id: 1293, Natural disaster type: Hurricane
- Virginia Hurricane Floyd, Incident Period: September 13, 1999 to September 26, 1999, Emergency Declared EM-3147: September 16, 1999, FEMA Id: 3147, Natural disaster type: Hurricane
- 5 other natural disasters have been reported since 1953.
The number of natural disasters in Sussex County (15) is near the US average (15).
Major Disasters (Presidential) Declared: 9
Emergencies Declared: 6
Causes of natural disasters: Hurricanes: 7, Floods: 3, Storms: 3, Winter Storms: 2, Blizzard: 1, Drought: 1, Ice Storm: 1, Tropical Depression: 1, Other: 1 (Note: some incidents may be assigned to more than one category).

Means of transportation to work:
- Drove a car alone: 2,806 (75.1%)
- Carpooled: 401 (10.7%)
- Long-distance train or commuter rail: 6 (0.2%)
- Taxicab, motorcycle, or other means: 103 (2.8%)
- Bicycle: 6 (0.2%)
- Walked: 77 (2.1%)
- Worked at home: 249 (6.7%)


- Health care and social assistance (13%)
- Retail trade (8%)
- Accommodation and food services (7%)
- Public administration (6%)
- Educational services (5%)
- Manufacturing (5%)
- Finance and insurance (4%)

- Health care and social assistance (21%)
- Retail trade (14%)
- Accommodation and food services (11%)
- Public administration (9%)
- Educational services (9%)
- Manufacturing (7%)
- Finance and insurance (6%)

- Construction and extraction occupations (13%)
- Production occupations (12%)
- Material moving occupations (12%)
- Management occupations (10%)
- Transportation occupations (9%)
- Healthcare support occupations (8%)
- Installation, maintenance, and repair occupations (5%)

- Office and administrative support occupations (20%)
- Sales and related occupations (9%)
- Business and financial operations occupations (8%)
- Management occupations (8%)
- Health diagnosing and treating practitioners and other technical occupations (7%)
- Educational instruction, and library occupations (7%)
- Food preparation and serving related occupations (6%)

- Mexico (51%)
- Vietnam (13%)
- India (8%)
- Congo (5%)
- Philippines (4%)
- El Salvador (3%)
- Serbia (2%)

- African (35%)
- American (10%)
- English (9%)
- Irish (2%)
- German (2%)
- European (1%)
- Scottish (1%)


People in group quarters in Sussex County, Virginia in 2010:
- 2,356 people in state prisons
- 106 people in nursing facilities/skilled-nursing facilities
- 87 people in local jails and other municipal confinement facilities
- 44 people in group homes intended for adults
People in group quarters in Sussex County, Virginia in 2000:
- 2,379 people in federal prisons and detention centers
- 118 people in nursing homes
- 27 people in local jails and other confinement facilities (including police lockups)
- 19 people in homes for the mentally retarded
10.46% of this county's 2021 resident taxpayers lived in other counties in 2020 ($30,460 average adjusted gross income)
| Here: | 10.46% |
| Virginia average: | 10.16% |
10 or fewer of this county's residents moved from foreign countries.
9.05% relocated from other counties in Virginia ($27,070 average AGI)
1.41% relocated from other states ($3,390 average AGI)
Sussex County: 1.41% Virginia average: 3.91%

Top counties from which taxpayers relocated into this county between 2020 and 2021:
| from Prince George County, VA | |
| from Petersburg city, VA | |
| from Chesterfield County, VA |
8.34% of this county's 2020 resident taxpayers moved to other counties in 2021 ($40,290 average adjusted gross income)
| Here: | 8.34% |
| Virginia average: | 10.20% |
10 or fewer of this county's residents moved to foreign countries.
7.39% relocated to other counties in Virginia ($35,900 average AGI)
0.95% relocated to other states ($4,390 average AGI)
Sussex County: 0.95% Virginia average: 3.98%

Top counties to which taxpayers relocated from this county between 2020 and 2021:
| to Petersburg city, VA | |
| to Chesterfield County, VA | |
| to Prince George County, VA | |
| to Greensville County, VA |
Births per 1000 population from 1990 to 1999: 12.9
Births per 1000 population from 2000 to 2006: 9.8

Deaths per 1000 population from 1990 to 1999: 13.4
Deaths per 1000 population from 2000 to 2009: 11.3
Deaths per 1000 population from 2010 to 2020: 12.0

Infant deaths per 1000 live births from 1990 to 1999: 10.8
Infant deaths per 1000 live births from 2000 to 2006: 10.6

Persons under 19 years old without health insurance coverage in 2018: 7.1%


Persons enrolled in hospital insurance and/or supplemental medical insurance (Medicare) in July 1, 2007: 2,113 (1,644 aged, 469 disabled)
Children under 18 without health insurance coverage in 2007: 197 (9%)


Most common underlying causes of death in Sussex County, Virginia in 1999 - 2019:
- Bronchus or lung, unspecified - Malignant neoplasms (131)
- Acute myocardial infarction, unspecified (67)
- Stroke, not specified as haemorrhage or infarction (22)
- Atherosclerotic heart disease (21)
- Chronic obstructive pulmonary disease, unspecified (12)
- Unspecified dementia (10)
Population without health insurance coverage in 2000: 15%
Children under 18 without health insurance coverage in 2000: 11%
Medical specialist MDs per 100,000 population in 2005: 953
Dentists per 100,000 population in 1998: 8
Total births per 100,000 population, July 2005 - July 2006 : 10
Total deaths per 100,000 population, July 2005 - July 2006: 50
Limited-service eating places per 100,000 population in 2005 : 17
Crimes per 100,000 population in 1996: 1
Household type by relationship:
Households: 10,940- Male householders: 1,711 (547 living alone), Female householders: 2,091 (804 living alone)
1,422 spouses (1,422 opposite-sex spouses), 273 unmarried partners, (273 opposite-sex unmarried partners), 2,757 children (2,654 natural, 15 adopted, 92 stepchildren), 394 grandchildren, 373 brothers or sisters, 47 parents, 0 foster children, 146 other relatives, 197 non-relatives
- In group quarters: 1,502
Size of family households: 1,306 2-persons, 439 3-persons, 277 4-persons, 208 5-persons, 60 6-persons, 17 7-or-more-persons.
Size of nonfamily households: 1,351 1-person, 135 2-persons, 6 5-persons.
608 married couples with children.
811 single-parent households (249 men, 562 women).
97.3% of residents of Sussex speak English at home.
2.0% of residents speak Spanish at home (83% speak English very well, 6% speak English well, 11% speak English not well).
0.2% of residents speak other Indo-European language at home (48% speak English very well, 52% speak English well).
0.1% of residents speak Asian or Pacific Island language at home (88% speak English very well, 12% speak English well).
In fiscal year 2004:
Federal Government expenditure: $77,556,000 ($6,510 per capita)
Department of Defense expenditure: $1,802,000
Federal direct payments to individuals for retirement and disability: $33,122,000
Federal other direct payments to individuals: $19,782,000
Federal direct payments not to individuals: $4,012,000
Federal grants: $16,261,000
Federal procurement contracts: $523,000 ($0,000 Department of Defense)
Federal salaries and wages: $3,857,000 ($0,000 Department of Defense)
Federal Government direct loans: $693,000
Federal guaranteed/insured loans: $4,658,000
Federal Government insurance: $12,011,000
Population change from April 1, 2000 to July 1, 2005:
Births: 646| Here: | 54 per 1000 residents |
| State: | 70 per 1000 residents |
Deaths: 743
| Here: | 62 per 1000 residents |
| State: | 40 per 1000 residents |
Net international migration: +50
| Here: | +4 per 1000 residents |
| State: | +18 per 1000 residents |
Net internal migration: -371
| Here: | |
| State: |

Total withdrawal of fresh water for public supply: 0.51 millions of gallons per day (all from ground)
| Here: | 6.3 |
| State: | 7.0 |
| Here: | 5.0 |
| State: | 4.3 |

- Year house built in Sussex County, Virginia
- 432020 or later
- 3852010 to 2019
- 6122000 to 2009
- 6751990 to 1999
- 5221980 to 1989
- 9781970 to 1979
- 2711960 to 1969
- 4421950 to 1959
- 2741940 to 1949
- 4521939 or earlier

- Rooms in owner-occupied houses in Sussex County, Virginia
- 01 room
- 02 rooms
- 163 rooms
- 3124 rooms
- 5205 rooms
- 6056 rooms
- 4897 rooms
- 3018 rooms
- 4189+ rooms

- Rooms in renter-occupied apartments in Sussex County, Virginia
- 31 room
- 82 rooms
- 543 rooms
- 2544 rooms
- 3875 rooms
- 1056 rooms
- 1367 rooms
- 1058 rooms
- 699+ rooms

- Bedrooms in owner-occupied houses in Sussex County, Virginia
- 0no bedroom
- 111 bedroom
- 3452 bedrooms
- 1,7863 bedrooms
- 4504 bedrooms
- 615+ bedrooms

- Bedrooms in renter-occupied apartments in Sussex County, Virginia
- 3no bedroom
- 571 bedroom
- 3692 bedrooms
- 5143 bedrooms
- 1644 bedrooms
- 215+ bedrooms

- Cars and other vehicles available in Sussex County in owner-occupied houses/condos
- 141no vehicle
- 7141 vehicle
- 9222 vehicles
- 4463 vehicles
- 2164 vehicles
- 2335+ vehicles

- Cars and other vehicles available in Sussex County in renter-occupied apartments
- 256no vehicle
- 5201 vehicle
- 2932 vehicles
- 723 vehicles
- 44 vehicles
- 05+ vehicles
86.8% of Sussex County residents lived in the same house 1 years ago.
Out of people who lived in different houses, 16% lived in this county.
Out of people who lived in different counties, 90% lived in Virginia.
| Sussex County: | 86.8% |
| State average: | 86.6% |
Place of birth for U.S.-born residents:
- This state: 8,336
- Other state: 2,315
- Northeast: 614
- Midwest: 213
- South: 1,256
- West: 230


- 69.4%Electricity
- 12.2%Bottled, tank, or LP gas
- 8.8%Fuel oil, kerosene, etc.
- 4.1%Wood
- 3.4%Utility gas
- 1.2%No fuel used
- 0.9%Other fuel

- 80.1%Electricity
- 8.4%Fuel oil, kerosene, etc.
- 4.8%Bottled, tank, or LP gas
- 4.4%Wood
- 1.9%Utility gas
- 0.4%No fuel used
Private vs. public school enrollment:
| Here: | 21.4% |
| Virginia: | 13.2% |
| Here: | 11.1% |
| Virginia: | 10.2% |
| Here: | 1.7% |
| Virginia: | 18.7% |


Sussex County government finances - Expenditure in 2017:
- Assistance and Subsidies - Public Welfare, Federal Categorical Assistance Programs: $178,000
Public Welfare, Cash Assistance Programs - Other: $61,000
- Bond Funds - Cash and Securities: $19,475,000
- Charges - Solid Waste Management: $5,798,000
Elementary and Secondary Education School Lunch: $316,000
Other: $291,000
Elementary and Secondary Education School Tuition and Transportation: $15,000
Elementary and Secondary Education - Other: $1,000
- Construction - Elementary and Secondary Education: $3,690,000
- Current Operations - Elementary and Secondary Education: $21,360,000
Police Protection: $2,503,000
Correctional Institutions: $1,849,000
Public Welfare - Other: $1,503,000
Public Welfare, Vendor Payments for Medical Care: $1,424,000
Judicial and Legal Services: $1,367,000
Local Fire Protection: $1,025,000
Central Staff Services: $823,000
General Public Buildings: $759,000
Housing and Community Development: $740,000
Financial Administration: $708,000
Health - Other: $246,000
Protective Inspection and Regulation - Other: $232,000
Solid Waste Management: $232,000
General - Other: $229,000
Public Welfare, Vendor Payments for Other Purposes: $191,000
Libraries: $188,000
Parks and Recreation: $37,000
- Federal Intergovernmental - Education: $443,000
Other: $115,000
- General - Interest on Debt: $577,000
- Intergovernmental to Local - Other - Elementary and Secondary Education: $363,000
Other - Other Higher Education: $2,000
- Local Intergovernmental - Education: $216,000
- Long Term Debt - Beginning Outstanding - Unspecified Public Purpose: $21,471,000
Outstanding Unspecified Public Purpose: $20,390,000
Retired Unspecified Public Purpose: $1,081,000
- Miscellaneous - Fines and Forfeits: $734,000
General Revenue - Other: $632,000
Interest Earnings: $190,000
Rents: $56,000
Donations From Private Sources: $31,000
- Other Capital Outlay - General - Other: $1,104,000
Elementary and Secondary Education: $424,000
- Other Funds - Cash and Securities: $3,711,000
- State Intergovernmental - Education: $13,205,000
Other: $5,918,000
Public Welfare: $2,145,000
General Local Government Support: $1,607,000
Housing and Community Development: $740,000
- Tax - Property: $10,208,000
General Sales and Gross Receipts: $787,000
Motor Vehicle License: $276,000
Public Utilities Sales: $157,000
Other License: $157,000
Other Selective Sales: $51,000
Occupation and Business License - Other: $27,000
Documentary and Stock Transfer: $2,000
- Total Salaries and Wages: $11,958,000
Sussex County government finances - Revenue in 2017:
- Assistance and Subsidies - Public Welfare, Federal Categorical Assistance Programs: $178,000
Public Welfare, Cash Assistance Programs - Other: $61,000
- Bond Funds - Cash and Securities: $19,475,000
- Charges - Solid Waste Management: $5,798,000
Elementary and Secondary Education School Lunch: $316,000
Other: $291,000
Elementary and Secondary Education School Tuition and Transportation: $15,000
Elementary and Secondary Education - Other: $1,000
- Construction - Elementary and Secondary Education: $3,690,000
- Current Operations - Elementary and Secondary Education: $21,360,000
Police Protection: $2,503,000
Correctional Institutions: $1,849,000
Public Welfare - Other: $1,503,000
Public Welfare, Vendor Payments for Medical Care: $1,424,000
Judicial and Legal Services: $1,367,000
Local Fire Protection: $1,025,000
Central Staff Services: $823,000
General Public Buildings: $759,000
Housing and Community Development: $740,000
Financial Administration: $708,000
Health - Other: $246,000
Protective Inspection and Regulation - Other: $232,000
Solid Waste Management: $232,000
General - Other: $229,000
Public Welfare, Vendor Payments for Other Purposes: $191,000
Libraries: $188,000
Parks and Recreation: $37,000
- Federal Intergovernmental - Education: $443,000
Other: $115,000
- General - Interest on Debt: $577,000
- Intergovernmental to Local - Other - Elementary and Secondary Education: $363,000
Other - Other Higher Education: $2,000
- Local Intergovernmental - Education: $216,000
- Long Term Debt - Beginning Outstanding - Unspecified Public Purpose: $21,471,000
Outstanding Unspecified Public Purpose: $20,390,000
Retired Unspecified Public Purpose: $1,081,000
- Miscellaneous - Fines and Forfeits: $734,000
General Revenue - Other: $632,000
Interest Earnings: $190,000
Rents: $56,000
Donations From Private Sources: $31,000
- Other Capital Outlay - General - Other: $1,104,000
Elementary and Secondary Education: $424,000
- Other Funds - Cash and Securities: $3,711,000
- State Intergovernmental - Education: $13,205,000
Other: $5,918,000
Public Welfare: $2,145,000
General Local Government Support: $1,607,000
Housing and Community Development: $740,000
- Tax - Property: $10,208,000
General Sales and Gross Receipts: $787,000
Motor Vehicle License: $276,000
Public Utilities Sales: $157,000
Other License: $157,000
Other Selective Sales: $51,000
Occupation and Business License - Other: $27,000
Documentary and Stock Transfer: $2,000
- Total Salaries and Wages: $11,958,000
Sussex County government finances - Debt in 2017:
- Assistance and Subsidies - Public Welfare, Federal Categorical Assistance Programs: $178,000
Public Welfare, Cash Assistance Programs - Other: $61,000
- Bond Funds - Cash and Securities: $19,475,000
- Charges - Solid Waste Management: $5,798,000
Elementary and Secondary Education School Lunch: $316,000
Other: $291,000
Elementary and Secondary Education School Tuition and Transportation: $15,000
Elementary and Secondary Education - Other: $1,000
- Construction - Elementary and Secondary Education: $3,690,000
- Current Operations - Elementary and Secondary Education: $21,360,000
Police Protection: $2,503,000
Correctional Institutions: $1,849,000
Public Welfare - Other: $1,503,000
Public Welfare, Vendor Payments for Medical Care: $1,424,000
Judicial and Legal Services: $1,367,000
Local Fire Protection: $1,025,000
Central Staff Services: $823,000
General Public Buildings: $759,000
Housing and Community Development: $740,000
Financial Administration: $708,000
Health - Other: $246,000
Protective Inspection and Regulation - Other: $232,000
Solid Waste Management: $232,000
General - Other: $229,000
Public Welfare, Vendor Payments for Other Purposes: $191,000
Libraries: $188,000
Parks and Recreation: $37,000
- Federal Intergovernmental - Education: $443,000
Other: $115,000
- General - Interest on Debt: $577,000
- Intergovernmental to Local - Other - Elementary and Secondary Education: $363,000
Other - Other Higher Education: $2,000
- Local Intergovernmental - Education: $216,000
- Long Term Debt - Beginning Outstanding - Unspecified Public Purpose: $21,471,000
Outstanding Unspecified Public Purpose: $20,390,000
Retired Unspecified Public Purpose: $1,081,000
- Miscellaneous - Fines and Forfeits: $734,000
General Revenue - Other: $632,000
Interest Earnings: $190,000
Rents: $56,000
Donations From Private Sources: $31,000
- Other Capital Outlay - General - Other: $1,104,000
Elementary and Secondary Education: $424,000
- Other Funds - Cash and Securities: $3,711,000
- State Intergovernmental - Education: $13,205,000
Other: $5,918,000
Public Welfare: $2,145,000
General Local Government Support: $1,607,000
Housing and Community Development: $740,000
- Tax - Property: $10,208,000
General Sales and Gross Receipts: $787,000
Motor Vehicle License: $276,000
Public Utilities Sales: $157,000
Other License: $157,000
Other Selective Sales: $51,000
Occupation and Business License - Other: $27,000
Documentary and Stock Transfer: $2,000
- Total Salaries and Wages: $11,958,000
Sussex County government finances - Cash and Securities in 2017:
- Assistance and Subsidies - Public Welfare, Federal Categorical Assistance Programs: $178,000
Public Welfare, Cash Assistance Programs - Other: $61,000
- Bond Funds - Cash and Securities: $19,475,000
- Charges - Solid Waste Management: $5,798,000
Elementary and Secondary Education School Lunch: $316,000
Other: $291,000
Elementary and Secondary Education School Tuition and Transportation: $15,000
Elementary and Secondary Education - Other: $1,000
- Construction - Elementary and Secondary Education: $3,690,000
- Current Operations - Elementary and Secondary Education: $21,360,000
Police Protection: $2,503,000
Correctional Institutions: $1,849,000
Public Welfare - Other: $1,503,000
Public Welfare, Vendor Payments for Medical Care: $1,424,000
Judicial and Legal Services: $1,367,000
Local Fire Protection: $1,025,000
Central Staff Services: $823,000
General Public Buildings: $759,000
Housing and Community Development: $740,000
Financial Administration: $708,000
Health - Other: $246,000
Protective Inspection and Regulation - Other: $232,000
Solid Waste Management: $232,000
General - Other: $229,000
Public Welfare, Vendor Payments for Other Purposes: $191,000
Libraries: $188,000
Parks and Recreation: $37,000
- Federal Intergovernmental - Education: $443,000
Other: $115,000
- General - Interest on Debt: $577,000
- Intergovernmental to Local - Other - Elementary and Secondary Education: $363,000
Other - Other Higher Education: $2,000
- Local Intergovernmental - Education: $216,000
- Long Term Debt - Beginning Outstanding - Unspecified Public Purpose: $21,471,000
Outstanding Unspecified Public Purpose: $20,390,000
Retired Unspecified Public Purpose: $1,081,000
- Miscellaneous - Fines and Forfeits: $734,000
General Revenue - Other: $632,000
Interest Earnings: $190,000
Rents: $56,000
Donations From Private Sources: $31,000
- Other Capital Outlay - General - Other: $1,104,000
Elementary and Secondary Education: $424,000
- Other Funds - Cash and Securities: $3,711,000
- State Intergovernmental - Education: $13,205,000
Other: $5,918,000
Public Welfare: $2,145,000
General Local Government Support: $1,607,000
Housing and Community Development: $740,000
- Tax - Property: $10,208,000
General Sales and Gross Receipts: $787,000
Motor Vehicle License: $276,000
Public Utilities Sales: $157,000
Other License: $157,000
Other Selective Sales: $51,000
Occupation and Business License - Other: $27,000
Documentary and Stock Transfer: $2,000
- Total Salaries and Wages: $11,958,000
Supplemental Security Income (SSI) in 2006:
- Total number of recipients: 455
- Number of aged recipients: 59
- Number of blind and disabled recipients: 396
- Number of recipients under 18: 85
- Number of recipients between 18 and 64: 257
- Number of recipients older than 64: 113
- Number of recipients also receiving OASDI: 192
- Amount of payments (thousands of dollars): 184
| Most common first names in Sussex County, VA among deceased individuals | ||
| Name | Count | Lived (average) |
|---|---|---|
| James | 145 | 69.8 years |
| Mary | 118 | 78.6 years |
| John | 111 | 71.4 years |
| William | 91 | 71.6 years |
| Robert | 86 | 71.4 years |
| Annie | 56 | 77.6 years |
| Willie | 56 | 74.6 years |
| George | 56 | 71.0 years |
| Joseph | 54 | 71.0 years |
| Charles | 35 | 72.7 years |
| Most common last names in Sussex County, VA among deceased individuals | ||
| Last name | Count | Lived (average) |
|---|---|---|
| Jones | 109 | 71.8 years |
| Brown | 60 | 71.5 years |
| Parham | 57 | 71.4 years |
| Smith | 50 | 74.7 years |
| Taylor | 49 | 69.5 years |
| Parker | 44 | 74.9 years |
| Williams | 44 | 73.2 years |
| Bailey | 41 | 76.7 years |
| Johnson | 39 | 70.1 years |
| Ellis | 38 | 67.5 years |
| Businesses in Sussex County, VA | ||||
| Name | Count | Name | Count | |
|---|---|---|---|---|
| 7-Eleven | 2 | MasterBrand Cabinets | 1 | |
| Burger King | 1 | McDonald's | 1 | |
| Circle K | 1 | Sleep Inn | 1 | |
| Dennys | 1 | Starbucks | 1 | |
| FedEx | 1 | Subway | 1 | |
| Hilton | 1 | |||