Crime rate in Ocala, Florida (FL): murders, rapes, robberies, assaults, burglaries, thefts, auto thefts, arson, law enforcement employees, police officers, crime map
Crime rate in Ocala, FL
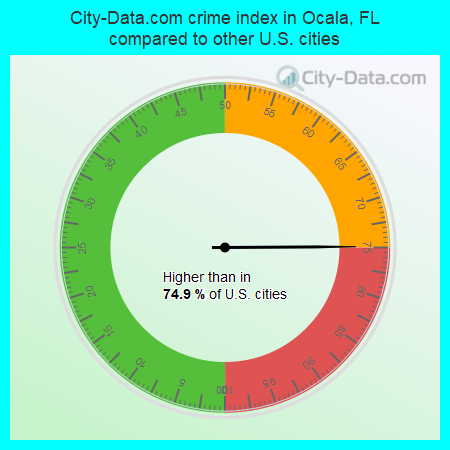
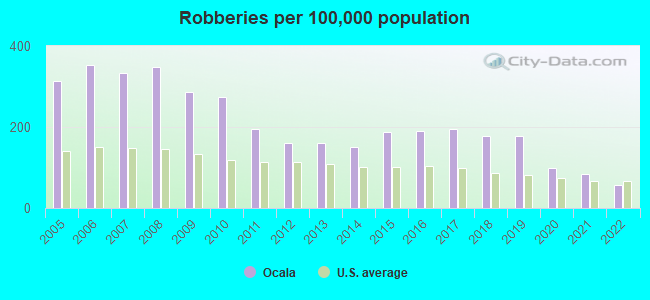
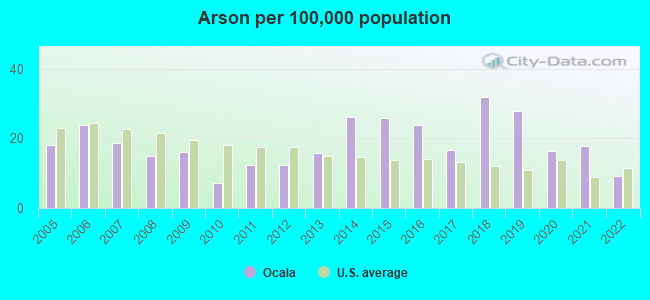
The 2022 crime rate in Ocala, FL is 197 (City-Data.com crime index), which is 1.2 times lower than the U.S. average. It was higher than in 74.9% U.S. cities. The 2022 Ocala crime rate fell by 44% compared to 2021. The number of homicides stood at 2 - a decrease of 3 compared to 2021. In the last 5 years Ocala has seen decline of violent crime and decreasing property crime.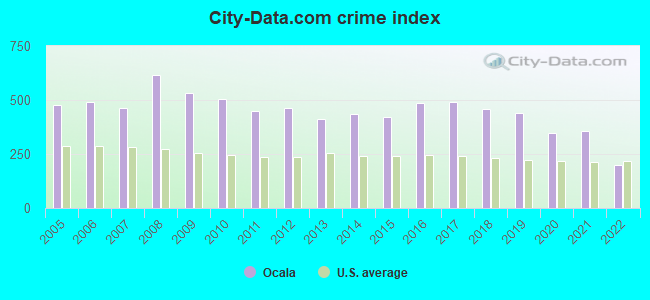
The City-Data.com crime index weighs serious crimes and violent crimes more heavily. Higher means more crime, U.S. average is 246.1. It adjusts for the number of visitors and daily workers commuting into cities.
- means the value is smaller than the state average.- means the value is about the same as the state average.
- means the value is bigger than the state average.
- means the value is much bigger than the state average.
According to our research of Florida and other state lists, there were 468 registered sex offenders living in Ocala, Florida as of June 02, 2024.
The ratio of all residents to sex offenders in Ocala is 127 to 1.
Violent crime rate in 2022
| Ocala: | 200.5 |
| U.S. Average: | 219.8 |
Violent crime rate in 2021
| Ocala: | 409.1 |
| U.S. Average: | 224.8 |
Violent crime rate in 2020
| Ocala: | 389.2 |
| U.S. Average: | 228.2 |
Violent crime rate in 2019
| Ocala: | 464.5 |
| U.S. Average: | 219.9 |
Violent crime rate in 2018
| Ocala: | 406.7 |
| U.S. Average: | 221.2 |
Violent crime rate in 2017
| Ocala: | 447.0 |
| U.S. Average: | 226.2 |
Violent crime rate in 2016
| Ocala: | 445.4 |
| U.S. Average: | 227.3 |
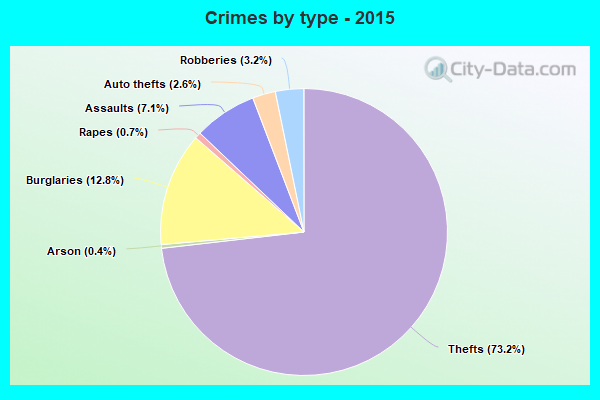
Violent crime rate in 2015
| Ocala: | 355.0 |
| U.S. Average: | 219.3 |
Violent crime rate in 2014
| Ocala: | 359.4 |
| U.S. Average: | 211.1 |
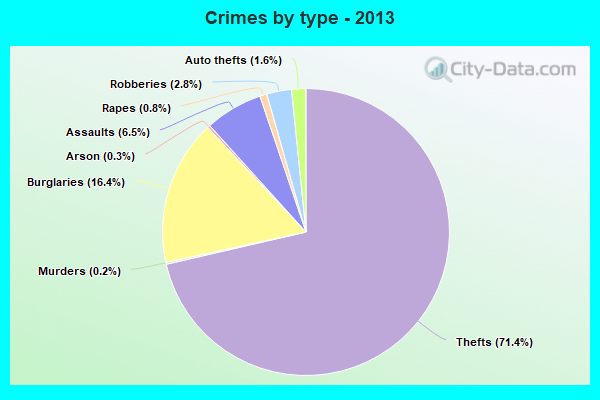
Violent crime rate in 2013
| Ocala: | 328.1 |
| U.S. Average: | 214.2 |
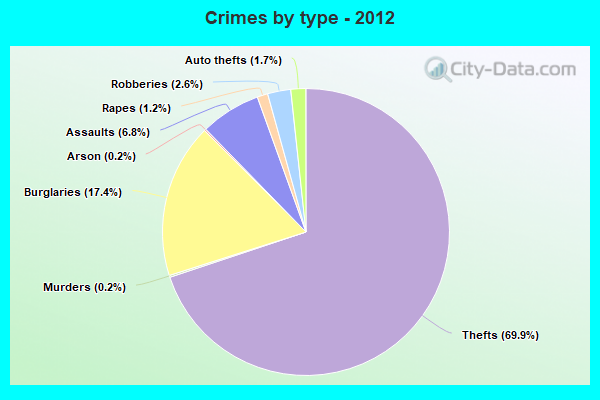
Violent crime rate in 2012
| Ocala: | 379.7 |
| U.S. Average: | 187.4 |
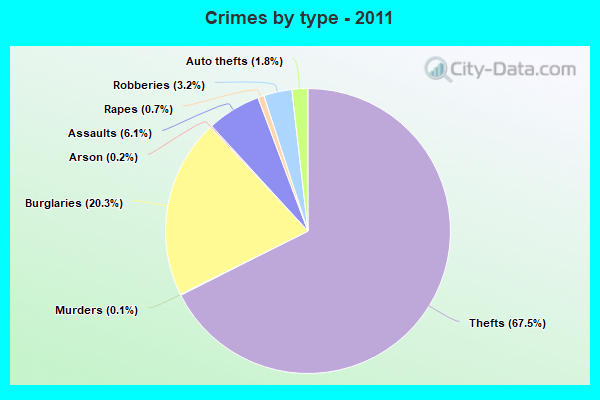
Violent crime rate in 2011
| Ocala: | 349.5 |
| U.S. Average: | 187.1 |
Violent crime rate in 2010
| Ocala: | 447.5 |
| U.S. Average: | 195.7 |
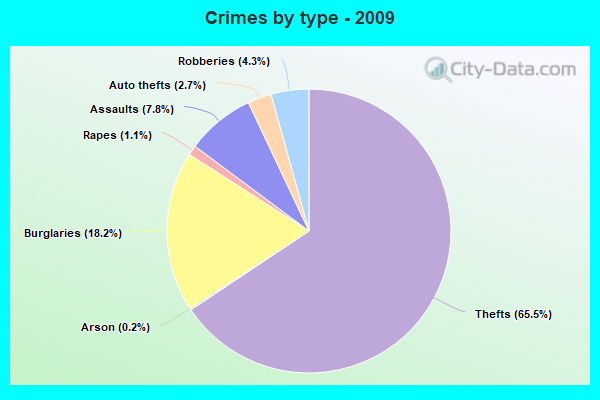
Violent crime rate in 2009
| Ocala: | 487.9 |
| U.S. Average: | 208.9 |
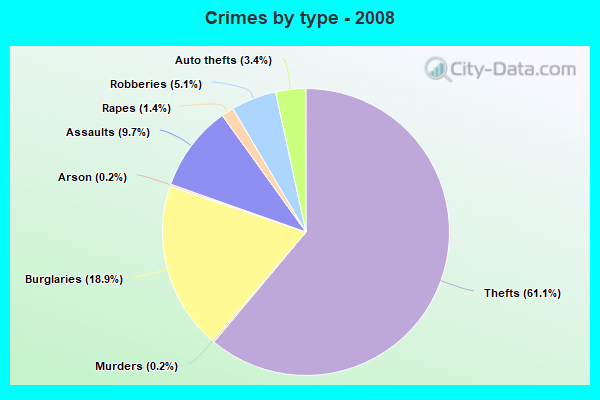
Violent crime rate in 2008
| Ocala: | 626.4 |
| U.S. Average: | 222.5 |
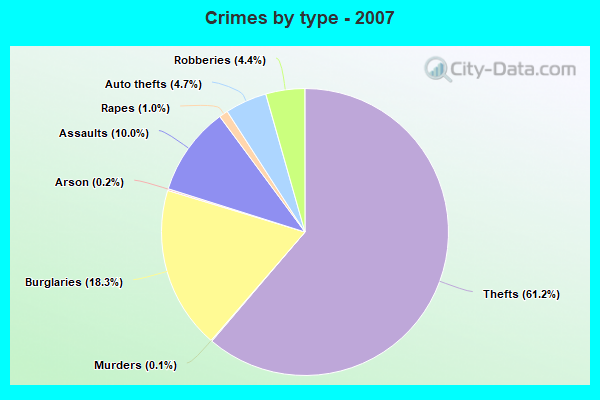
Violent crime rate in 2007
| Ocala: | 459.0 |
| U.S. Average: | 229.1 |
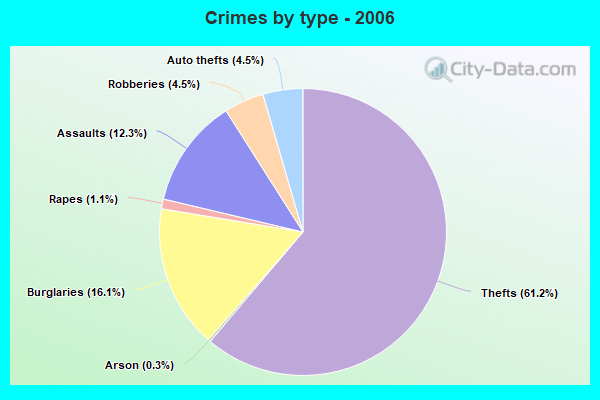
Violent crime rate in 2006
| Ocala: | 540.9 |
| U.S. Average: | 232.6 |
Violent crime rate in 2005
| Ocala: | 456.2 |
| U.S. Average: | 227.0 |
Property crime rate in 2022
| Ocala: | 137.1 |
| U.S. Average: | 166.5 |
Property crime rate in 2021
| Ocala: | 225.2 |
| U.S. Average: | 157.8 |
Property crime rate in 2020
| Ocala: | 215.7 |
| U.S. Average: | 169.6 |
Property crime rate in 2019
| Ocala: | 298.2 |
| U.S. Average: | 179.7 |
Property crime rate in 2018
| Ocala: | 373.7 |
| U.S. Average: | 190.2 |
Property crime rate in 2017
| Ocala: | 412.2 |
| U.S. Average: | 206.4 |
Property crime rate in 2016
| Ocala: | 406.6 |
| U.S. Average: | 216.6 |
Property crime rate in 2015
| Ocala: | 390.9 |
| U.S. Average: | 221.5 |
Property crime rate in 2014
| Ocala: | 400.5 |
| U.S. Average: | 230.8 |
Property crime rate in 2013
| Ocala: | 401.2 |
| U.S. Average: | 250.4 |
Property crime rate in 2012
| Ocala: | 439.4 |
| U.S. Average: | 267.3 |
Property crime rate in 2011
| Ocala: | 475.0 |
| U.S. Average: | 273.5 |
Property crime rate in 2010
| Ocala: | 486.6 |
| U.S. Average: | 276.4 |
Property crime rate in 2009
| Ocala: | 487.9 |
| U.S. Average: | 285.6 |
Property crime rate in 2008
| Ocala: | 499.0 |
| U.S. Average: | 302.2 |
Property crime rate in 2007
| Ocala: | 403.4 |
| U.S. Average: | 309.2 |
Property crime rate in 2006
| Ocala: | 392.4 |
| U.S. Average: | 317.3 |
Property crime rate in 2005
| Ocala: | 443.1 |
| U.S. Average: | 322.3 |

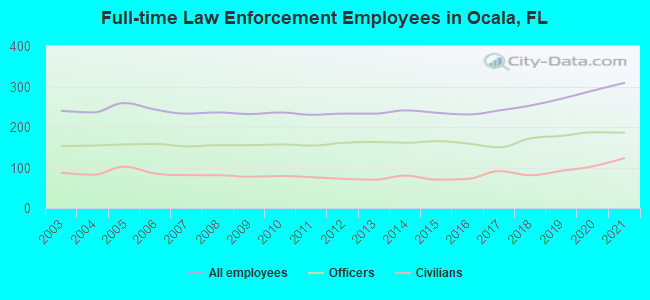
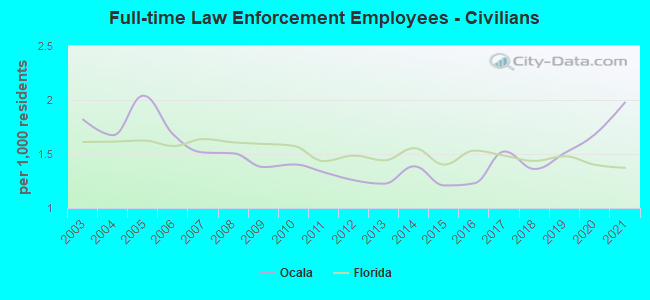
Full-time law enforcement employees in 2021, including police officers: 309 (186 officers - 152 male; 34 female).
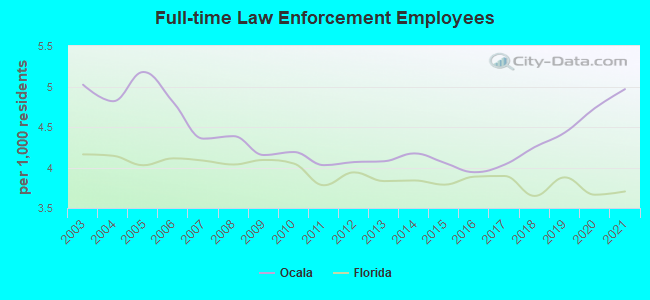
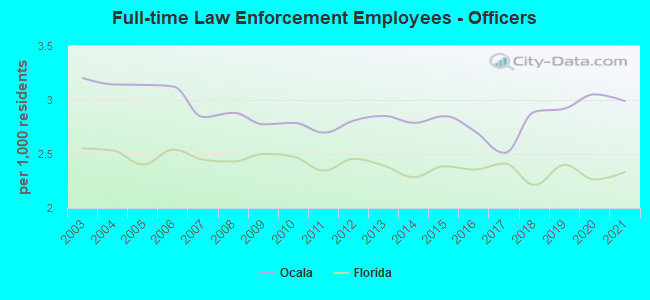
| Officers per 1,000 residents here: | 2.99 |
| Florida average: | 2.33 |
Full-time law enforcement employees in 2020, including police officers: 290 (187 officers - 146 male; 41 female).
| Officers per 1,000 residents here: | 3.05 |
| Florida average: | 2.26 |
Full-time law enforcement employees in 2019, including police officers: 270 (178 officers - 141 male; 37 female).
| Officers per 1,000 residents here: | 2.92 |
| Florida average: | 2.40 |
Full-time law enforcement employees in 2018, including police officers: 253 (172 officers - 137 male; 35 female).
| Officers per 1,000 residents here: | 2.89 |
| Florida average: | 2.21 |
Full-time law enforcement employees in 2017, including police officers: 241 (150 officers - 119 male; 31 female).
| Officers per 1,000 residents here: | 2.51 |
| Florida average: | 2.41 |
Full-time law enforcement employees in 2016, including police officers: 231 (159 officers - 126 male; 33 female).
| Officers per 1,000 residents here: | 2.71 |
| Florida average: | 2.36 |
Full-time law enforcement employees in 2015, including police officers: 235 (165 officers - 133 male; 32 female).
| Officers per 1,000 residents here: | 2.85 |
| Florida average: | 2.39 |
Full-time law enforcement employees in 2014, including police officers: 241 (161 officers - 132 male; 29 female).
| Officers per 1,000 residents here: | 2.79 |
| Florida average: | 2.29 |
Full-time law enforcement employees in 2013, including police officers: 233 (163 officers - 134 male; 29 female).
| Officers per 1,000 residents here: | 2.85 |
| Florida average: | 2.39 |
Full-time law enforcement employees in 2012, including police officers: 233 (161 officers - 134 male; 27 female).
| Officers per 1,000 residents here: | 2.81 |
| Florida average: | 2.45 |
Full-time law enforcement employees in 2011, including police officers: 230 (154 officers - 128 male; 26 female).
| Officers per 1,000 residents here: | 2.70 |
| Florida average: | 2.35 |
Full-time law enforcement employees in 2010, including police officers: 236 (157 officers - 131 male; 26 female).
| Officers per 1,000 residents here: | 2.79 |
| Florida average: | 2.47 |
Full-time law enforcement employees in 2009, including police officers: 232 (155 officers - 132 male; 23 female).
| Officers per 1,000 residents here: | 2.78 |
| Florida average: | 2.50 |
Full-time law enforcement employees in 2008, including police officers: 236 (155 officers - 131 male; 24 female).
| Officers per 1,000 residents here: | 2.88 |
| Florida average: | 2.43 |
Full-time law enforcement employees in 2007, including police officers: 233 (152 officers - 127 male; 25 female).
| Officers per 1,000 residents here: | 2.84 |
| Florida average: | 2.45 |
Full-time law enforcement employees in 2006, including police officers: 243 (158 officers - 135 male; 23 female).
| Officers per 1,000 residents here: | 3.12 |
| Florida average: | 2.54 |
Full-time law enforcement employees in 2005, including police officers: 259 (157 officers - 132 male; 25 female).
| Officers per 1,000 residents here: | 3.14 |
| Florida average: | 2.40 |
Full-time law enforcement employees in 2004, including police officers: 236 (154 officers - 130 male; 24 female).
| Officers per 1,000 residents here: | 3.14 |
| Florida average: | 2.53 |
Full-time law enforcement employees in 2003, including police officers: 240 (153 officers - 129 male; 24 female).
| Officers per 1,000 residents here: | 3.20 |
| Florida average: | 2.55 |


Zip codes: 34470, 34471, 34474, 34475, 34479, 34480, 34481, 34482.