Crime rate in Sanford, Florida (FL): murders, rapes, robberies, assaults, burglaries, thefts, auto thefts, arson, law enforcement employees, police officers, crime map
Crime rate in Sanford, FL
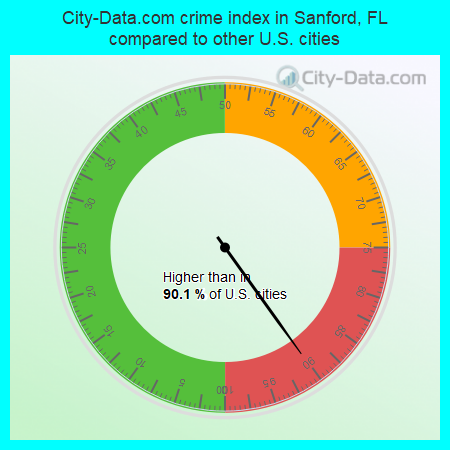
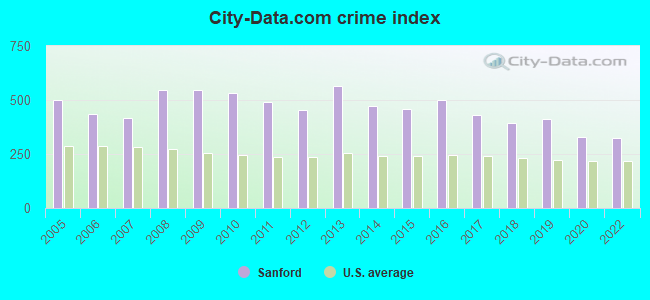
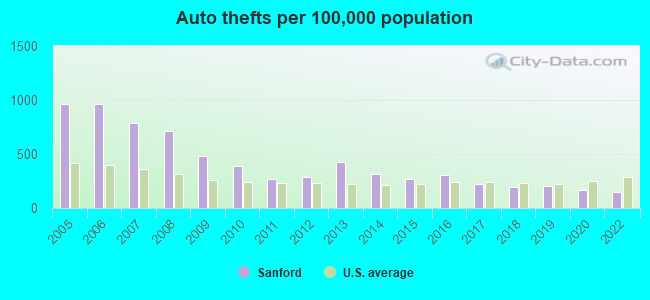
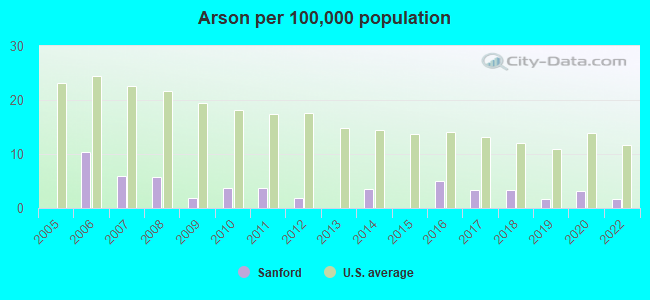
The 2022 crime rate in Sanford, FL is 325 (City-Data.com crime index), which is 1.3 times greater than the U.S. average. It was higher than in 90.1% U.S. cities. The 2022 Sanford crime rate fell by 1% compared to 2020. The number of homicides stood at 6 - an increase of 3 compared to 2020. In the last 5 years Sanford has seen decline of violent crime and decreasing property crime.See how dangerous Sanford, FL is compared to the nearest cities:
(Note: Higher means more crime)
(Note: Higher means more crime)
| Sanford: | 325.2 |
| Lake Mary: | 92.7 |
| Winter Springs: | 90.8 |
| Longwood: | 216.1 |
| Casselberry: | 227.4 |
| Orange City: | 188.5 |
| Oviedo: | 66.0 |
| Altamonte Springs: | 227.9 |
| Maitland: | 136.0 |
The City-Data.com crime index weighs serious crimes and violent crimes more heavily. Higher means more crime, U.S. average is 246.1. It adjusts for the number of visitors and daily workers commuting into cities.
- means the value is smaller than the state average.- means the value is about the same as the state average.
- means the value is bigger than the state average.
- means the value is much bigger than the state average.
According to our research of Florida and other state lists, there were 124 registered sex offenders living in Sanford, Florida as of June 11, 2024.
The ratio of all residents to sex offenders in Sanford is 473 to 1.
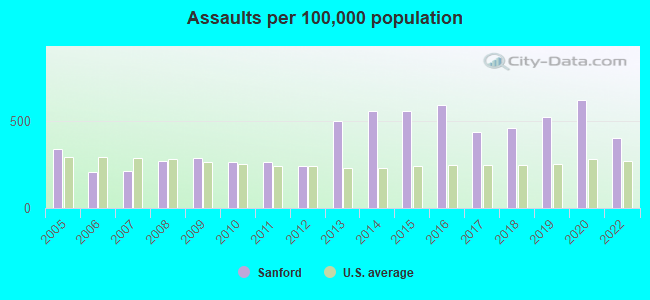
Violent crime rate in 2022
| Sanford: | 339.1 |
| U.S. Average: | 219.8 |
Violent crime rate in 2020
| Sanford: | 447.5 |
| U.S. Average: | 228.2 |
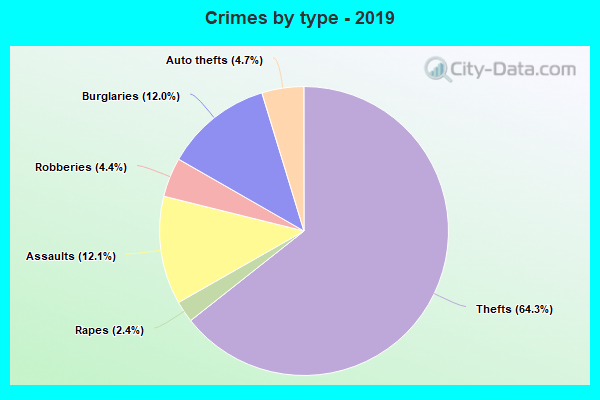
Violent crime rate in 2019
| Sanford: | 464.3 |
| U.S. Average: | 219.9 |
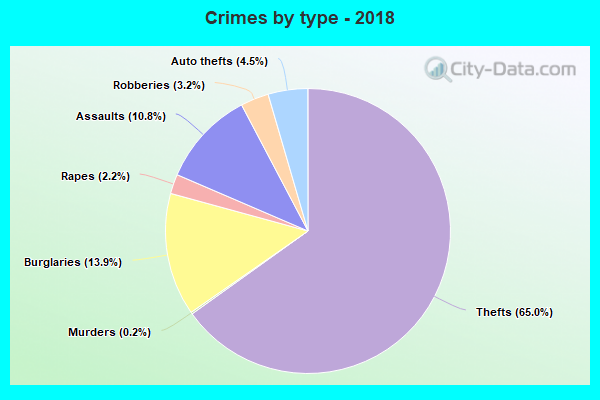
Violent crime rate in 2018
| Sanford: | 409.8 |
| U.S. Average: | 221.2 |
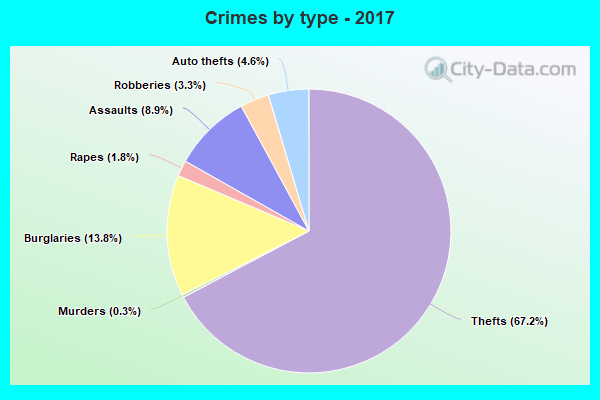
Violent crime rate in 2017
| Sanford: | 416.3 |
| U.S. Average: | 226.2 |
Violent crime rate in 2016
| Sanford: | 515.0 |
| U.S. Average: | 227.3 |
Violent crime rate in 2015
| Sanford: | 456.3 |
| U.S. Average: | 219.3 |
Violent crime rate in 2014
| Sanford: | 432.9 |
| U.S. Average: | 211.1 |
Violent crime rate in 2013
| Sanford: | 453.0 |
| U.S. Average: | 214.2 |
Violent crime rate in 2012
| Sanford: | 322.9 |
| U.S. Average: | 187.4 |
Violent crime rate in 2011
| Sanford: | 335.2 |
| U.S. Average: | 187.1 |
Violent crime rate in 2010
| Sanford: | 376.1 |
| U.S. Average: | 195.7 |
Violent crime rate in 2009
| Sanford: | 395.3 |
| U.S. Average: | 208.9 |
Violent crime rate in 2008
| Sanford: | 389.6 |
| U.S. Average: | 222.5 |
Violent crime rate in 2007
| Sanford: | 277.0 |
| U.S. Average: | 229.1 |
Violent crime rate in 2006
| Sanford: | 225.7 |
| U.S. Average: | 232.6 |
Violent crime rate in 2005
| Sanford: | 311.1 |
| U.S. Average: | 227.0 |
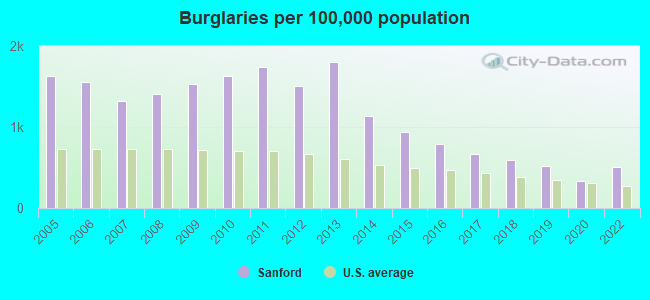
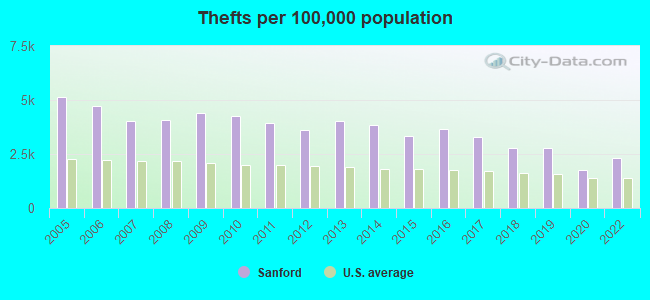
Property crime rate in 2022
| Sanford: | 239.8 |
| U.S. Average: | 166.5 |
Property crime rate in 2020
| Sanford: | 178.9 |
| U.S. Average: | 169.6 |
Property crime rate in 2019
| Sanford: | 272.7 |
| U.S. Average: | 179.7 |
Property crime rate in 2018
| Sanford: | 285.4 |
| U.S. Average: | 190.2 |
Property crime rate in 2017
| Sanford: | 331.2 |
| U.S. Average: | 206.4 |
Property crime rate in 2016
| Sanford: | 387.3 |
| U.S. Average: | 216.6 |
Property crime rate in 2015
| Sanford: | 394.8 |
| U.S. Average: | 221.5 |
Property crime rate in 2014
| Sanford: | 464.7 |
| U.S. Average: | 230.8 |
Property crime rate in 2013
| Sanford: | 626.3 |
| U.S. Average: | 250.4 |
Property crime rate in 2012
| Sanford: | 525.2 |
| U.S. Average: | 267.3 |
Property crime rate in 2011
| Sanford: | 585.7 |
| U.S. Average: | 273.5 |
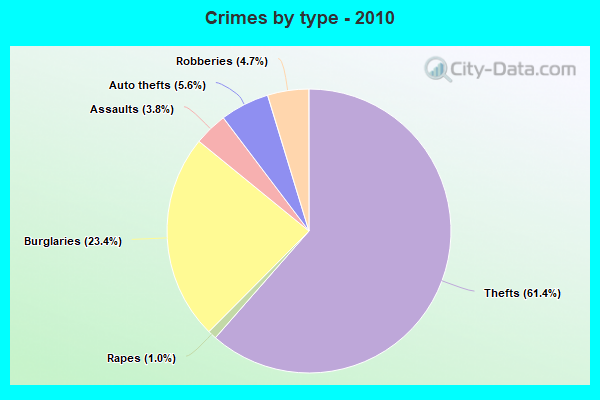
Property crime rate in 2010
| Sanford: | 597.3 |
| U.S. Average: | 276.4 |
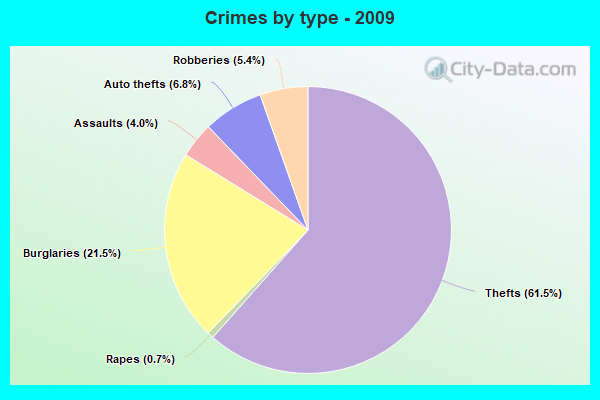
Property crime rate in 2009
| Sanford: | 597.9 |
| U.S. Average: | 285.6 |
Property crime rate in 2008
| Sanford: | 592.8 |
| U.S. Average: | 302.2 |
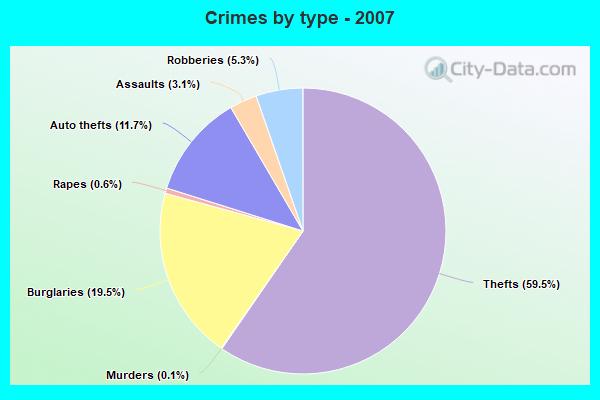
Property crime rate in 2007
| Sanford: | 473.0 |
| U.S. Average: | 309.2 |
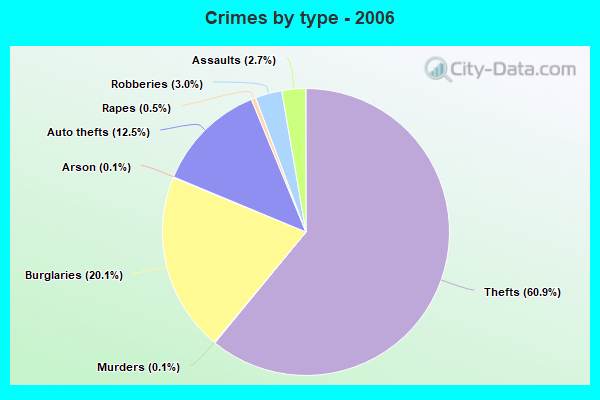
Property crime rate in 2006
| Sanford: | 561.9 |
| U.S. Average: | 317.3 |
Property crime rate in 2005
| Sanford: | 592.2 |
| U.S. Average: | 322.3 |

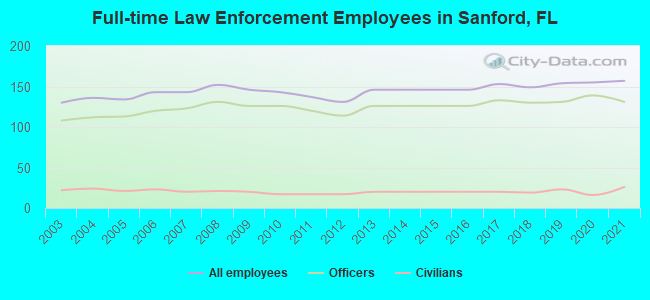
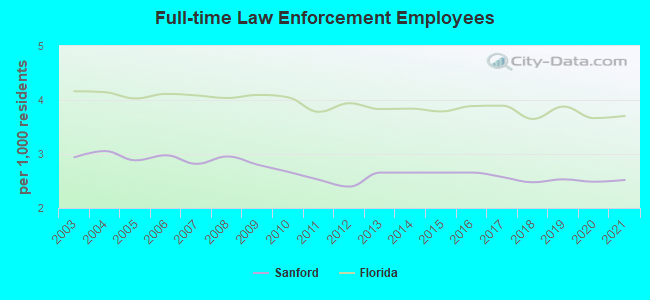
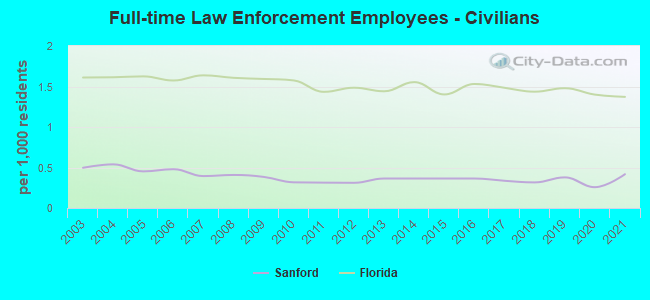
Full-time law enforcement employees in 2021, including police officers: 157 (131 officers - 106 male; 25 female).
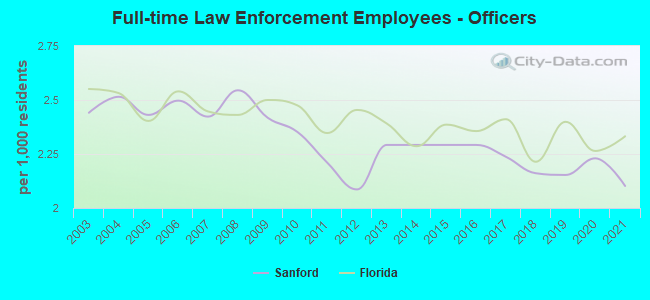
| Officers per 1,000 residents here: | 2.10 |
| Florida average: | 2.33 |
Full-time law enforcement employees in 2020, including police officers: 155 (139 officers - 112 male; 27 female).
| Officers per 1,000 residents here: | 2.23 |
| Florida average: | 2.26 |
Full-time law enforcement employees in 2019, including police officers: 154 (131 officers - 109 male; 22 female).
| Officers per 1,000 residents here: | 2.15 |
| Florida average: | 2.40 |
Full-time law enforcement employees in 2018, including police officers: 149 (130 officers - 108 male; 22 female).
| Officers per 1,000 residents here: | 2.16 |
| Florida average: | 2.21 |
Full-time law enforcement employees in 2017, including police officers: 153 (133 officers - 108 male; 25 female).
| Officers per 1,000 residents here: | 2.24 |
| Florida average: | 2.41 |
Full-time law enforcement employees in 2013, including police officers: 146 (126 officers - 109 male; 17 female).
| Officers per 1,000 residents here: | 2.29 |
| Florida average: | 2.39 |
Full-time law enforcement employees in 2012, including police officers: 131 (114 officers - 97 male; 17 female).
| Officers per 1,000 residents here: | 2.09 |
| Florida average: | 2.45 |
Full-time law enforcement employees in 2011, including police officers: 137 (120 officers - 103 male; 17 female).
| Officers per 1,000 residents here: | 2.21 |
| Florida average: | 2.35 |
Full-time law enforcement employees in 2010, including police officers: 143 (126 officers - 109 male; 17 female).
| Officers per 1,000 residents here: | 2.35 |
| Florida average: | 2.47 |
Full-time law enforcement employees in 2009, including police officers: 146 (126 officers - 108 male; 18 female).
| Officers per 1,000 residents here: | 2.42 |
| Florida average: | 2.50 |
Full-time law enforcement employees in 2008, including police officers: 152 (131 officers - 113 male; 18 female).
| Officers per 1,000 residents here: | 2.55 |
| Florida average: | 2.43 |
Full-time law enforcement employees in 2007, including police officers: 143 (123 officers - 108 male; 15 female).
| Officers per 1,000 residents here: | 2.42 |
| Florida average: | 2.45 |
Full-time law enforcement employees in 2006, including police officers: 143 (120 officers - 103 male; 17 female).
| Officers per 1,000 residents here: | 2.50 |
| Florida average: | 2.54 |
Full-time law enforcement employees in 2005, including police officers: 134 (113 officers - 96 male; 17 female).
| Officers per 1,000 residents here: | 2.43 |
| Florida average: | 2.40 |
Full-time law enforcement employees in 2004, including police officers: 136 (112 officers - 95 male; 17 female).
| Officers per 1,000 residents here: | 2.52 |
| Florida average: | 2.53 |
Full-time law enforcement employees in 2003, including police officers: 130 (108 officers - 94 male; 14 female).
| Officers per 1,000 residents here: | 2.44 |
| Florida average: | 2.55 |


Zip codes: 32773.