Baxter: Fire Incidents, Minnesota (MN)
Where are fire incidents reported in Baxter, MN
Something went wrong! Please refresh the page.
|
| |||||||||||||||||||||||||||||||||||||||||||||||||||||||||||||||||||||||||||||||||||||||||||||||||||||||||||||
2002 - 2018 National Fire Incident Reporting System (NFIRS) incidents
- Incident types reported to NFIRS in Baxter, MN
- 14124.0%Fire
- 13623.2%False Alarm
- 13422.8%Good Intent Call
- 10317.5%Hazardous Condition
- 528.9%Rescue & EMS
- 203.4%Service Call
- 10.2%Severe Weather
- Fire incident types reported to NFIRS in Baxter, MN
- 6546.1%Outside Fires
- 4330.5%Structure Fires
- 3323.4%Mobile Property/Vehicle Fires
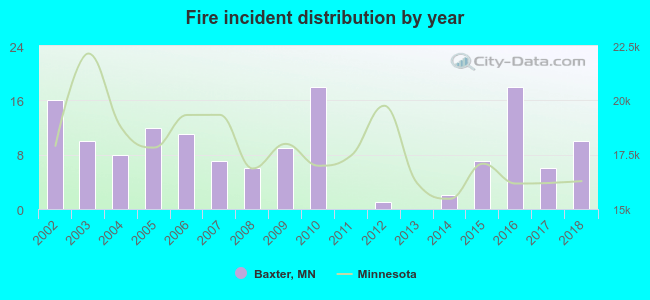 According to the data from the years 2002 - 2018 the average number of fires per year is 8. The highest number of reported fire incidents - 18 took place in 2010, and the least - 0 in 2011. The data has a dropping trend.
The average number of yearly fire incidents per 10k residents in Baxter, MN compared to nearest cities:
(Note: Based on data for the last 3 years, including only cities with population 5,000 and above)
| Baxter: | 14.5 |
| Brainerd: | 62.1 |
| Little Falls: | 74.4 |
| Sartell: | 5.2 |

 Based on the reports from the years 2002 - 2018 the average number of fire-related casualties per year is 0. The highest number of injuries - 4 took place in 2016, and the lowest - 0 in 2003. The data has a constant trend.
 25.5% incidents where reported in the morning and 74.5% in the evening. The most fires (19.1%) took place on Tuesday, and the least (9.9%) on Sunday.
 According to the 141 fires from years 2002 - 2018 most fires (15.6%) took place during May, and the least (1.4%) in September.
 Out of all 587 cases reported during the years 2002 - 2018, the most belonged to the categories: Fire (24.0%), Good Intent Call (23.2%), and Service Call (22.8%).
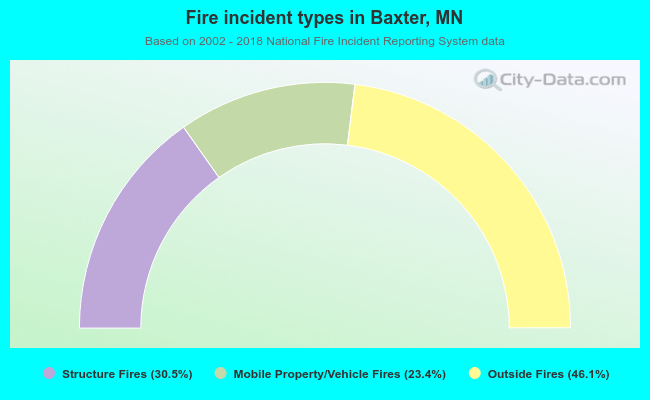 When looking into fire subcategories, the most reports belonged to: Outside Fires (46.1%), and Structure Fires (30.5%).