Canby: Fire Incidents, Oregon (OR)
Where are fire incidents reported in Canby, OR
Something went wrong! Please refresh the page.
| Fire incidents reported | |
|---|---|
| Sreet name | Count |
| 1ST AVE | 138 |
| 3RD AVE | 74 |
| BARLOW RD | 72 |
| LOCUST ST | 68 |
| 2ND AVE | 64 |
| 4TH AVE | 64 |
| TOWNSHIP RD | 58 |
| IVY ST | 56 |
| ELM ST | 52 |
| 10TH AVE | 50 |
| KNIGHTS BRIDGE RD | 42 |
| PINE ST | 42 |
| 13TH AVE | 38 |
| 99E HWY | 38 |
| MAPLE ST | 38 |
| NEW ERA RD | 38 |
| DRYLAND RD | 32 |
| MULINO RD | 32 |
| REDWOOD ST | 32 |
| TERRITORIAL RD | 32 |
| 5TH AVE | 30 |
| CENTRAL POINT RD | 30 |
| MACKSBURG RD | 30 |
| HEINZ RD | 28 |
| ARNDT RD | 26 |
| BARNARDS RD | 26 |
| ELISHA RD | 24 |
| GRIBBLE RD | 24 |
| HOLLY ST | 24 |
| LONE ELDER RD | 24 |
2002 - 2018 National Fire Incident Reporting System (NFIRS) incidents
- Incident types reported to NFIRS in Canby, OR
- 6,48762.0%Rescue & EMS
- 1,20011.5%Fire
- 1,08510.4%Service Call
- 9148.7%Good Intent Call
- 4264.1%Hazardous Condition
- 3363.2%False Alarm
- Fire incident types reported to NFIRS in Canby, OR
- 61150.9%Structure Fires
- 38832.3%Outside Fires
- 14311.9%Mobile Property/Vehicle Fires
- 584.8%Other
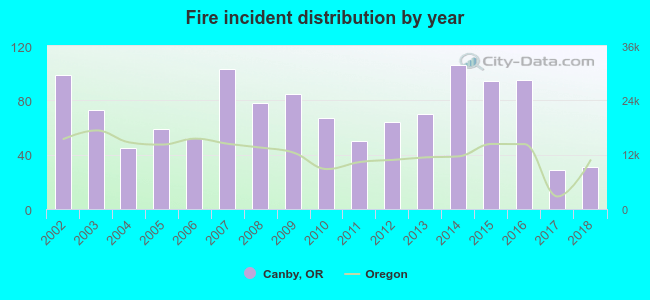 According to the data from the years 2002 - 2018 the average number of fire incidents per year is 71. The highest number of reported fires - 106 took place in 2014, and the least - 29 in 2017. The data has a decreasing trend.
The average number of yearly fire incidents per 10k residents in Canby, OR compared to nearest cities:
(Note: Based on data for the last 3 years, including only cities with population 5,000 and above)
| Canby: | 30.4 |
| Wilsonville: | 9.7 |
| Oregon City: | 20.3 |
| West Linn: | 8.0 |
| Beaver Creek: | 6.4 |
| Mulino: | 17.3 |
| Tualatin: | 14.5 |
| Gladstone: | 27.8 |
| Molalla: | 52.6 |
 The median response time based on all reported fire incidents is 7 minutes. This is about the same as the Oregon median value.
The median response time in Canby, OR compared to nearest cities:
(Note: Based on data for all years, including only cities with at least 500 fire incidents)
| Canby: | 7 minutes |
| Aurora: | 11 minutes |
| Wilsonville: | 6 minutes |
| Oregon City: | 6 minutes |
| West Linn: | 7 minutes |
| Tualatin: | 6 minutes |
| Gladstone: | 5 minutes |
| Molalla: | 8 minutes |
| Sherwood: | 7 minutes |
 Based on the data from the years 2002 - 2018 the average number of fire-related yearly casualties is 1. The highest number of reported injuries - 2 took place in 2007, and the lowest - 0 in 2002. The data has a constant trend.
The average number of casualties per 1,000 fires is 10. This indicator was the highest - 29 in 2013, and the lowest 0 in 2002. The trend for casualties per 1,000 fire incidents is constant. Compared to the state value the number of injuries per 1,000 fires is similar.
Based on the data from the years 2002 - 2018 the average number of fire-related yearly casualties is 1. The highest number of reported injuries - 2 took place in 2007, and the lowest - 0 in 2002. The data has a constant trend.
The average number of casualties per 1,000 fires is 10. This indicator was the highest - 29 in 2013, and the lowest 0 in 2002. The trend for casualties per 1,000 fire incidents is constant. Compared to the state value the number of injuries per 1,000 fires is similar.Casualties per 1,000 incidents in Canby, OR compared to nearest cities:
(Note: Based on data for all years, including only cities with at least 500 fire incidents)
| Canby: | 10.8 |
| Aurora: | 5.0 |
| Wilsonville: | 11.0 |
| Oregon City: | 9.7 |
| West Linn: | 4.0 |
| Tualatin: | 10.8 |
| Gladstone: | 5.0 |
| Molalla: | 8.5 |
| Sherwood: | 8.6 |
 29.8% incidents where reported in the morning and 70.2% in the evening. The most fires (15.5%) took place on Thursday, and the least (13.2%) on Monday.
 Based on the 1,200 fires from years 2002 - 2018 most fires (13.2%) took place during July, and the least (6.3%) in November.
 Out of all 10,469 cases reported during the years 2002 - 2018, the most belonged to the categories: Rescue & EMS (62.0%), Fire (11.5%), and Service Call (10.4%).
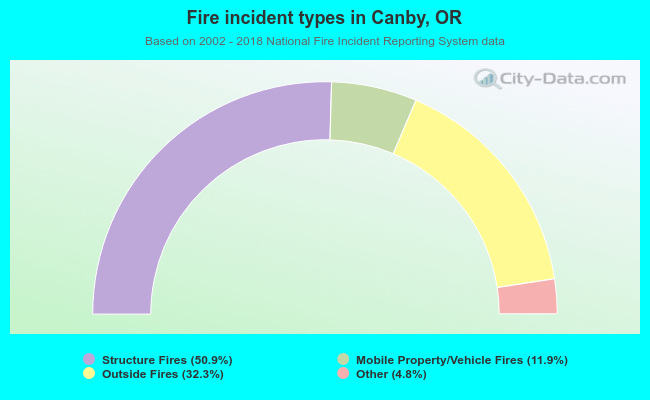 When looking into fire subcategories, the most reports belonged to: Structure Fires (50.9%), and Outside Fires (32.3%).