Coos Bay: Fire Incidents, Oregon (OR)
Where are fire incidents reported in Coos Bay, OR
Something went wrong! Please refresh the page.
| Fire incidents reported | |
|---|---|
| Sreet name | Count |
| NEWMARK AVE | 72 |
| OCEAN BLVD | 34 |
| 2ND ST | 32 |
| EMPIRE BLVD | 28 |
| 4TH ST | 24 |
| 8TH ST | 22 |
| BROADWAY | 22 |
| 10TH ST | 20 |
| CAMMANN ST | 18 |
| WALL ST | 18 |
| 7TH ST | 16 |
| BAYSHORE DR | 16 |
| BROADWAY ST | 16 |
| NEWMARK | 16 |
| SOUTHWEST BLVD | 16 |
| WASSON ST | 16 |
| CAMMANN | 14 |
| HWY 101 | 14 |
| JOHNSON AVE | 14 |
| 5TH ST | 12 |
| BAYSHORE | 12 |
| CENTRAL AVE | 12 |
| FRONT ST | 12 |
| LAKESHORE DR | 12 |
| NORMAN AVE | 12 |
| 19TH ST | 10 |
| 1ST ST | 10 |
| 9TH ST | 10 |
| ANDERSON AVE | 10 |
| CAPE ARAGO HWY | 10 |
| Other | 374 |
2002 - 2018 National Fire Incident Reporting System (NFIRS) incidents
- Incident types reported to NFIRS in Coos Bay, OR
- 5,47562.4%Rescue & EMS
- 98611.2%Good Intent Call
- 93610.7%Service Call
- 92410.5%Fire
- 2452.8%Hazardous Condition
- 2042.3%False Alarm
- Fire incident types reported to NFIRS in Coos Bay, OR
- 39943.2%Structure Fires
- 32435.1%Outside Fires
- 15416.7%Mobile Property/Vehicle Fires
- 475.1%Other
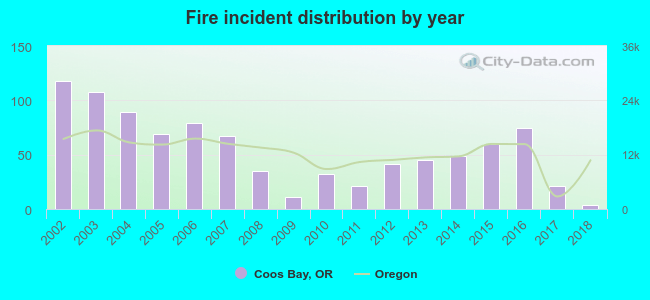 According to the data from the years 2002 - 2018 the average number of fires per year is 54. The highest number of reported fire incidents - 118 took place in 2002, and the least - 4 in 2018. The data has a dropping trend.
The average number of yearly fire incidents per 10k residents in Coos Bay, OR compared to nearest cities:
(Note: Based on data for the last 3 years, including only cities with population 5,000 and above)
| Coos Bay: | 20.8 |
| North Bend: | 23.1 |
| Tenmile: | 2.1 |
| Florence: | 22.7 |
| Winston: | 29.3 |
| Roseburg: | 41.5 |
| Roseburg North: | 16.9 |
| Sutherlin: | 33.9 |
| Cottage Grove: | 26.7 |
 The median response time based on all reported fire incidents is 5 minutes. This is lower compared to the state median value.
The median response time in Coos Bay, OR compared to nearest cities:
(Note: Based on data for all years, including only cities with at least 500 fire incidents)
| Coos Bay: | 5 minutes |
| North Bend: | 3 minutes |
| Florence: | 6 minutes |
| Roseburg: | 6 minutes |
| Sutherlin: | 6 minutes |
| Myrtle Creek: | 7 minutes |
| Cottage Grove: | 6 minutes |
| Eugene: | 6 minutes |
| Junction City: | 9 minutes |
 According to the data from the years 2002 - 2018 the average number of fire-related fatalities per year is 0. The highest number of deaths - 1 took place in 2004, and the lowest - 0 in 2002. The data has a constant trend.
 According to the reports from the years 2002 - 2018 the average number of fire-related casualties per year is 0. The highest number of reported casualties - 2 took place in 2008, and the lowest - 0 in 2003. The data has a decreasing trend.
The average number of casualties per 1,000 fire incidents is 8. This indicator was the highest - 57 in 2008, and the lowest 0 in 2003. The trend for casualties per 1,000 fires is decreasing. Compared to the Oregon value the number of casualties per 1,000 fire incidents is much lower.
According to the reports from the years 2002 - 2018 the average number of fire-related casualties per year is 0. The highest number of reported casualties - 2 took place in 2008, and the lowest - 0 in 2003. The data has a decreasing trend.
The average number of casualties per 1,000 fire incidents is 8. This indicator was the highest - 57 in 2008, and the lowest 0 in 2003. The trend for casualties per 1,000 fires is decreasing. Compared to the Oregon value the number of casualties per 1,000 fire incidents is much lower.Casualties per 1,000 incidents in Coos Bay, OR compared to nearest cities:
(Note: Based on data for all years, including only cities with at least 500 fire incidents)
| Coos Bay: | 5.4 |
| North Bend: | 17.5 |
| Florence: | 9.3 |
| Roseburg: | 14.4 |
| Sutherlin: | 8.1 |
| Myrtle Creek: | 4.1 |
| Cottage Grove: | 5.0 |
| Eugene: | 13.8 |
| Junction City: | 7.4 |
 32.7% incidents where reported in the morning and 67.3% in the evening. The most fires (16.1%) took place on Saturday, and the least (12.0%) on Thursday.
 Based on the 924 incident reports from years 2002 - 2018 most fires (14.8%) took place during July, and the least (6.2%) in February.
 Out of all 8,777 cases reported during the years 2002 - 2018, the most belonged to the categories: Rescue & EMS (62.4%), Good Intent Call (11.2%), and Service Call (10.7%).
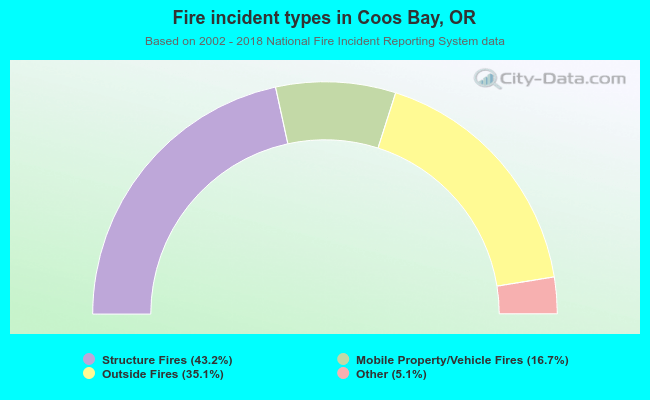 When looking into fire subcategories, the most incidents belonged to: Structure Fires (43.2%), and Outside Fires (35.1%).