Detroit Lakes: Fire Incidents, Minnesota (MN)
Where are fire incidents reported in Detroit Lakes, MN
Something went wrong! Please refresh the page.
|
| |||||||||||||||||||||||||||||||||||||||||||||||||||||||||||||||||||||||||||||||||||||||||||||||||||||||||||||
| Other | 427 | |||||||||||||||||||||||||||||||||||||||||||||||||||||||||||||||||||||||||||||||||||||||||||||||||||||||||||||
2002 - 2018 National Fire Incident Reporting System (NFIRS) incidents
- Incident types reported to NFIRS in Detroit Lakes, MN
- 93740.0%Fire
- 56123.9%Hazardous Condition
- 38216.3%Good Intent Call
- 2149.1%False Alarm
- 1606.8%Rescue & EMS
- 713.0%Service Call
- 90.4%Overpressure Rupture
- 70.3%Severe Weather
- Fire incident types reported to NFIRS in Detroit Lakes, MN
- 43146.0%Structure Fires
- 33035.2%Outside Fires
- 12213.0%Mobile Property/Vehicle Fires
- 545.8%Other
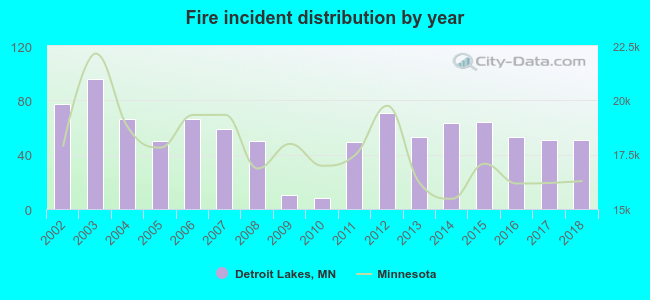 According to the data from the years 2002 - 2018 the average number of fire incidents per year is 55. The highest number of fire incidents - 96 took place in 2003, and the least - 8 in 2010. The data has a dropping trend.
The average number of yearly fire incidents per 10k residents in Detroit Lakes, MN compared to nearest cities:
(Note: Based on data for the last 3 years, including only cities with population 5,000 and above)
| Detroit Lakes: | 57.7 |
| Fergus Falls: | 33.3 |
| Moorhead: | 17.4 |
 The median response time based on all reported fire incidents is 4 minutes. This is lower compared to the Minnesota median value.
The median response time in Detroit Lakes, MN compared to nearest cities:
(Note: Based on data for all years, including only cities with at least 500 fire incidents)
| Detroit Lakes: | 4 minutes |
| Frazee: | 8 minutes |
| Park Rapids: | 9 minutes |
| Fergus Falls: | 8 minutes |
| Moorhead: | 5 minutes |
 32.0% incidents where reported in the morning and 68.0% in the evening. The most fires (18.7%) took place on Sunday, and the least (10.2%) on Thursday.
 According to the 937 incident reports from years 2002 - 2018 most fires (13.7%) took place during April, and the least (6.0%) in January.
 Out of all 2,343 cases reported during the years 2002 - 2018, the most belonged to the categories: Fire (40.0%), Hazardous Condition (23.9%), and Good Intent Call (16.3%).
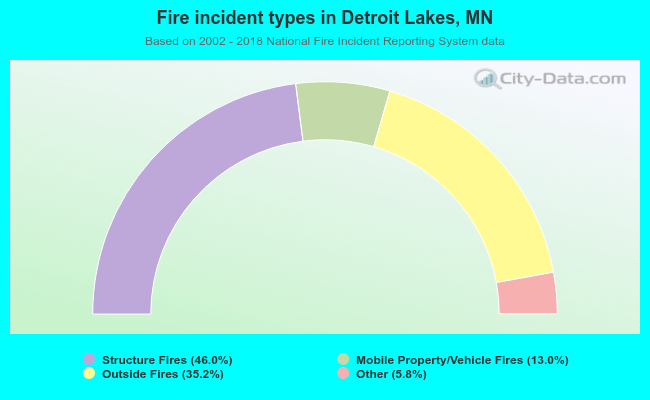 When looking into fire subcategories, the most incidents belonged to: Structure Fires (46.0%), and Outside Fires (35.2%).