Honolulu: Fire Incidents, Hawaii (HI)
Where are fire incidents reported in Honolulu, HI
Something went wrong! Please refresh the page.
| Fire incidents reported | |
|---|---|
| Sreet name | Count |
| KING ST | 946 |
| NIMITZ HWY | 622 |
| KALAKAUA AVE | 586 |
| LINAPUNI ST | 464 |
| KAPIOLANI BLVD | 456 |
| BERETANIA ST | 388 |
| ALA MOANA | 386 |
| KALANIANAOLE HWY | 386 |
| KALIHI ST | 364 |
| SCHOOL ST | 302 |
| WAIALAE AVE | 294 |
| DILLINGHAM BLVD | 280 |
| PALI HWY | 240 |
| KUHIO AVE | 238 |
| ALA WAI BLVD | 194 |
| NUUANU AVE | 188 |
| KAPAHULU AVE | 180 |
| DATE ST | 174 |
| WILDER AVE | 170 |
| SAND ISLAND ACC RD | 158 |
| KEEAUMOKU ST | 154 |
| ALA ILIMA | 152 |
| KAM HWY | 152 |
| H1 FWY | 150 |
| LILIHA ST | 150 |
| PALOLO AVE | 150 |
| SAND ISLAND PKY | 148 |
| DIAMOND HEAD RD | 144 |
| UNIVERSITY AVE | 144 |
| ALA MOANA PARK | 140 |
| Other | 2,789 |
2003 - 2018 National Fire Incident Reporting System (NFIRS) incidents
- Incident types reported to NFIRS in Honolulu, HI
- 62,03352.2%Rescue & EMS
- 23,08619.4%Good Intent Call
- 11,2899.5%Fire
- 10,7719.1%Hazardous Condition
- 5,9395.0%False Alarm
- 5,6184.7%Service Call
- Fire incident types reported to NFIRS in Honolulu, HI
- 5,36147.5%Outside Fires
- 4,12936.6%Structure Fires
- 1,77515.7%Mobile Property/Vehicle Fires
- 240.2%Other
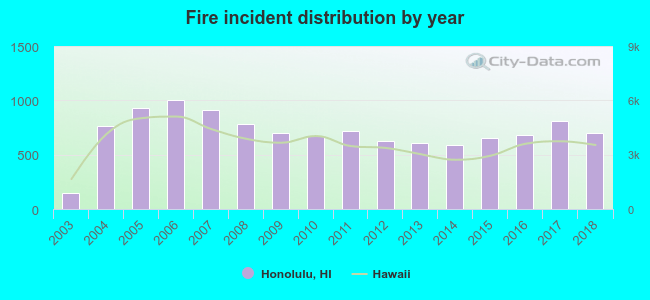 According to the data from the years 2003 - 2018 the average number of fires per year is 706. The highest number of reported fires - 1,001 took place in 2006, and the least - 150 in 2003. The data has a growing trend.
The average number of yearly fire incidents per 10k residents in Honolulu, HI compared to nearest cities:
(Note: Based on data for the last 3 years, including only cities with population 5,000 and above)
| Honolulu: | 19.5 |
| Waimanalo: | 80.7 |
| Kaneohe: | 17.5 |
| Aiea: | 76.7 |
| Pearl City: | 13.9 |
| Ewa Beach: | 50.4 |
| Waipahu: | 36.5 |
| Waipio: | 11.1 |
| Kapolei: | 85.2 |
 The median response time based on all reported fire incidents is 5 minutes. This is lower compared to the state median value.
The median response time in Honolulu, HI compared to nearest cities:
(Note: Based on data for all years, including only cities with at least 500 fire incidents)
| Honolulu: | 5 minutes |
| Waimanalo: | 7 minutes |
| Kaneohe: | 6 minutes |
| Aiea: | 7 minutes |
| Pearl City: | 7 minutes |
| Ewa Beach: | 7 minutes |
| Waipahu: | 7 minutes |
| Kapolei: | 7 minutes |
| Mililani Town: | 6 minutes |
 Based on the data from the years 2003 - 2018 the average number of fire-related yearly deaths is 1. The highest number of deaths - 5 took place in 2017, and the lowest - 0 in 2003. The data has a rising trend.
The average number of fatalities per 1,000 fire incidents is 2. This indicator was the highest - 6 in 2017, and the lowest 0 in 2003. The trend for fatalities per 1,000 incidents is increasing. Compared to the state value the number of fatalities per 1,000 fire incidents is higher.
Based on the data from the years 2003 - 2018 the average number of fire-related yearly deaths is 1. The highest number of deaths - 5 took place in 2017, and the lowest - 0 in 2003. The data has a rising trend.
The average number of fatalities per 1,000 fire incidents is 2. This indicator was the highest - 6 in 2017, and the lowest 0 in 2003. The trend for fatalities per 1,000 incidents is increasing. Compared to the state value the number of fatalities per 1,000 fire incidents is higher.
 Based on the reports from the years 2003 - 2018 the average number of fire-related casualties per year is 7. The highest number of casualties - 13 took place in 2007, and the lowest - 1 in 2003. The data has a rising trend.
The average number of casualties per 1,000 fire incidents is 9. This indicator was the highest - 17 in 2011, and the lowest 3 in 2012. The trend for injuries per 1,000 fires is growing. Compared to the state value the number of casualties per 1,000 fire incidents is higher.
Based on the reports from the years 2003 - 2018 the average number of fire-related casualties per year is 7. The highest number of casualties - 13 took place in 2007, and the lowest - 1 in 2003. The data has a rising trend.
The average number of casualties per 1,000 fire incidents is 9. This indicator was the highest - 17 in 2011, and the lowest 3 in 2012. The trend for injuries per 1,000 fires is growing. Compared to the state value the number of casualties per 1,000 fire incidents is higher.Casualties per 1,000 incidents in Honolulu, HI compared to nearest cities:
(Note: Based on data for all years, including only cities with at least 500 fire incidents)
| Honolulu: | 9.7 |
| Waimanalo: | 8.2 |
| Kaneohe: | 7.5 |
| Aiea: | 8.3 |
| Pearl City: | 12.2 |
| Ewa Beach: | 8.1 |
| Waipahu: | 11.4 |
| Kapolei: | 6.3 |
| Mililani Town: | 6.9 |
 38.5% incidents where reported in the morning and 61.5% in the evening. The most fires (15.2%) took place on Sunday, and the least (13.5%) on Tuesday.
 According to the 11,289 fires from years 2003 - 2018 most fires (10.7%) took place during July, and the least (6.8%) in February.
 Out of all 118,799 cases reported during the years 2003 - 2018, the most belonged to the categories: Rescue & EMS (52.2%), Good Intent Call (19.4%), and Fire (9.5%).
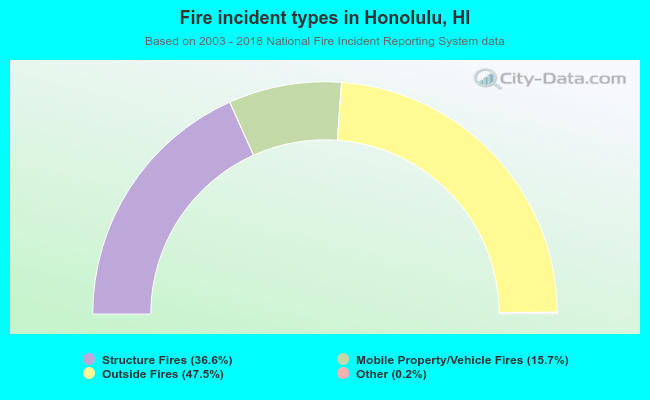 When looking into fire subcategories, the most incidents belonged to: Outside Fires (47.5%), and Structure Fires (36.6%).