Kapaa: Fire Incidents, Hawaii (HI)
Where are fire incidents reported in Kapaa, HI
Something went wrong! Please refresh the page.
|
| |||||||||||||||||||||||||||||||||||||||||||||||||||||||||||||||||||||||||||||||||||||||||||||||||||||||||||||
2003 - 2018 National Fire Incident Reporting System (NFIRS) incidents
- Incident types reported to NFIRS in Kapaa, HI
- 2,12867.8%Rescue & EMS
- 37111.8%Fire
- 3029.6%Good Intent Call
- 1635.2%Service Call
- 1003.2%Hazardous Condition
- 702.2%False Alarm
- 50.2%Special Incident
- Fire incident types reported to NFIRS in Kapaa, HI
- 23262.5%Outside Fires
- 7520.2%Structure Fires
- 5514.8%Mobile Property/Vehicle Fires
- 92.4%Other
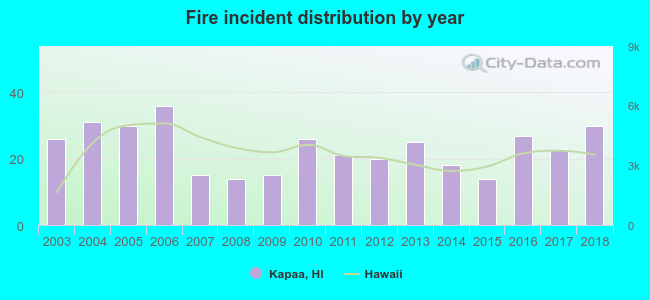 Based on the data from the years 2003 - 2018 the average number of fires per year is 23. The highest number of fire incidents - 36 took place in 2006, and the least - 14 in 2008. The data has a growing trend.

 35.8% incidents where reported in the morning and 64.2% in the evening. The most fires (16.4%) took place on Monday, and the least (11.1%) on Wednesday.
 According to the 371 incident reports from years 2003 - 2018 most fires (11.3%) took place during September, and the least (5.7%) in December.
 Out of all 3,139 cases reported during the years 2003 - 2018, the most belonged to the categories: Overpressure Rupture (67.8%), Fire (11.8%), and Service Call (9.6%).
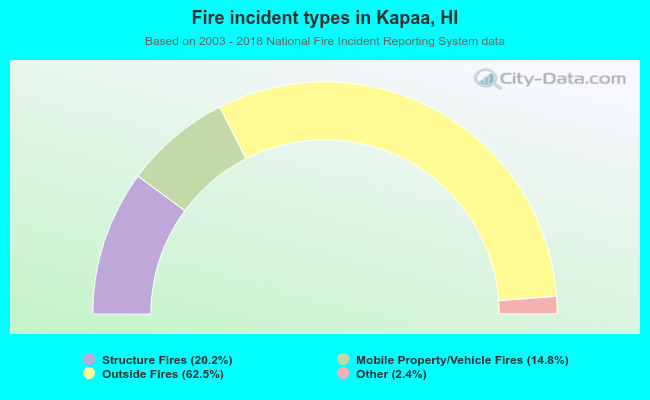 When looking into fire subcategories, the most reports belonged to: Outside Fires (62.5%), and Structure Fires (20.2%).