Kearny: Fire Incidents, New Jersey (NJ)
Where are fire incidents reported in Kearny, NJ
Something went wrong! Please refresh the page.
| Fire incidents reported | |
|---|---|
| Sreet name | Count |
| KEARNY AVE | 220 |
| HARRISON AVE | 138 |
| KEARNY AVE | 100 |
| SCHUYLER AVE | 98 |
| PASSAIC AVE | 92 |
| DEVON ST | 84 |
| BELGROVE DR | 80 |
| CHESTNUT ST | 76 |
| BELLEVILLE TPKE | 68 |
| BERGEN AVE | 66 |
| SPRUCE ST | 66 |
| DAVIS AVE | 60 |
| NEWARK TPKE | 58 |
| ELM ST | 56 |
| HARRISON AVE | 56 |
| DEVON ST | 54 |
| HACKENSACK AVE | 52 |
| BELLEVILLE TPKE | 50 |
| MIDLAND AVE | 46 |
| NEW JERSEY TPKE | 46 |
| PASSAIC AVE | 46 |
| NEWARK TPKE | 42 |
| SCHUYLER AVE | 40 |
| CHESTNUT ST | 34 |
| ELM ST | 34 |
| FOREST ST | 34 |
| WINDSOR ST | 34 |
| HIGHLAND AVE | 32 |
| MAPLE ST | 32 |
| FISH HOUSE RD | 30 |
2003 - 2018 National Fire Incident Reporting System (NFIRS) incidents
- Incident types reported to NFIRS in Kearny, NJ
- 5,56335.8%Hazardous Condition
- 3,04719.6%Rescue & EMS
- 2,26114.6%False Alarm
- 1,81111.7%Fire
- 1,76311.4%Service Call
- 9416.1%Good Intent Call
- 830.5%Special Incident
- 410.3%Overpressure Rupture
- Fire incident types reported to NFIRS in Kearny, NJ
- 81344.9%Structure Fires
- 49227.2%Outside Fires
- 42223.3%Mobile Property/Vehicle Fires
- 844.6%Other
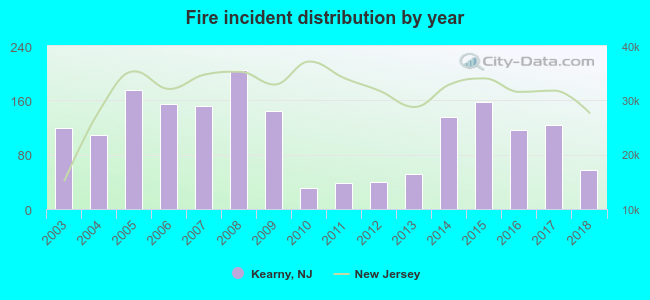 Based on the data from the years 2003 - 2018 the average number of fires per year is 113. The highest number of reported fire incidents - 205 took place in 2008, and the least - 31 in 2010. The data has a decreasing trend.
The average number of yearly fire incidents per 10k residents in Kearny, NJ compared to nearest cities:
(Note: Based on data for the last 3 years, including only cities with population 5,000 and above)
| Kearny: | 23.8 |
| Harrison: | 30.8 |
| North Arlington: | 24.8 |
| Belleville: | 25.0 |
| Newark: | 41.2 |
| Lyndhurst: | 39.0 |
| Bloomfield: | 31.3 |
| East Orange: | 48.4 |
| Nutley: | 44.0 |
 The median response time based on all reported fire incidents is 4 minutes. This is lower than the New Jersey median value.
The median response time in Kearny, NJ compared to nearest cities:
(Note: Based on data for all years, including only cities with at least 500 fire incidents)
| Kearny: | 4 minutes |
| Harrison: | 2 minutes |
| Belleville: | 3 minutes |
| Newark: | 3 minutes |
| Lyndhurst: | 3 minutes |
| Bloomfield: | 2 minutes |
| East Orange: | 4 minutes |
| Nutley: | 2 minutes |
| Secaucus: | 4 minutes |
 According to the reports from the years 2003 - 2018 the average number of fire-related yearly deaths is 0. The highest number of reported deaths - 2 took place in 2017, and the lowest - 0 in 2003. The data has a constant trend.
 Based on the data from the years 2003 - 2018 the average number of fire-related casualties per year is 2. The highest number of reported casualties - 7 took place in 2014, and the lowest - 0 in 2003. The data has a constant trend.
The average number of casualties per 1,000 fires is 14. This indicator was the highest - 52 in 2014, and the lowest 0 in 2003. The trend for injuries per 1,000 incidents is constant. Compared to the state value the number of casualties per 1,000 fire incidents is higher.
Based on the data from the years 2003 - 2018 the average number of fire-related casualties per year is 2. The highest number of reported casualties - 7 took place in 2014, and the lowest - 0 in 2003. The data has a constant trend.
The average number of casualties per 1,000 fires is 14. This indicator was the highest - 52 in 2014, and the lowest 0 in 2003. The trend for injuries per 1,000 incidents is constant. Compared to the state value the number of casualties per 1,000 fire incidents is higher.Casualties per 1,000 incidents in Kearny, NJ compared to nearest cities:
(Note: Based on data for all years, including only cities with at least 500 fire incidents)
| Kearny: | 16.0 |
| Harrison: | 8.3 |
| Belleville: | 10.2 |
| Newark: | 5.7 |
| Lyndhurst: | 6.0 |
| Bloomfield: | 9.9 |
| East Orange: | 10.9 |
| Nutley: | 10.7 |
| Secaucus: | 5.0 |
 30.1% incidents where reported in the morning and 69.9% in the evening. The most fires (16.3%) took place on Saturday, and the least (12.8%) on Tuesday.
 Based on the 1,811 fire incidents from years 2003 - 2018 most fires (10.3%) took place during April, and the least (6.7%) in August.
 Out of all 15,520 cases reported during the years 2003 - 2018, the most belonged to the categories: Hazardous Condition (35.8%), Rescue & EMS (19.6%), and False Alarm (14.6%).
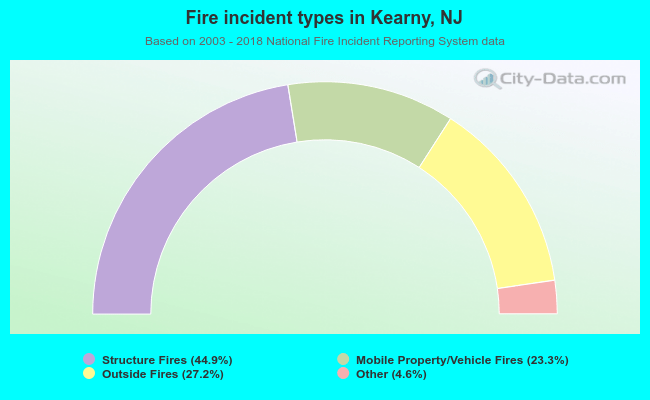 When looking into fire subcategories, the most reports belonged to: Structure Fires (44.9%), and Outside Fires (27.2%).