Keizer: Fire Incidents, Oregon (OR)
Where are fire incidents reported in Keizer, OR
Something went wrong! Please refresh the page.
| Fire incidents reported | |
|---|---|
| Sreet name | Count |
| RIVER RD | 318 |
| CHEMAWA RD | 116 |
| CHERRY AVE | 72 |
| LOCKHAVEN DR | 52 |
| CUMMINGS LN | 38 |
| PLYMOUTH DR | 36 |
| VERDA LN | 36 |
| CLEARVIEW AVE | 34 |
| DEARBORN AVE | 30 |
| ULALI DR | 30 |
| WINDSOR ISLAND RD | 28 |
| MANBRIN DR | 26 |
| 13TH AVE | 22 |
| 14TH AVE | 22 |
| KEIZER RD | 22 |
| KENNEDY CIR | 22 |
| 22ND AVE | 20 |
| APPLEBLOSSOM AVE | 20 |
| PARTRIDGE LN | 20 |
| 7TH AVE | 18 |
| ALDER DR | 18 |
| RIVERCREST DR | 18 |
| KEIZER STATION BLVD | 16 |
| SUNSET AVE | 16 |
| SUSAN CT | 16 |
| ALLENDALE WAY | 14 |
| ARLETA AVE | 14 |
| WHEATLAND RD | 14 |
| CHURCHDALE AVE | 12 |
| DIXON ST | 12 |
2002 - 2018 National Fire Incident Reporting System (NFIRS) incidents
- Incident types reported to NFIRS in Keizer, OR
- 9,39369.5%Rescue & EMS
- 1,2859.5%Service Call
- 1,1138.2%Fire
- 7835.8%Good Intent Call
- 6234.6%Hazardous Condition
- 3202.4%False Alarm
- Fire incident types reported to NFIRS in Keizer, OR
- 49444.4%Outside Fires
- 48543.6%Structure Fires
- 13412.0%Mobile Property/Vehicle Fires
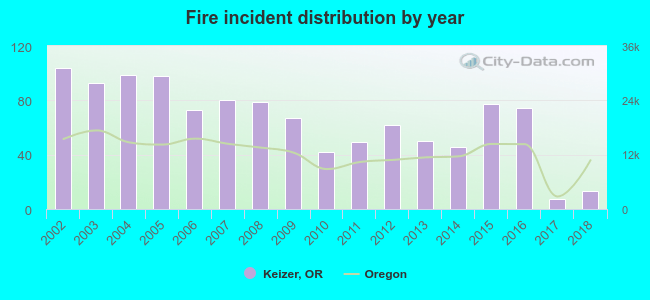 Based on the data from the years 2002 - 2018 the average number of fires per year is 65. The highest number of fires - 104 took place in 2002, and the least - 7 in 2017. The data has a decreasing trend.
The average number of yearly fire incidents per 10k residents in Keizer, OR compared to nearest cities:
(Note: Based on data for the last 3 years, including only cities with population 5,000 and above)
| Keizer: | 8.4 |
| Salem: | 25.0 |
| Four Corners: | 1.9 |
| Silverton: | 22.1 |
| Woodburn: | 23.9 |
| Independence: | 14.4 |
| Monmouth: | 14.7 |
| Dallas: | 26.9 |
| McMinnville: | 7.8 |
 The median response time based on all reported fire incidents is 5 minutes. This is lower than the Oregon median value.
The median response time in Keizer, OR compared to nearest cities:
(Note: Based on data for all years, including only cities with at least 500 fire incidents)
| Keizer: | 5 minutes |
| Salem: | 5 minutes |
| Turner: | 10 minutes |
| Silverton: | 8 minutes |
| Woodburn: | 7 minutes |
| Dallas: | 7 minutes |
| McMinnville: | 6 minutes |
| Stayton: | 8 minutes |
| Sheridan: | 8 minutes |
 Based on the data from the years 2002 - 2018 the average number of fire-related casualties per year is 1. The highest number of reported casualties - 4 took place in 2005, and the lowest - 0 in 2002. The data has a constant trend.
The average number of injuries per 1,000 fires is 22. This indicator was the highest - 61 in 2011, and the lowest 0 in 2002. The trend for casualties per 1,000 fires is decreasing. Compared to the state value the number of casualties per 1,000 fires is higher.
Based on the data from the years 2002 - 2018 the average number of fire-related casualties per year is 1. The highest number of reported casualties - 4 took place in 2005, and the lowest - 0 in 2002. The data has a constant trend.
The average number of injuries per 1,000 fires is 22. This indicator was the highest - 61 in 2011, and the lowest 0 in 2002. The trend for casualties per 1,000 fires is decreasing. Compared to the state value the number of casualties per 1,000 fires is higher.
 30.7% incidents where reported in the morning and 69.3% in the evening. The most fires (15.7%) took place on Saturday, and the least (13.4%) on Wednesday.
 According to the 1,113 fire incidents from years 2002 - 2018 most fires (15.7%) took place during July, and the least (4.5%) in February.
 Out of all 13,518 cases reported during the years 2002 - 2018, the most belonged to the categories: Overpressure Rupture (69.5%), Hazardous Condition (9.5%), and Fire (8.2%).
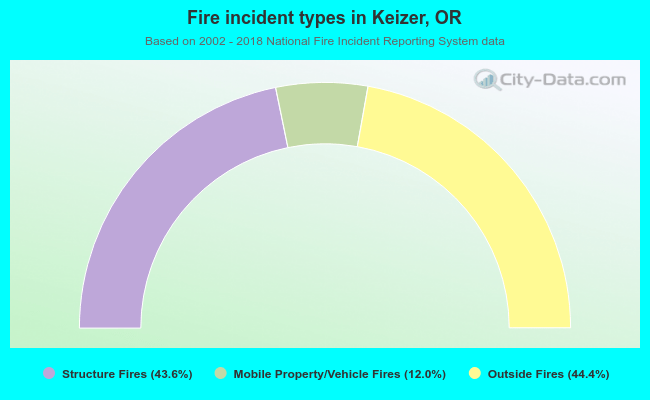 When looking into fire subcategories, the most incidents belonged to: Outside Fires (44.4%), and Structure Fires (43.6%).