Lahaina: Fire Incidents, Hawaii (HI)
Where are fire incidents reported in Lahaina, HI
Something went wrong! Please refresh the page.
|
| |||||||||||||||||||||||||||||||||||||||||||||||||||||||||||||||||||||||||||||||||||||||||||||||||||||||||||||
2002 - 2018 National Fire Incident Reporting System (NFIRS) incidents
- Incident types reported to NFIRS in Lahaina, HI
- 3,22948.4%Rescue & EMS
- 1,22618.4%Good Intent Call
- 1,11416.7%Fire
- 4196.3%Hazardous Condition
- 3655.5%False Alarm
- 3124.7%Service Call
- Fire incident types reported to NFIRS in Lahaina, HI
- 72164.7%Outside Fires
- 25122.5%Structure Fires
- 13311.9%Mobile Property/Vehicle Fires
- 90.8%Other
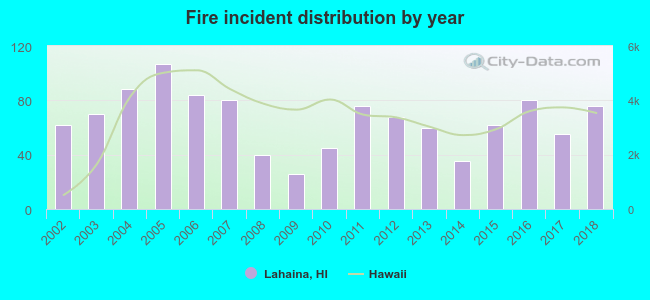 According to the data from the years 2002 - 2018 the average number of fires per year is 66. The highest number of reported fires - 107 took place in 2005, and the least - 26 in 2009. The data has a growing trend.
The average number of yearly fire incidents per 10k residents in Lahaina, HI compared to nearest cities:
(Note: Based on data for the last 3 years, including only cities with population 5,000 and above)
| Lahaina: | 60.1 |
| Wailuku: | 23.3 |
| Kahului: | 29.2 |
| Kihei: | 28.1 |
| Pukalani: | 20.2 |
| Kula: | 34.5 |
| Makawao: | 20.4 |
| Waimanalo: | 80.7 |
| Honolulu: | 19.5 |
 The median response time based on all reported fire incidents is 8 minutes. This is comparable to the state median value.
The median response time in Lahaina, HI compared to nearest cities:
(Note: Based on data for all years, including only cities with at least 500 fire incidents)
| Lahaina: | 8 minutes |
| Wailuku: | 6 minutes |
| Kahului: | 6 minutes |
| Kihei: | 6 minutes |
| Paia: | 6 minutes |
| Waimanalo: | 7 minutes |
| Honolulu: | 5 minutes |
| Kaneohe: | 6 minutes |
| Aiea: | 7 minutes |
 39.6% incidents where reported in the morning and 60.4% in the evening. The most fires (15.4%) took place on Wednesday, and the least (11.9%) on Monday.
 According to the 1,114 fires from years 2002 - 2018 most fires (17.8%) took place during July, and the least (5.9%) in April.
 Out of all 6,668 cases reported during the years 2002 - 2018, the most belonged to the categories: Rescue & EMS (48.4%), Good Intent Call (18.4%), and Fire (16.7%).
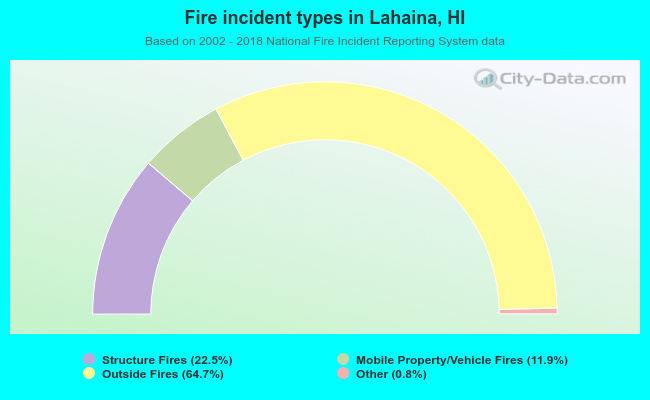 When looking into fire subcategories, the most reports belonged to: Outside Fires (64.7%), and Structure Fires (22.5%).