Lihue: Fire Incidents, Hawaii (HI)
Where are fire incidents reported in Lihue, HI
Something went wrong! Please refresh the page.
|
| |||||||||||||||||||||||||||||||||||||||||||||||||||||||||||||||||||||||||||||||||||||||||||||||||||||||||||||
2003 - 2018 National Fire Incident Reporting System (NFIRS) incidents
- Incident types reported to NFIRS in Lihue, HI
- 3,02369.2%Rescue & EMS
- 4139.5%Good Intent Call
- 3367.7%Service Call
- 3207.3%Fire
- 1443.3%False Alarm
- 1232.8%Hazardous Condition
- 50.1%Special Incident
- Fire incident types reported to NFIRS in Lihue, HI
- 17153.4%Outside Fires
- 8125.3%Structure Fires
- 5517.2%Mobile Property/Vehicle Fires
- 134.1%Other
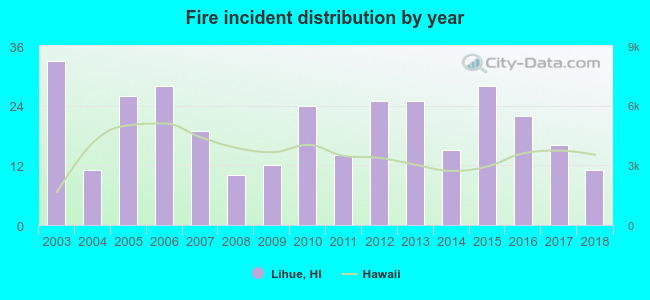 According to the data from the years 2003 - 2018 the average number of fires per year is 20. The highest number of reported fires - 33 took place in 2003, and the least - 10 in 2008. The data has a dropping trend.
The average number of yearly fire incidents per 10k residents in Lihue, HI compared to nearest cities:
(Note: Based on data for the last 3 years, including only cities with population 5,000 and above)
| Lihue: | 25.3 |
| Kapaa: | 24.9 |
| Makaha: | 25.0 |
| Waianae: | 229.7 |
| Maili: | 12.6 |
| Nanakuli: | 7.6 |
| Wahiawa: | 36.5 |
| Makakilo: | 2.7 |
| Mililani Town: | 6.3 |

 39.4% incidents where reported in the morning and 60.6% in the evening. The most fires (15.0%) took place on Monday, and the least (12.5%) on Sunday.
 Based on the 320 fire incident reports from years 2003 - 2018 most fires (12.2%) took place during July, and the least (6.3%) in March.
 Out of all 4,367 cases reported during the years 2003 - 2018, the most belonged to the categories: Rescue & EMS (69.2%), Good Intent Call (9.5%), and Service Call (7.7%).
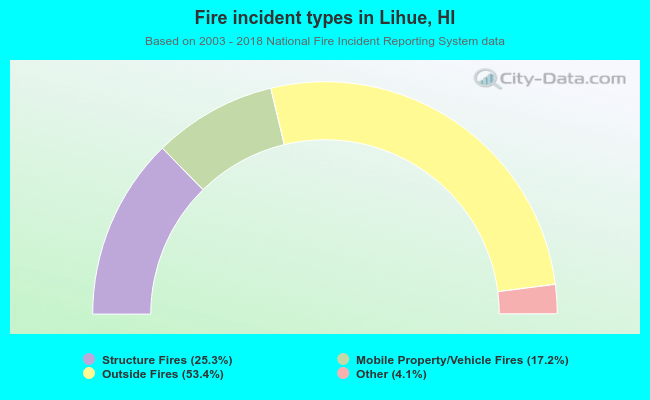 When looking into fire subcategories, the most reports belonged to: Outside Fires (53.4%), and Structure Fires (25.3%).