Lino Lakes: Fire Incidents, Minnesota (MN)
Where are fire incidents reported in Lino Lakes, MN
Something went wrong! Please refresh the page.
|
| |||||||||||||||||||||||||||||||||||||||||||||||||||||||||||||||||||||||||||||||||||||||||||||||||||||||||||||
2002 - 2018 National Fire Incident Reporting System (NFIRS) incidents
- Incident types reported to NFIRS in Lino Lakes, MN
- 1,63340.2%Rescue & EMS
- 79919.7%Hazardous Condition
- 58914.5%Fire
- 3849.4%False Alarm
- 3829.4%Service Call
- 2496.1%Good Intent Call
- 120.3%Overpressure Rupture
- 90.2%Severe Weather
- 80.2%Special Incident
- Fire incident types reported to NFIRS in Lino Lakes, MN
- 23740.2%Structure Fires
- 16628.2%Mobile Property/Vehicle Fires
- 16127.3%Outside Fires
- 254.2%Other
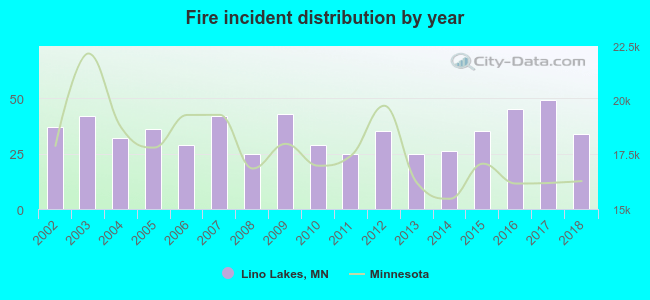 According to the data from the years 2002 - 2018 the average number of fires per year is 35. The highest number of fire incidents - 49 took place in 2017, and the least - 25 in 2008. The data has a declining trend.
The average number of yearly fire incidents per 10k residents in Lino Lakes, MN compared to nearest cities:
(Note: Based on data for the last 3 years, including only cities with population 5,000 and above)
| Lino Lakes: | 20.4 |
| Shoreview: | 11.8 |
| Blaine: | 16.9 |
| Hugo: | 19.2 |
| Mounds View: | 19.2 |
| Vadnais Heights: | 27.4 |
| White Bear Lake: | 19.1 |
| Spring Lake Park: | 22.7 |
| Ham Lake: | 25.2 |
 The median response time based on all reported fire incidents is 7 minutes. This is comparable to the Minnesota median value.
The median response time in Lino Lakes, MN compared to nearest cities:
(Note: Based on data for all years, including only cities with at least 500 fire incidents)
| Lino Lakes: | 7 minutes |
| Shoreview: | 6 minutes |
| Blaine: | 7 minutes |
| Hugo: | 9 minutes |
| Mounds View: | 7 minutes |
| Vadnais Heights: | 6 minutes |
| White Bear Lake: | 6 minutes |
| Ham Lake: | 7 minutes |
| New Brighton: | 4 minutes |
 30.4% incidents where reported in the morning and 69.6% in the evening. The most fires (16.1%) took place on Monday, and the least (12.2%) on Tuesday.
 According to the 589 reports from years 2002 - 2018 most fires (12.7%) took place during April, and the least (5.1%) in August.
 Out of all 4,065 cases reported during the years 2002 - 2018, the most belonged to the categories: Rescue & EMS (40.2%), Hazardous Condition (19.7%), and Fire (14.5%).
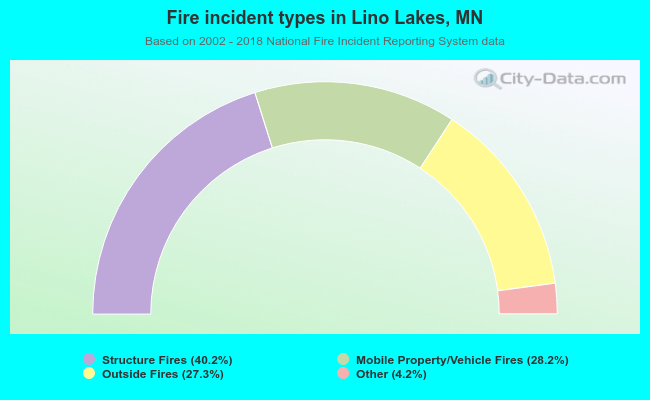 When looking into fire subcategories, the most incidents belonged to: Structure Fires (40.2%), and Mobile Property/Vehicle Fires (28.2%).