Minnetonka: Fire Incidents, Minnesota (MN)
Where are fire incidents reported in Minnetonka, MN
Something went wrong! Please refresh the page.
| Fire incidents reported | |
|---|---|
| Sreet name | Count |
| WAYZATA BLVD | 86 |
| CEDAR LAKE RD | 58 |
| CO RD 101 | 36 |
| MINNETONKA BLVD | 36 |
| BAKER RD | 34 |
| PLYMOUTH RD | 30 |
| HWY 7 | 28 |
| BREN RD | 26 |
| SHADY OAK RD | 24 |
| EXCELSIOR BLVD | 22 |
| OUTOFAREA WAY | 22 |
| HW 7 | 20 |
| RIDGEDALE DR | 20 |
| SMETANA DR | 20 |
| CLEAR SPRING RD | 18 |
| MARION LN | 18 |
| WAYZATA BL | 18 |
| EXCELSIOR BL | 16 |
| FAIRFIELD RD | 16 |
| HW 494 | 16 |
| CARLSON PKY | 14 |
| CEDAR BEND | 14 |
| GREEN BRIAR DR | 14 |
| HIGHWAY 7 | 14 |
| HW 394 | 14 |
| I394 | 14 |
| LINNER RD | 12 |
| MINNETONKA BL | 12 |
| OAKLAND RD | 12 |
| STRATFORD RD | 12 |
| Other | 316 |
2006 - 2018 National Fire Incident Reporting System (NFIRS) incidents
- Incident types reported to NFIRS in Minnetonka, MN
- 8,31458.3%Rescue & EMS
- 1,64911.6%Service Call
- 1,50010.5%Hazardous Condition
- 1,2238.6%False Alarm
- 1,0127.1%Fire
- 5453.8%Good Intent Call
- 150.1%Overpressure Rupture
- Fire incident types reported to NFIRS in Minnetonka, MN
- 51350.7%Structure Fires
- 27527.2%Outside Fires
- 19018.8%Mobile Property/Vehicle Fires
- 343.4%Other
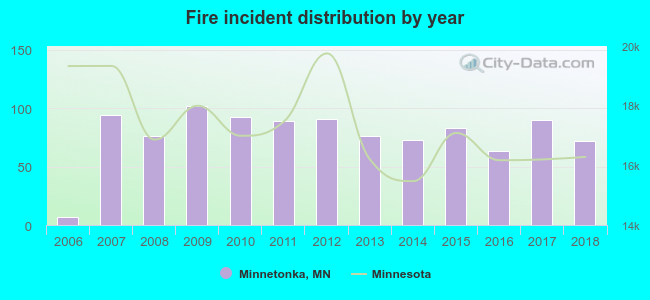 Based on the data from the years 2006 - 2018 the average number of fires per year is 78. The highest number of fires - 102 took place in 2009, and the least - 7 in 2006. The data has a rising trend.
The average number of yearly fire incidents per 10k residents in Minnetonka, MN compared to nearest cities:
(Note: Based on data for the last 3 years, including only cities with population 5,000 and above)
| Minnetonka: | 14.6 |
| Hopkins: | 30.1 |
| Eden Prairie: | 15.2 |
| Plymouth: | 26.9 |
| Edina: | 18.1 |
| Shorewood: | 10.6 |
| Chanhassen: | 11.3 |
| Golden Valley: | 25.9 |
| Orono: | 19.0 |
 The median response time based on all reported fire incidents is 7 minutes. This is close to the state median value.
The median response time in Minnetonka, MN compared to nearest cities:
(Note: Based on data for all years, including only cities with at least 500 fire incidents)
| Minnetonka: | 7 minutes |
| Hopkins: | 5 minutes |
| St. Louis Park: | 5 minutes |
| Eden Prairie: | 6 minutes |
| Plymouth: | 8 minutes |
| Edina: | 5 minutes |
| Golden Valley: | 7 minutes |
| New Hope: | 5 minutes |
| Crystal: | 5 minutes |
 Based on the data from the years 2006 - 2018 the average number of fire-related casualties per year is 2. The highest number of reported injuries - 5 took place in 2010, and the lowest - 0 in 2006. The data has a growing trend.
The average number of injuries per 1,000 fire incidents is 19. This indicator was the highest - 54 in 2010, and the lowest 0 in 2006. The trend for injuries per 1,000 incidents is rising. Compared to the Minnesota value the number of casualties per 1,000 incidents is higher.
Based on the data from the years 2006 - 2018 the average number of fire-related casualties per year is 2. The highest number of reported injuries - 5 took place in 2010, and the lowest - 0 in 2006. The data has a growing trend.
The average number of injuries per 1,000 fire incidents is 19. This indicator was the highest - 54 in 2010, and the lowest 0 in 2006. The trend for injuries per 1,000 incidents is rising. Compared to the Minnesota value the number of casualties per 1,000 incidents is higher.Casualties per 1,000 incidents in Minnetonka, MN compared to nearest cities:
(Note: Based on data for all years, including only cities with at least 500 fire incidents)
| Minnetonka: | 20.8 |
| Hopkins: | 17.8 |
| St. Louis Park: | 32.2 |
| Eden Prairie: | 22.6 |
| Plymouth: | 18.6 |
| Edina: | 40.5 |
| Golden Valley: | 2.1 |
| New Hope: | 11.0 |
| Crystal: | 13.1 |
 30.8% incidents where reported in the morning and 69.2% in the evening. The most fires (16.8%) took place on Monday, and the least (12.5%) on Wednesday.
 According to the 1,012 fire incidents from years 2006 - 2018 most fires (11.7%) took place during April, and the least (5.3%) in September.
 Out of all 14,268 cases reported during the years 2006 - 2018, the most belonged to the categories: Rescue & EMS (58.3%), Service Call (11.6%), and Hazardous Condition (10.5%).
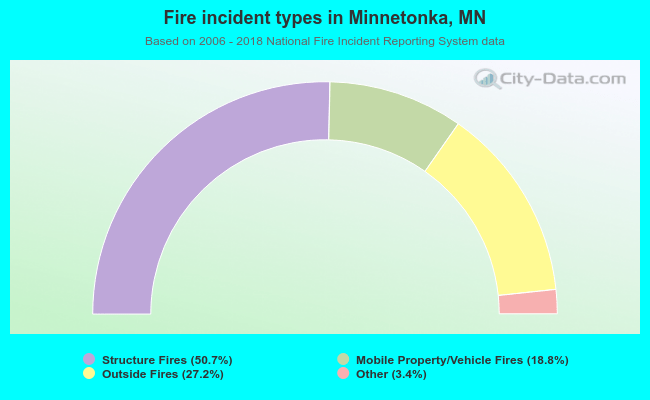 When looking into fire subcategories, the most incidents belonged to: Structure Fires (50.7%), and Outside Fires (27.2%).